
What is an Eye Hospital Clinical Dashboard?
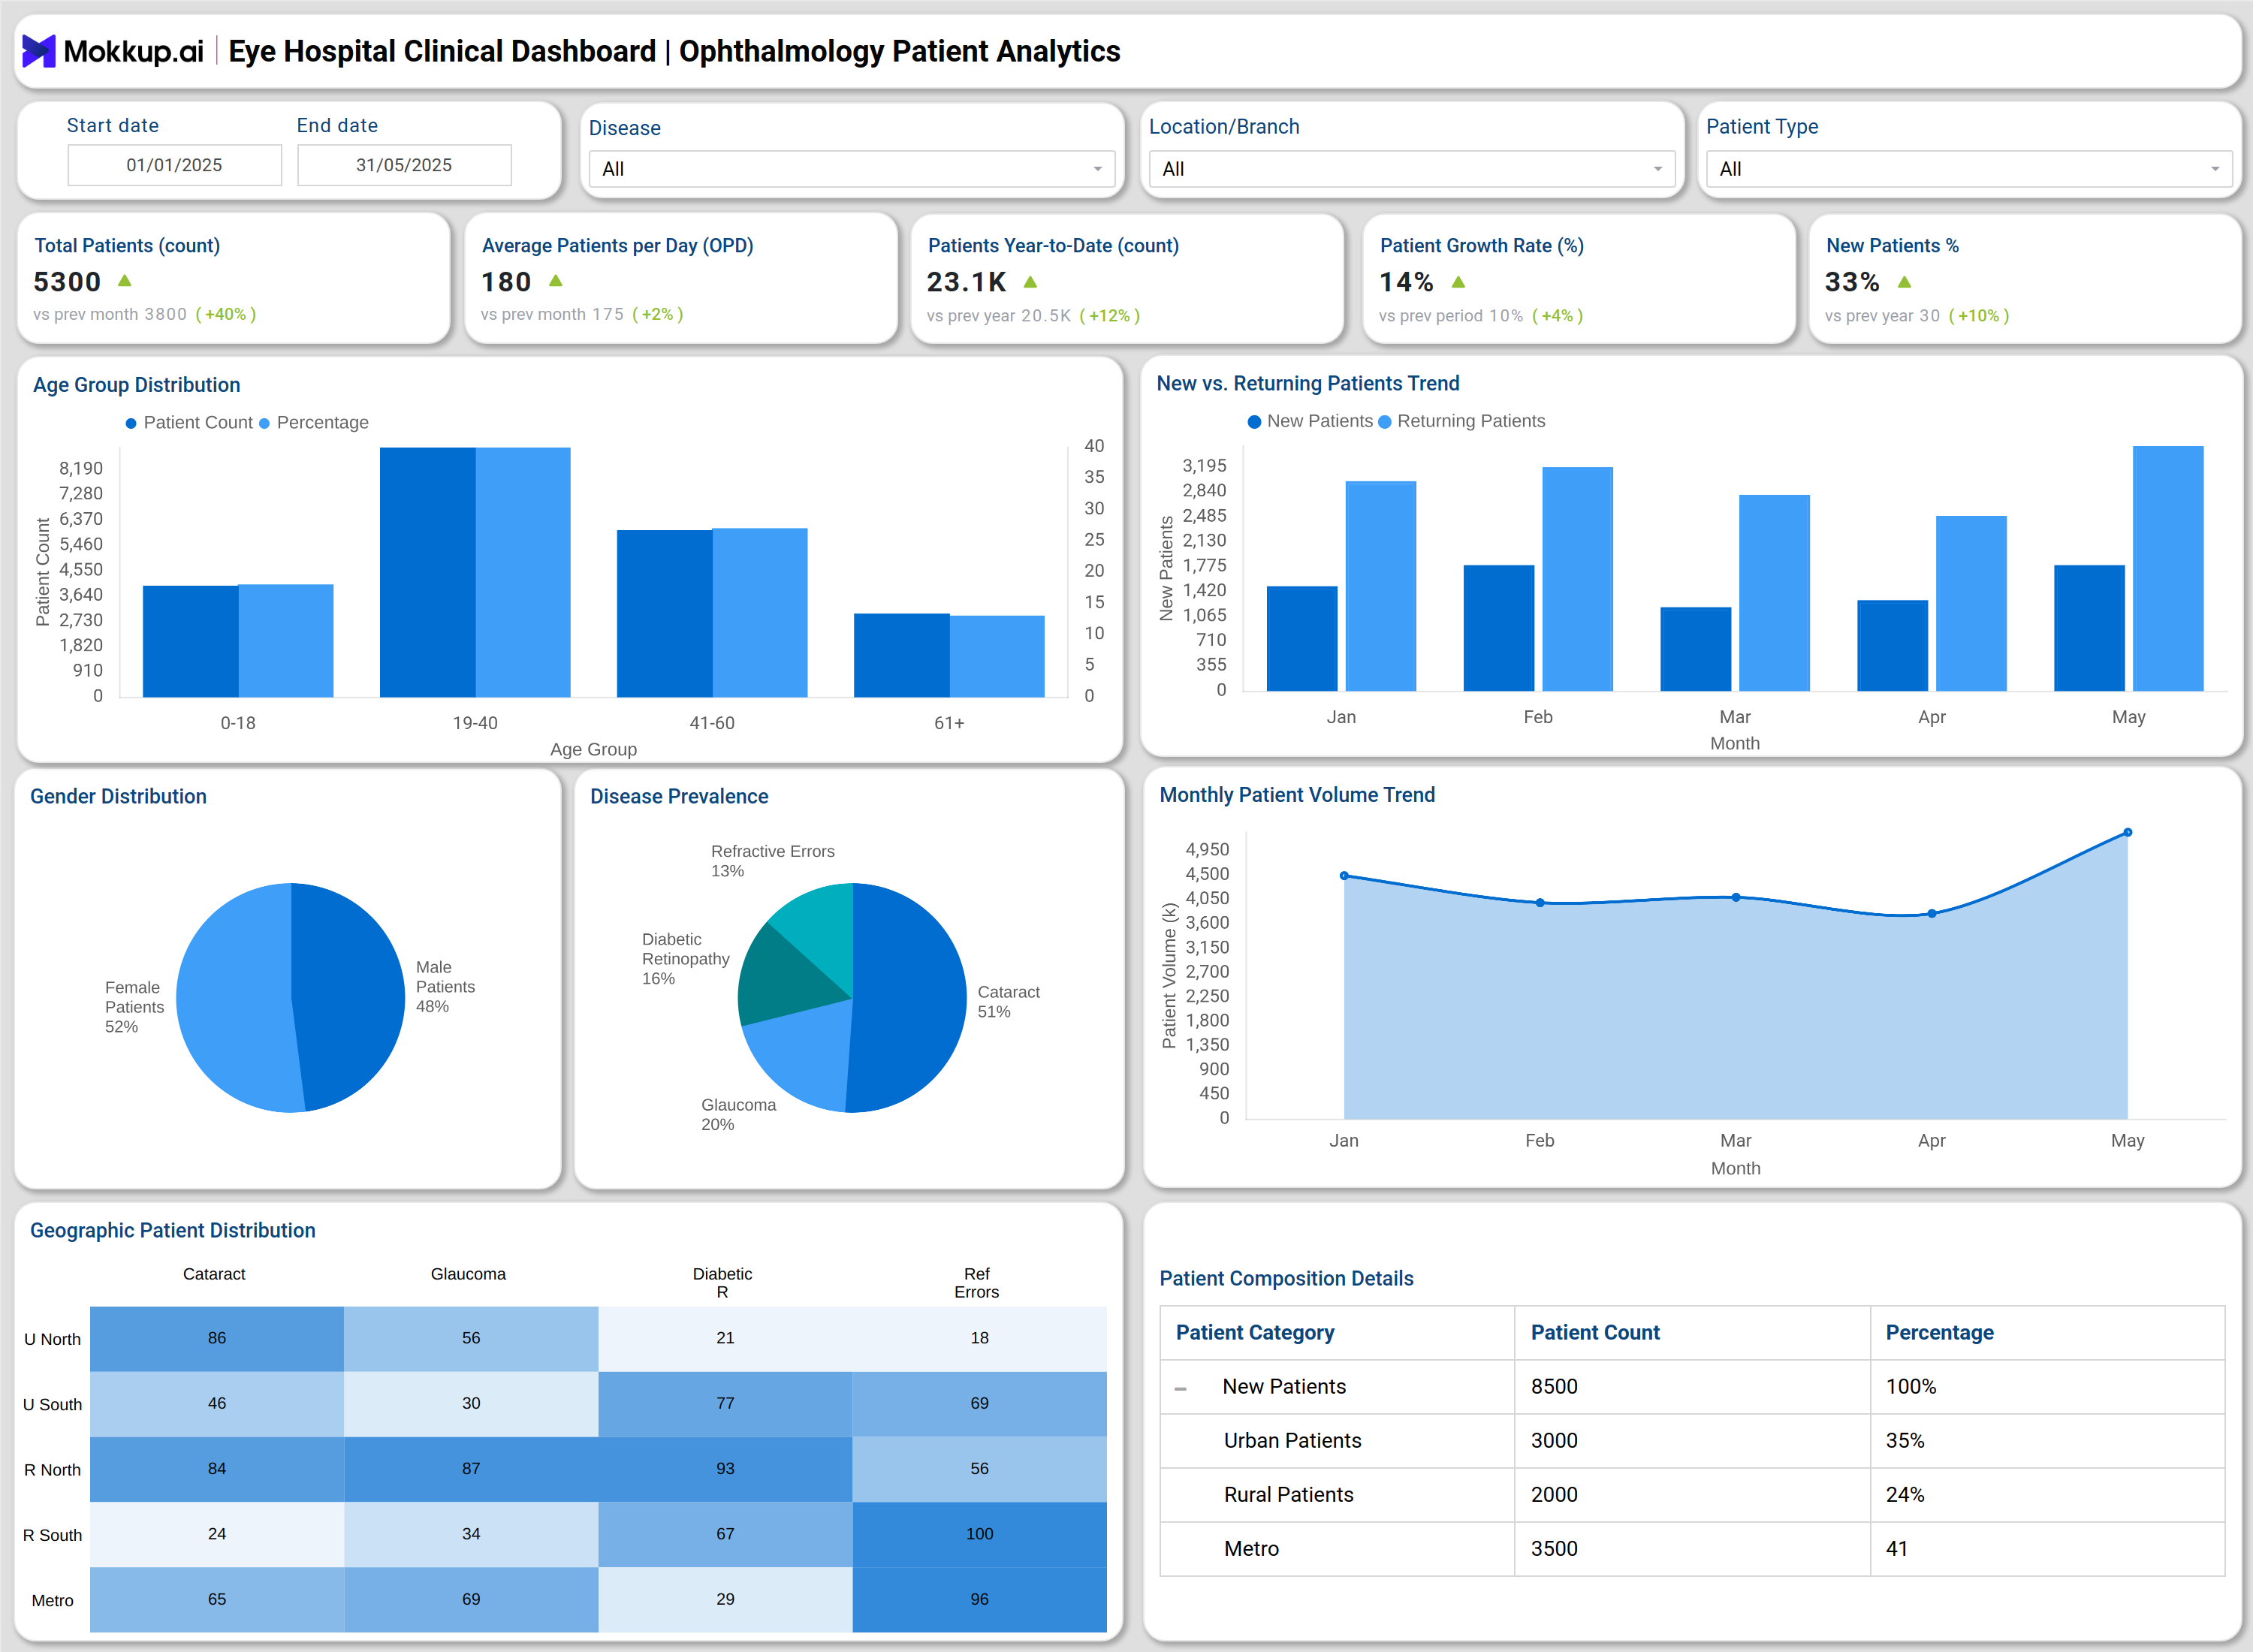
An Eye Hospital Clinical Dashboard is a centralized analytics platform designed to monitor ophthalmology workflows, patient outcomes, and outreach activities in real time. It enables chief medical officers, department heads, and surgeons to track clinical metrics such as patient demographics, surgical volumes, visual outcomes, and community screenings. By consolidating all critical data in one view, it acts as a real-time eye hospital performance monitoring tool that improves operational efficiency, strengthens patient safety, and supports compliance reporting.
How to Create Eye Hospital Clinical Dashboard
You don’t need to build your report from scratch—just start with a ready-to-use Eye Hospital Clinical Dashboard template from Mokkup. Add in your data and export it however you like. Here’s how to do it:
1. Create or Log in to Your Mokkup Account
Start by signing up on Mokkup.ai using your email. If you already have an account, just log in, and you’ll be good to go.
2. Choose and Customize Your Dashboard Template
Find the Eye Hospital Clinical Dashboard template in the Templates section. Use the drag-and-drop editor to adjust KPIs, edit filters, or add elements based on your data.
3. Export to Your BI Tool
Once your dashboard wireframe is ready, use the BI Tool Export feature to send it directly to Power BI or Tableau for further analysis and enhancements. You can also download the dashboard as a PDF, PNG, or JPEG, embed it on a platform, or invite your team to collaborate.
Note: This is a Pro template. You’ll need a Pro subscription on Mokkup to use and customize this dashboard wireframe. Upgrade anytime to unlock full access.
Eye Hospital Clinical Dashboard Example
You can create an Eye Hospital Clinical Dashboard with four focused views. Patient Demographics & Disease Trends track age, gender, geography, and condition prevalence to understand patient profiles. Surgical Performance monitors surgery types, OT utilization, cancellation rates, and surgeon productivity. Clinical Outcomes measure visual acuity improvements, complication rates, and readmission trends to evaluate treatment effectiveness. Preventive Screening & Outreach highlights community coverage, referral-to-treatment conversion, and screening efficiency. Together, these dashboards function as an eye hospital workflow and patient care analytics dashboard, giving leadership a clear picture of institutional performance.
How to Analyze Data in Eye Hospital Clinical Dashboard
For high patient satisfaction and outcomes, you can analyze this dashboard in the following ways:
- Monitor patient demographics - Use bar, pie, and heat maps to understand trends by age, gender, geography, and disease prevalence.
- Track surgical efficiency - To identify performance gaps, compare surgery volumes by specialty, surgeon, and OT utilization.
- Measure clinical outcomes - Analyze pre-op vs post-op visual acuity, complication rates, and readmission benchmarks.
- Review outreach programs - Evaluate screening coverage, detection rates, and referral conversions for community impact.
- Identify growth patterns - Use patient growth rates and new vs returning patient metrics to plan resources.
- Check compliance - Monitor deadlines, complication reports, and audit findings for regulatory standards.
Benefits of Eye Hospital Clinical Dashboard
Here are the benefits of the best eye hospital clinical dashboard template:
- Improved clinical visibility - Real-time monitoring of ophthalmology outcomes and patient safety.
- Operational efficiency - Tracks OT utilization, surgeon productivity, and cancellation rates.
- Better patient outcomes - Measures visual acuity improvement and complication trends.
- Data-driven decision-making - Provides actionable insights for department heads and senior consultants.
- Compliance support - Functions as an ophthalmology clinical reporting and compliance dashboard.
- Enhanced outreach performance - Monitors rural, school, and diabetic screening effectiveness.
KPIs to Track in Eye Hospital Clinical Dashboard
The key KPIs include:
- Total Patients (Monthly/Yearly) - Tracks patient volume trends for planning and resource allocation.
- Age Group Distribution - Identifies pediatric, adult, and geriatric patient proportions.
- Gender Distribution - Provides male vs. female patient share for demographic analysis.
- Geographic Patient Distribution - Maps patient origin by region to optimize outreach.
- Patient Growth Rate (%) - Tracks increase in new patients compared to previous periods.
- Total Surgeries Performed - Measures surgical workload by specialty and surgeon.
Frequently Asked Questions
1. Who should use an Eye Hospital Clinical Dashboard?
Chief Medical Officers, department heads, surgeons, and quality teams responsible for monitoring ophthalmology workflows and patient outcomes.
2. Can the dashboard help improve surgical performance?
Yes. It highlights surgeon-wise volumes, complication rates, and OT utilization, enabling better workload management and outcome tracking.
3. How does the dashboard support patient care improvement?
By analyzing visual outcomes, complication rates, and referral efficiency, it ensures continuous improvement in patient safety and treatment quality.
4. Can it track outreach effectiveness?
Yes. The dashboard measures screenings, referral-to-treatment conversion, and geographic coverage to evaluate community impact.