What is an Eye Hospital Patient Experience Dashboard?
A Eye Hospital Patient Experience Dashboard is a healthcare analytics tool that helps hospitals monitor and improve patient satisfaction, service quality, and complaint resolution. It consolidates KPIs such as patient satisfaction scores, complaint rates, protocol adherence, and surgery coverage into one platform. The Eye Hospital Patient Experience Dashboard template provides administrators with real-time insights into service performance across branches, departments, and patient groups. As a real-time patient satisfaction monitoring dashboard, it helps identify service gaps, streamline complaint handling, and improve adherence to clinical protocols.
How To Create an Eye Hospital Patient Experience Dashboard
You don’t need to build your report from scratch—just start with a ready-to-use Eye Hospital Patient Experience dashboard template sample from Mokkup. Add in your data and export it however you like. Here’s how to do it:
1. Create or Log in to Your Mokkup Account
Start by signing up on Mokkup.ai using your email. If you already have an account, just log in, and you’ll be good to go.
2. Choose and Customize Your Dashboard Template
Find the Eye Hospital Patient Experience Dashboard template in the Templates section. Use the drag-and-drop editor to adjust KPIs, edit filters, or add elements based on your data.
3. Export to Your BI Tool
Once your dashboard wireframe is ready, use the BI Tool Export feature to send it directly to Power BI or Tableau for further analysis and enhancements. You can also download the dashboard as a PDF, PNG, or JPEG, embed it on a platform, or invite your team to collaborate.
Note: This is a Pro template. You’ll need a Pro subscription on Mokkup to use and customize this dashboard wireframe. Upgrade anytime to unlock full access.
Eye Hospital Patient Experience Dashboard Example
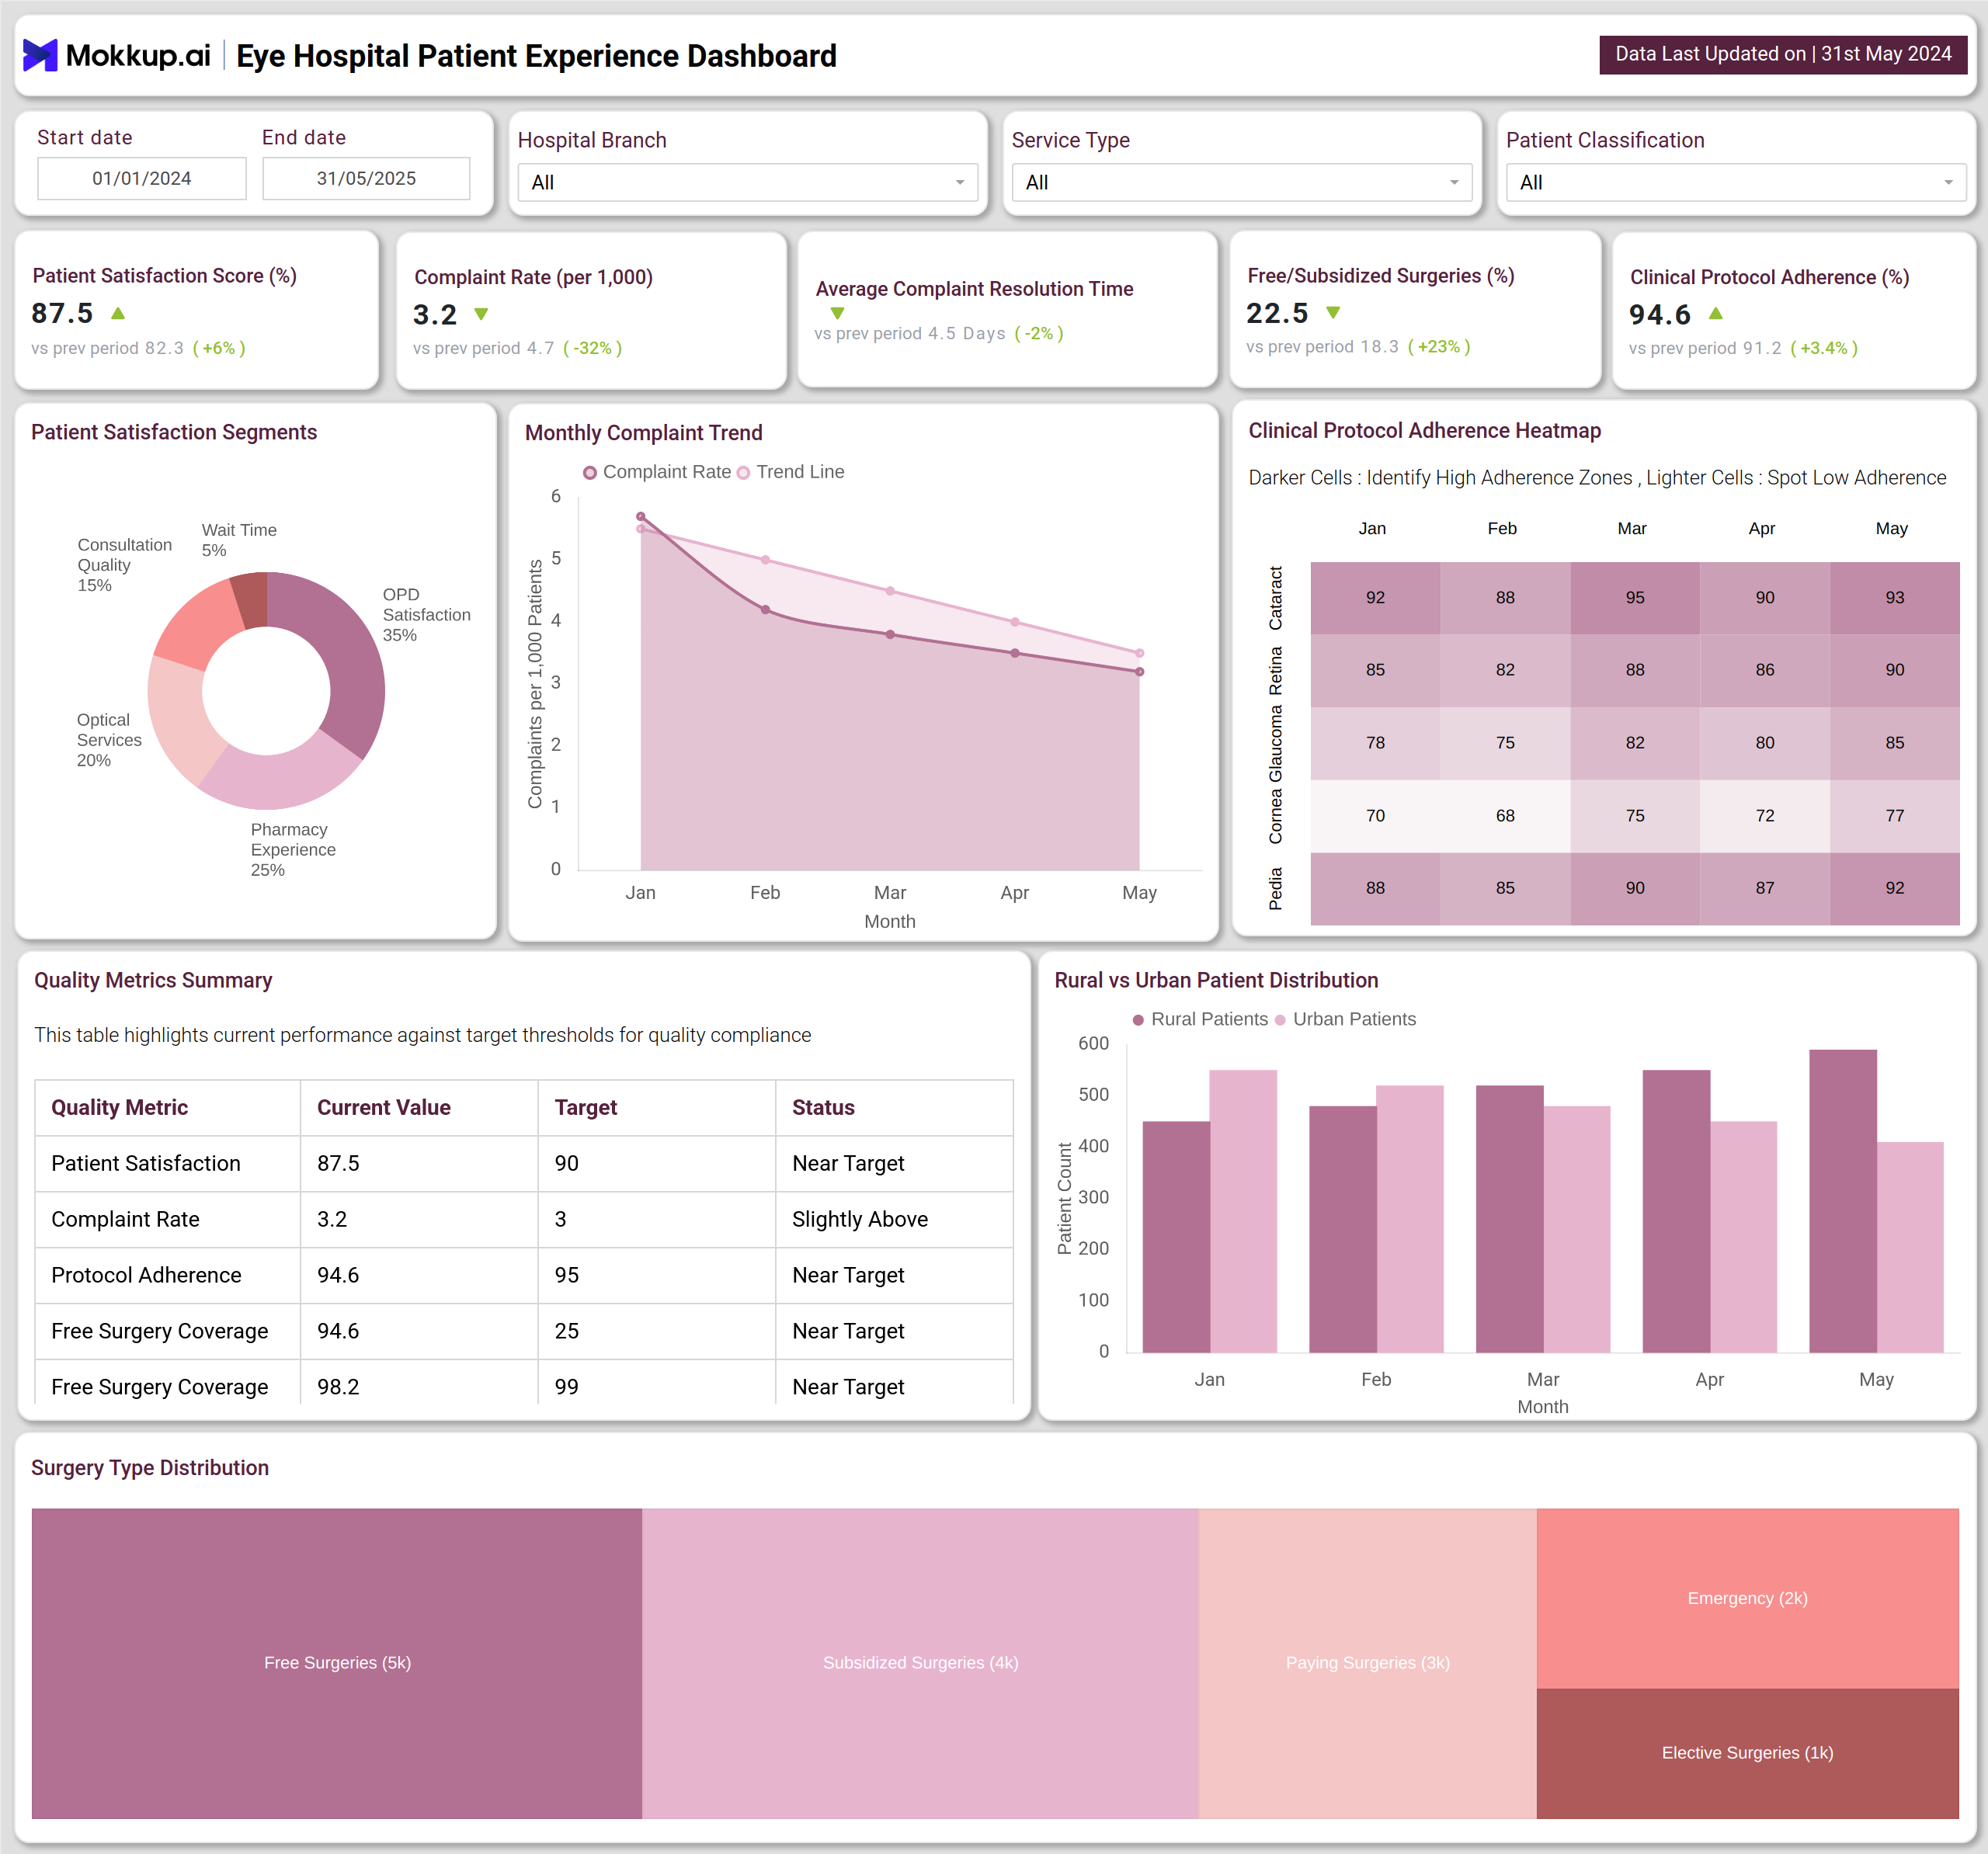
Top-level KPIs highlight patient satisfaction scores, complaint rates, complaint resolution times, subsidized surgeries, and clinical protocol adherence. These indicators ensure that hospitals can evaluate both patient outcomes and operational efficiency. The Patient Satisfaction Segments chart breaks down satisfaction by service categories like consultation quality, OPD experience, pharmacy services, and optical services. The Monthly Complaint Trend line chart tracks the reduction in patient complaints over time, while the Clinical Protocol Adherence Heatmap highlights zones where compliance is strong or requires improvement.
Other visualizations include the Quality Metrics Summary table, which compares current values against targets, and the Rural vs. Urban Patient Distribution bar chart, which offers insights into service accessibility. The Surgery Type Distribution treemap further segments surgical services into free, subsidized, emergency, elective, and paying surgeries. This patient experience performance dashboard enables hospitals to align patient satisfaction initiatives with compliance and quality goals.
How to Analyze Data in Eye Hospital Patient Experience Dashboards
Healthcare workers can use an Eye Hospital Patient Experience Dashboard template effectively by:
- Tracking Satisfaction Trends – Use the real-time patient satisfaction monitoring dashboard to evaluate service quality improvements.
- Monitoring Complaint Handling – Review complaint rates and resolution times to ensure faster patient service recovery.
- Measuring Protocol Adherence – Treat the dashboard as an incident tracking and compliance dashboard to maintain clinical standards.
- Reviewing Service Segments – Analyze which services contribute most to patient satisfaction or dissatisfaction.
- Evaluating Access and Coverage – Monitor rural vs urban patient distribution and surgery types to improve healthcare equity.
Benefits of Eye Hospital Patient Experience Dashboards
Implementing an Eye Hospital Patient Experience Dashboard delivers multiple advantages:
- Improved Patient Satisfaction: The Eye Hospital Patient Experience Dashboard template tracks service ratings to boost overall satisfaction.
- Faster Complaint Resolution: The real-time patient satisfaction monitoring dashboard ensures timely follow-up on patient concerns.
- Higher Compliance: An incident tracking and compliance dashboard strengthens adherence to medical protocols.
- Better Service Planning: Service segment data identifies priority areas for resource allocation.
- Equitable Care Delivery: Rural vs urban distribution helps improve outreach and healthcare accessibility.
KPIs to Track in Eye Hospital Patient Experience Dashboards
The following hospital metrics can be tracked from this dashboard:
- Patient Satisfaction Score (%) – Reflects patient perceptions of care quality across services.
- Complaint Rate (per 1,000) – Measures frequency of complaints, highlighting service improvement needs.
- Average Complaint Resolution Time (days) – Tracks resolving patient concerns efficiently.
- Clinical Protocol Adherence (%) – Monitors compliance with treatment guidelines and standards.
- Free/Subsidized Surgery Coverage (%) – Evaluates accessibility and affordability of surgical services.
Frequently Asked Questions
1. Why is an Eye Hospital Patient Experience Dashboard important?
It helps hospitals track satisfaction, complaints, and compliance metrics, ensuring better quality care and service delivery.
2. Which hospitals benefit most from this dashboard?
Large hospitals, multi-branch networks, and government-funded facilities benefit most from a patient experience performance dashboard.
3. Can this dashboard be customized for specific hospital needs?
Yes, it can be tailored to track metrics most relevant to your hospital, such as post-surgery feedback, outpatient satisfaction, or emergency care experience.