
What is an Industrial & Irrigation Reuse Standards Dashboard?
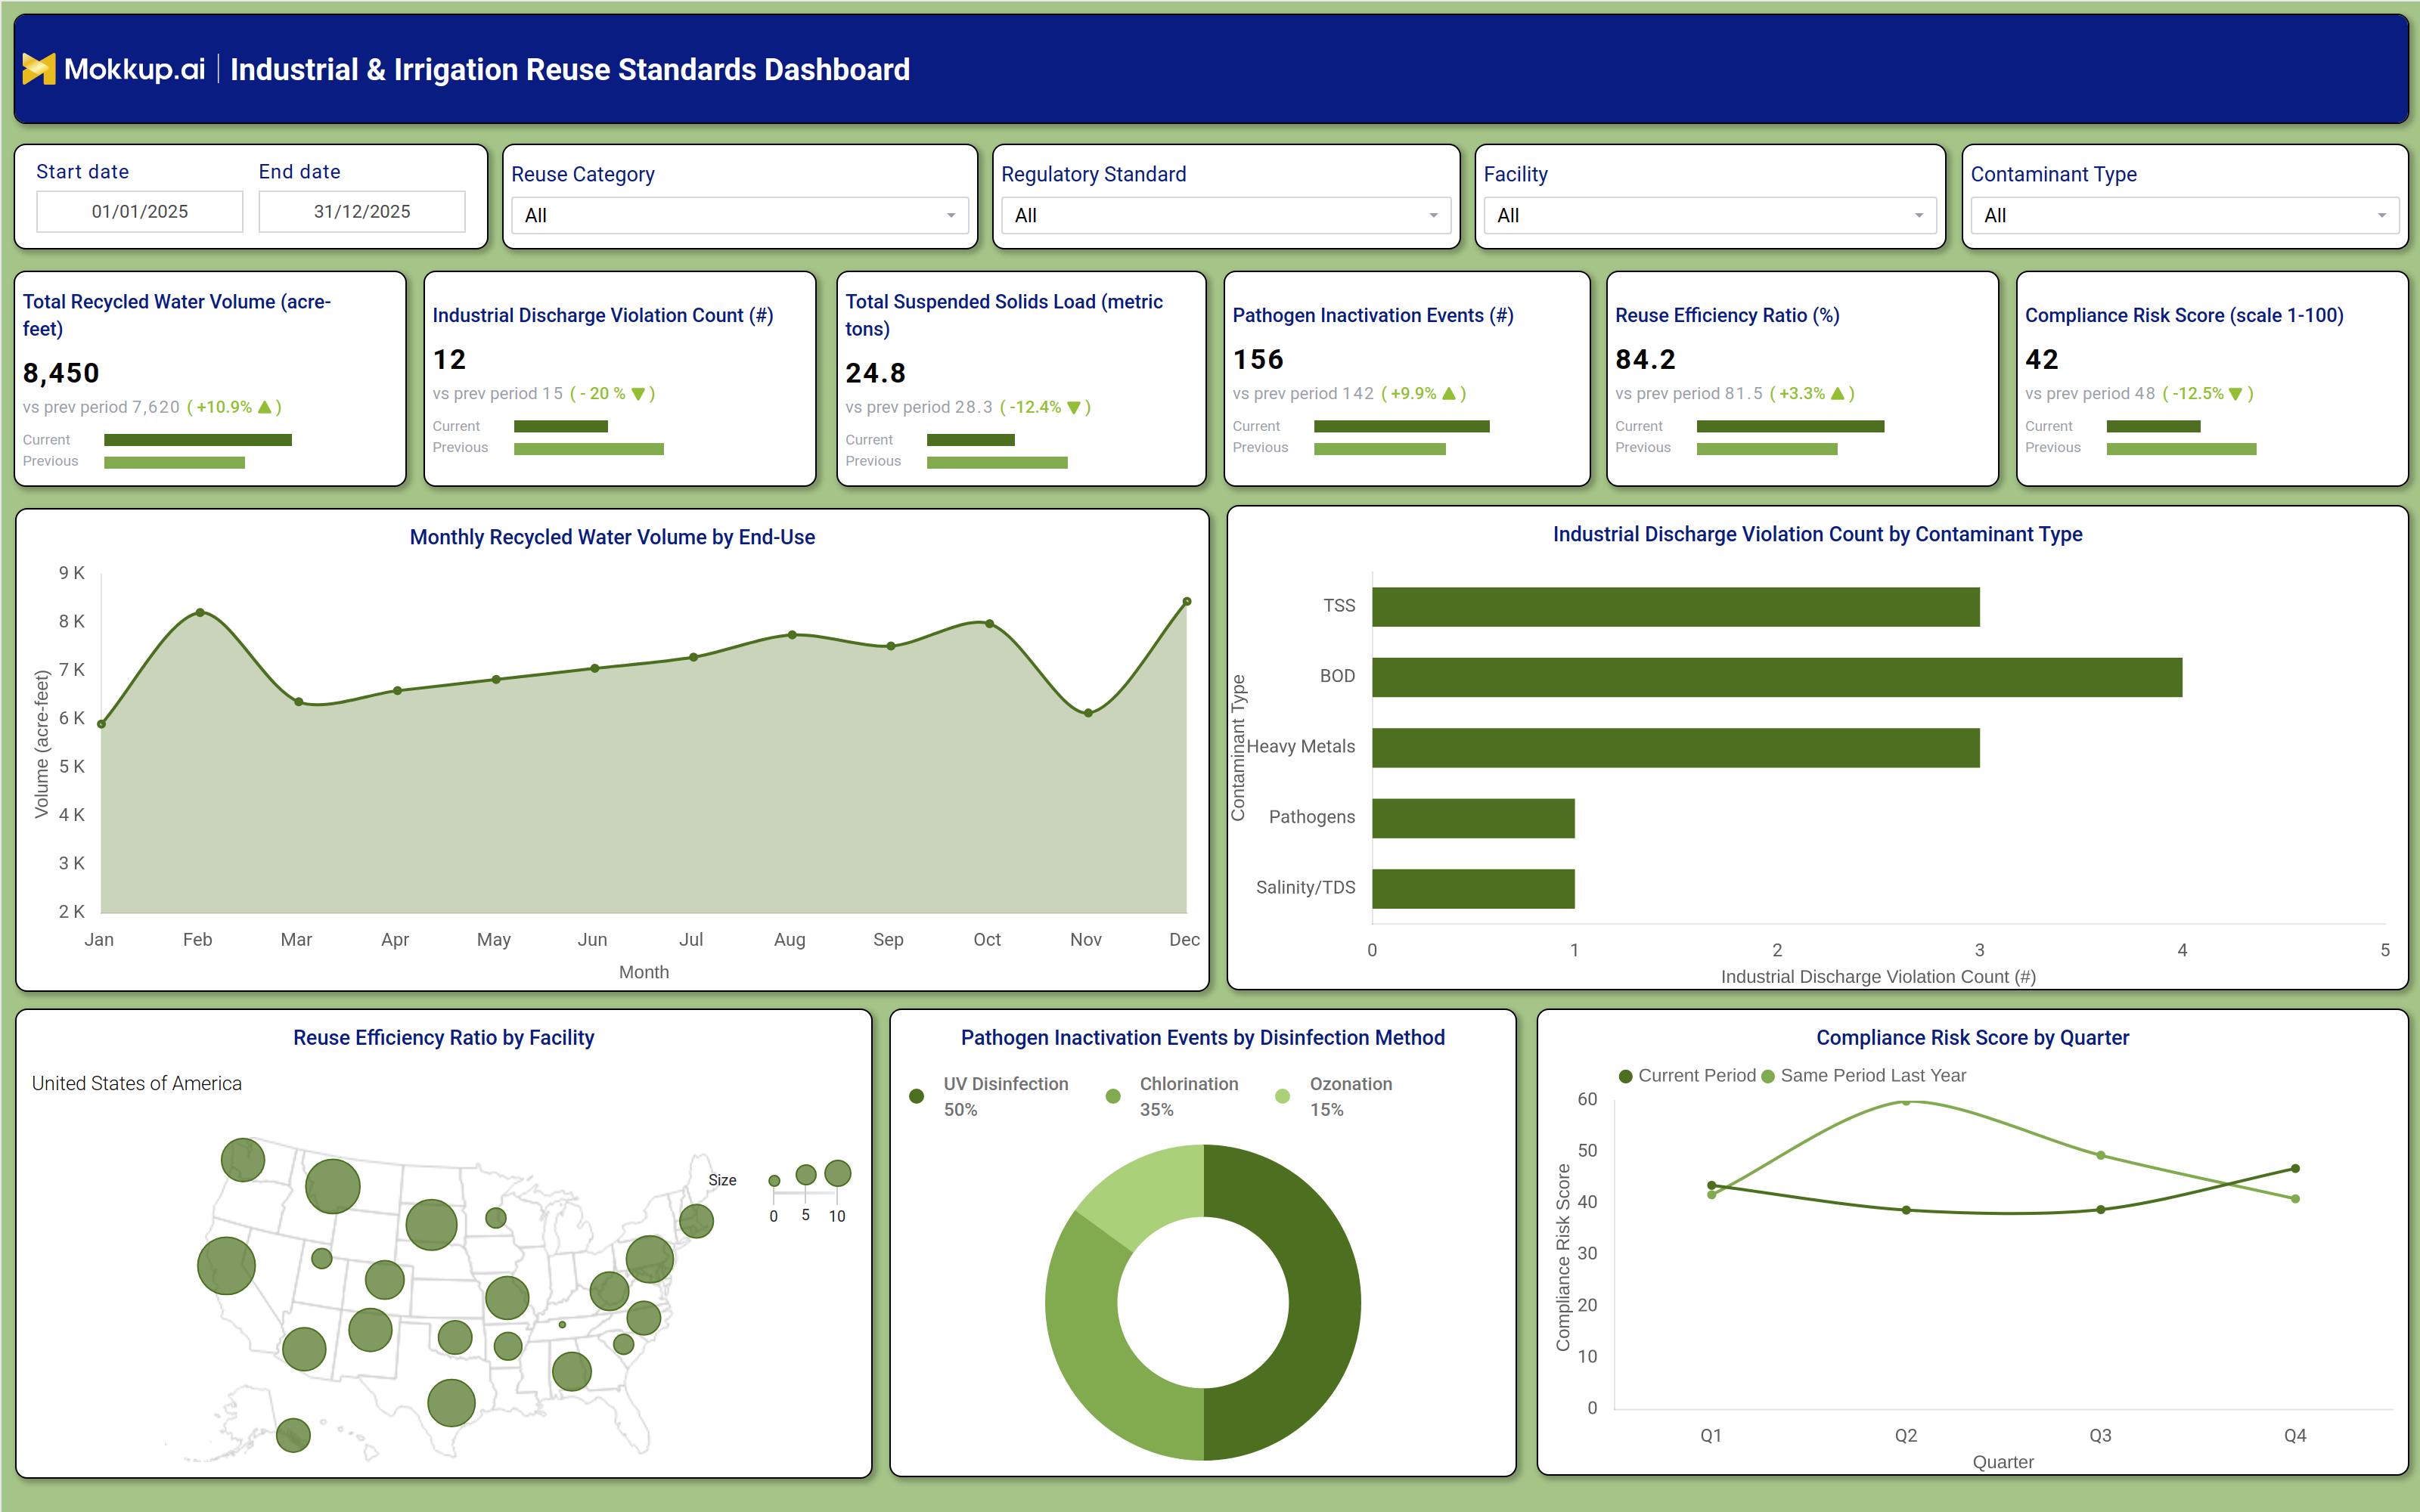
The Industrial & Irrigation Reuse Standards Dashboard functions as an industrial wastewater reuse compliance dashboard built for utility operations, environmental compliance, and treatment plant teams who oversee how recycled water is produced, treated, and redirected into industrial and irrigation use. It consolidates recycled water volume, discharge violations, contaminant loads, and disinfection performance into a single view, giving teams a consistent way to track how reuse programs perform against regulatory standards.
Rather than piecing together compliance reports from multiple systems, this irrigation reuse standards monitoring dashboard brings facility-level and contaminant-level detail together so environmental health and safety leads can see where standards are being met and where risk is building. Filters for reuse category, regulatory standard, facility, and contaminant type let users narrow the view to the specific segment they are responsible for, whether that is a single treatment facility or a state-wide reuse program.
How to Create a Wastewater Recycling Industrial & Irrigation Reuse Standards Dashboard
You don't need to build your dashboard from scratch; just start with a ready-to-use Dashboard template from Mokkup. Customize it with your data and export it with ease. Here's how:
1. Create or Log in to Your Mokkup Account
Start by signing up on Mokkup.ai using your email. If you already have an account, just log in, and you'll be good to go.
2. Choose and Customize Your Dashboard Template
Find the Industrial & Irrigation Reuse Standards Dashboard template in the Templates section. Use the drag-and-drop editor to adjust KPIs, edit filters, or add elements based on your data.
3. Export to Your BI Tool
Once your dashboard wireframe is ready, use the BI Tool Export feature to send it directly to Power BI or Tableau for further analysis and enhancements. You can also download the dashboard as a PDF, PNG, or JPEG, embed it on a platform, or invite your team to collaborate.
Note: This is a Pro template. You'll need a Pro subscription on Mokkup to use and customize this dashboard wireframe. Upgrade anytime to unlock full access.
Industrial & Irrigation Reuse Standards Dashboard Example
A compliance manager at a water reclamation utility opens this industrial wastewater reuse compliance dashboard at the start of a reporting cycle to understand whether the recycled water program is holding steady against industrial and irrigation reuse standards. Working from the date range and facility filters, they narrow the view to the reporting period and the specific plant or region under review, then check whether output is keeping pace with demand and whether violation counts are trending in the right direction. The goal is to catch emerging risk before it becomes an enforcement issue. From there, the compliance team can identify which contaminant categories are driving the most discharge violations and prioritize corrective action at the source rather than treating every violation the same way.
Using this recycled water volume tracking dashboard across the course of the year helps planners recognize seasonal patterns in end-use demand and anticipate when treatment capacity needs to flex. Mapping reuse efficiency across facilities lets regional managers compare performance and direct support toward sites falling behind their peers, while tracking how disinfection methods contribute to pathogen inactivation performance helps operations teams decide where to invest in upgraded treatment technology. Watching the compliance risk score move quarter over quarter gives leadership an early warning system, so they can intervene with a facility before risk climbs into a range that draws regulatory attention. The overall outcome is a single accountability tool that turns scattered facility and lab data into clear, standards-based decisions. Teams walk away from each review knowing exactly which facilities, contaminants, or reuse categories need attention, and they can defend those decisions with the same standards-based view that regulators expect to see.
How to Analyze Data in an Industrial & Irrigation Reuse Standards Dashboard
Here is how you can analyze data from this dashboard:
- Filter by regulatory standard and facility to isolate performance for the specific reuse program under review.
- Use this recycled water volume tracking dashboard to confirm that reuse capacity is meeting demand period over period.
- Apply the industrial discharge violation tracking tool to compare violations by contaminant type and target root-cause action.
- Review the monthly recycled water volume trend to plan for seasonal shifts in irrigation and industrial demand.
- Use the facility map to compare reuse efficiency ratio across locations and flag underperforming sites.
- Monitor the disinfection method mix to understand what is driving pathogen inactivation performance.
- Watch the compliance risk score trend by quarter to catch rising risk before it triggers regulatory action.
Benefits of an Industrial & Irrigation Reuse Standards Dashboard
The following are the benefits of using this dashboard:
- Centralizes recycled water volume, violation, and risk data into one industrial wastewater reuse compliance view.
- Reduces manual reporting effort by pulling facility, contaminant, and disinfection data into one view.
- Gives compliance teams an industrial discharge violation tracking tool to prioritize corrective action by contaminant type.
- Standardizes compliance risk score wastewater recycling reporting so escalation decisions are faster and easier to defend.
- Improves visibility into seasonal irrigation and industrial demand patterns for capacity planning.
- Gives regional leaders a consistent way to benchmark facility performance against reuse standards.
KPIs to Track in an Industrial & Irrigation Reuse Standards Dashboard
The following key KPIs can be tracked by using this dashboard:
- Total Recycled Water Volume (acre-feet): measures the total volume of water recycled for industrial and irrigation reuse over the selected period.
- Industrial Discharge Violation Count (#): tracks the number of discharge events that fall outside regulatory standards, a factor that feeds directly into the compliance risk score wastewater recycling teams use to flag facilities needing attention.
- Total Suspended Solids Load (metric tons): quantifies the solids load remaining in treated water, reflecting treatment process performance.
- Pathogen Inactivation Events (#): counts disinfection events that successfully inactivate pathogens, a core measure tracked in this pathogen inactivation monitoring dashboard template.
- Reuse Efficiency Ratio (%): measures how efficiently treated water is converted into usable reuse volume across facilities.
- Compliance Risk Score (scale 1-100): a composite score that flags facilities needing intervention before risk escalates further.
Frequently Asked Questions
1. What does the Wastewater Recycling Industrial & Irrigation Reuse Standards Dashboard track?
It tracks recycled water volume, discharge violations, contaminant loads, disinfection performance, and a composite compliance risk score across facilities. These metrics work together as an irrigation reuse standards monitoring dashboard so teams can see program performance without switching between separate reports.
2. Who uses this dashboard?
Compliance managers, treatment plant operators, and environmental health and safety teams use it to review facility performance against regulatory standards. Regional leaders also use it to compare reuse efficiency and risk across multiple facilities.
3. Can I customize this dashboard for my own reuse program?
Yes. The Mokkup template can be customized as a pathogen inactivation monitoring dashboard template or adapted to your own facility structure, contaminant types, and regulatory standards, then exported to your BI tool of choice.