What is an Electric Power Transmission Environmental Compliance Dashboard?
An Electric Power Transmission Environmental Compliance Dashboard is a centralized analytics platform designed to monitor, manage, and report environmental and ESG performance across transmission operations. It consolidates regulatory compliance metrics, emissions data, sustainability initiatives, and audit findings into a single view. This dashboard enables utilities to track electric transmission environmental compliance across regions, assets, and regulatory frameworks while ensuring adherence to environmental laws and ESG mandates. By combining regulatory compliance trends with sustainability performance indicators, the dashboard supports environmental monitoring of the electric grid. It helps organizations proactively manage risks related to emissions, biodiversity, land use, and community impact. It plays a critical role in power transmission ESG reporting by offering accurate, auditable, and real-time visibility into environmental performance.
How to Create an Electric Power Transmission Environmental Compliance Dashboard
You don’t need to build your report from scratch, just start with a ready-to-use dashboard template from Mokkup. Add in your data and export it however you like. Here’s how to do it:
1. Create or Log in to Your Mokkup Account
Start by signing up on Mokkup.ai using your email. If you already have an account, just log in, and you’ll be good to go.
2. Choose and Customize Your Dashboard Template
Find the Electric Power Transmission Environmental Compliance Dashboard template in the Templates section. Use the drag-and-drop editor to adjust KPIs, edit filters, or add elements based on your data.
3. Export to Your BI Tool
Once your dashboard wireframe is ready, use the BI Tool Export feature to send it directly to Power BI or Tableau for further analysis and enhancements. You can also download the dashboard as a PDF, PNG, or JPEG, embed it on a platform, or invite your team to collaborate.
Note: This is a Pro template. You’ll need a Pro subscription on Mokkup to use and customize this dashboard wireframe. Upgrade anytime to unlock full access.
Electric Power Transmission Environmental Compliance Dashboard Example
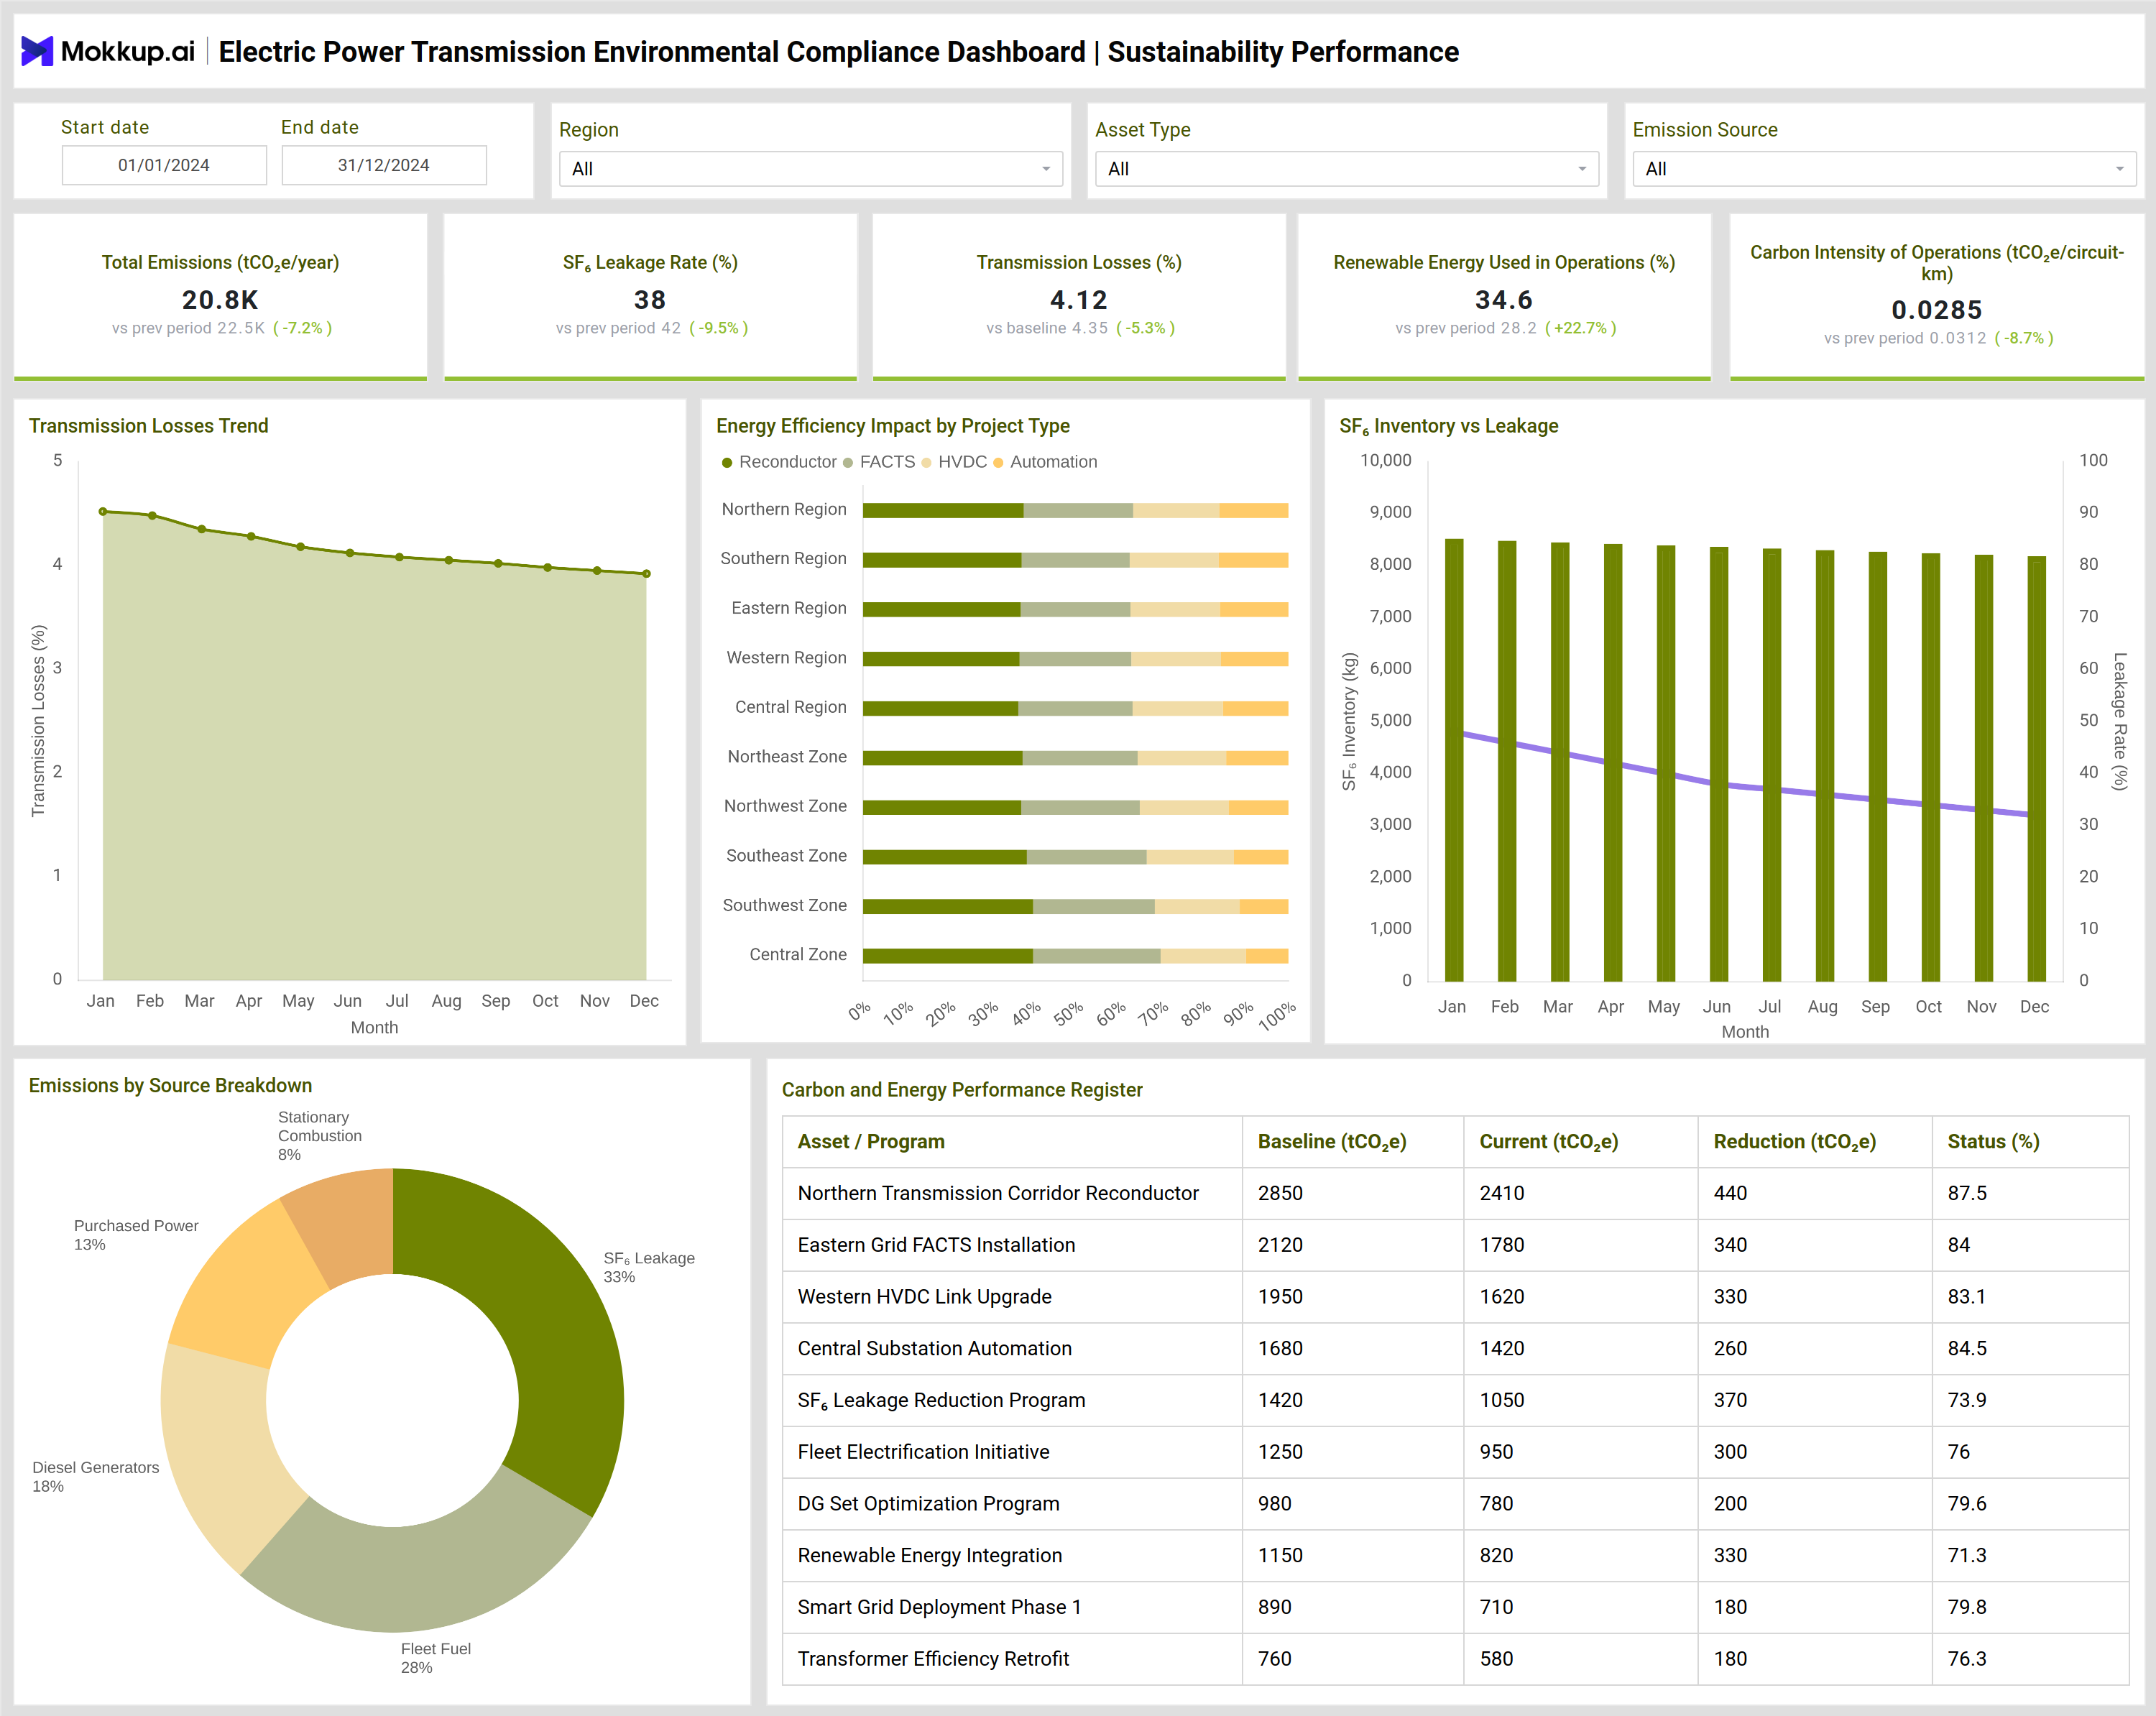
You can build your own Electric Power Transmission Environmental Compliance Dashboard to unify regulatory compliance and sustainability performance data into a single operational view. A typical dashboard displays environmental compliance rates, ESG filing timeliness, non-compliance notices, and transmission route readiness at the top level to provide an immediate compliance health snapshot. Detailed trend visualizations show how compliance rates improve over time and how ESG audit findings evolve month by month. Biodiversity mitigation project tracking highlights project status across planning, approval, and implementation stages. Non-compliance notices are monitored through funnel views, helping compliance teams understand resolution progress and bottlenecks.
On the sustainability side, the dashboard tracks total emissions, SF₆ leakage rates, transmission losses, renewable energy usage, and carbon intensity of operations. Emissions are broken down by source, while asset-level registers link sustainability initiatives to measurable emissions reductions. Together, these insights support transmission environmental compliance tracking and enable structured, data-driven ESG decision-making
How to Analyze Electric Power Transmission Environmental Compliance Dashboard
Here is how you can analyze data from this dashboard:
- Compliance Trend Analysis: Review environmental compliance rate trends to identify recurring regulatory risks.
- Non-Compliance Monitoring: Track non-compliance notices by severity, region, and resolution status.
- ESG Audit Prioritization: Analyze ESG audit findings to focus remediation efforts on high-risk gaps.
- Biodiversity Project Tracking: Monitor biodiversity mitigation projects across approval, funding, and execution stages.
- Operational Loss & Leakage Comparison: Compare transmission losses and SF₆ leakage trends across regions.
- Emissions Source Analysis: Evaluate emissions by source to identify high-impact reduction opportunities.
- Renewable Usage Assessment: Assess renewable energy usage in operations to measure progress against ESG targets.
- Asset-to-Outcome Mapping: Link asset-level project registers with measurable emissions reduction outcomes.
Benefits of Electric Power Transmission Environmental Compliance Dashboard
The following are the benefits of using this dashboard:
- Regional Compliance Visibility: Improves visibility into environmental compliance across electric transmission regions.
- Audit-Ready ESG Reporting: Strengthens transmission of ESG data accuracy and readiness for regulatory audits.
- Proactive Risk Identification: Enables early detection of regulatory, environmental, and compliance risks.
- Penalty Reduction & Issue Tracking: Reduces compliance penalties through timely detection and resolution tracking.
- Data-Driven Sustainability Decisions: Supports informed investment decisions aligned with sustainability priorities.
- Regulatory & Stakeholder Transparency: Enhances transparency for regulators, stakeholders, and ESG disclosures.
- Environmental Goal Alignment: Aligns operational performance with environmental and climate commitments.
- Unified Regulatory Reporting: Simplifies reporting across multiple environmental laws, standards, and frameworks.
KPIs to Track in Electric Power Transmission Environmental Compliance Dashboard
The following key KPIs can be tracked by using this dashboard:
- Environmental Compliance Rate – Percentage of operations meeting mandated environmental regulations.
- ESG Filings On-Time – Share of ESG and regulatory disclosures submitted within required timelines.
- Non-Compliance Notices – Number of regulatory violations or environmental notices received.
- Transmission Route Readiness – Proportion of transmission routes with completed environmental clearances.
- Total Emissions – Annual greenhouse gas emissions from all operations.
- SF₆ Leakage Rate – Percentage of SF₆ gas lost from equipment during operations.
- Transmission Losses – Portion of energy lost during power transmission across the grid.
- Renewable Energy Usage – Share of total energy consumption sourced from renewables.
- Carbon Intensity – Emissions generated per unit length of transmission infrastructure.
- Biodiversity Mitigation Projects – Number of initiatives undertaken to offset ecological impact.
Frequently Asked Questions
1. Why is an environmental compliance dashboard important for transmission utilities?
Transmission utilities operate under strict environmental regulations. A centralized dashboard ensures continuous monitoring, reduces compliance risk, and supports ESG transparency.
2. How does this dashboard support ESG reporting?
It integrates emissions data, sustainability initiatives, and audit findings to provide structured inputs for ESG disclosures and regulatory filings.
3. Can this dashboard help reduce environmental penalties?
Yes. Early identification of non-compliance and tracking remediation progress helps utilities resolve issues before penalties escalate.
4. Does the dashboard support regional compliance analysis?
Yes. Filters allow analysis by region, regulation type, asset type, and severity level for targeted compliance management.
5. How does it improve sustainability performance?
By linking emissions data to specific projects and assets, the dashboard enables measurable emissions reduction and efficiency improvements.