What is a Pediatrics Disease Management Dashboard?
A Pediatrics Disease Management Dashboard is a centralized, data-driven tool designed for pediatric hospital administrators, clinical directors, and healthcare providers to monitor and improve child health outcomes. It offers a real-time view of key performance indicators such as average length of stay, readmission rates, mortality, chronic disease prevalence, vaccination compliance, and patient satisfaction. Unlike traditional reporting methods, this dashboard serves as a real-time pediatrics disease management platform, enabling healthcare teams to track disease trends, allocate resources efficiently, and enhance clinical decision-making—all from a single interface.
How to Create a Pediatrics Disease Management Dashboard
You don’t need to start from scratch. With Mokkup, you can quickly build a professional pediatrics disease dashboard using a pre-designed template. Here’s how:
1. Create or Log in to Your Mokkup Account
Sign up at Mokkup.ai using your email address. Existing users can log in directly.
2. Choose and Customize Your Dashboard Template
Navigate to the Templates section and select the Pediatrics Disease Management Dashboard. Use the intuitive drag-and-drop editor to modify KPIs, adjust filters, or add new visualizations based on your hospital’s data.
3. Export to Your BI Tool
Once your dashboard wireframe is ready, export it seamlessly to Power BI or Tableau using the BI Tool Export feature. You can also download it as a PDF, PNG, or JPEG, embed it on your intranet, or invite team members to collaborate.
Note: This is a Pro template. A Mokkup Pro subscription is required to customize and use this dashboard. Upgrade anytime to unlock full access.
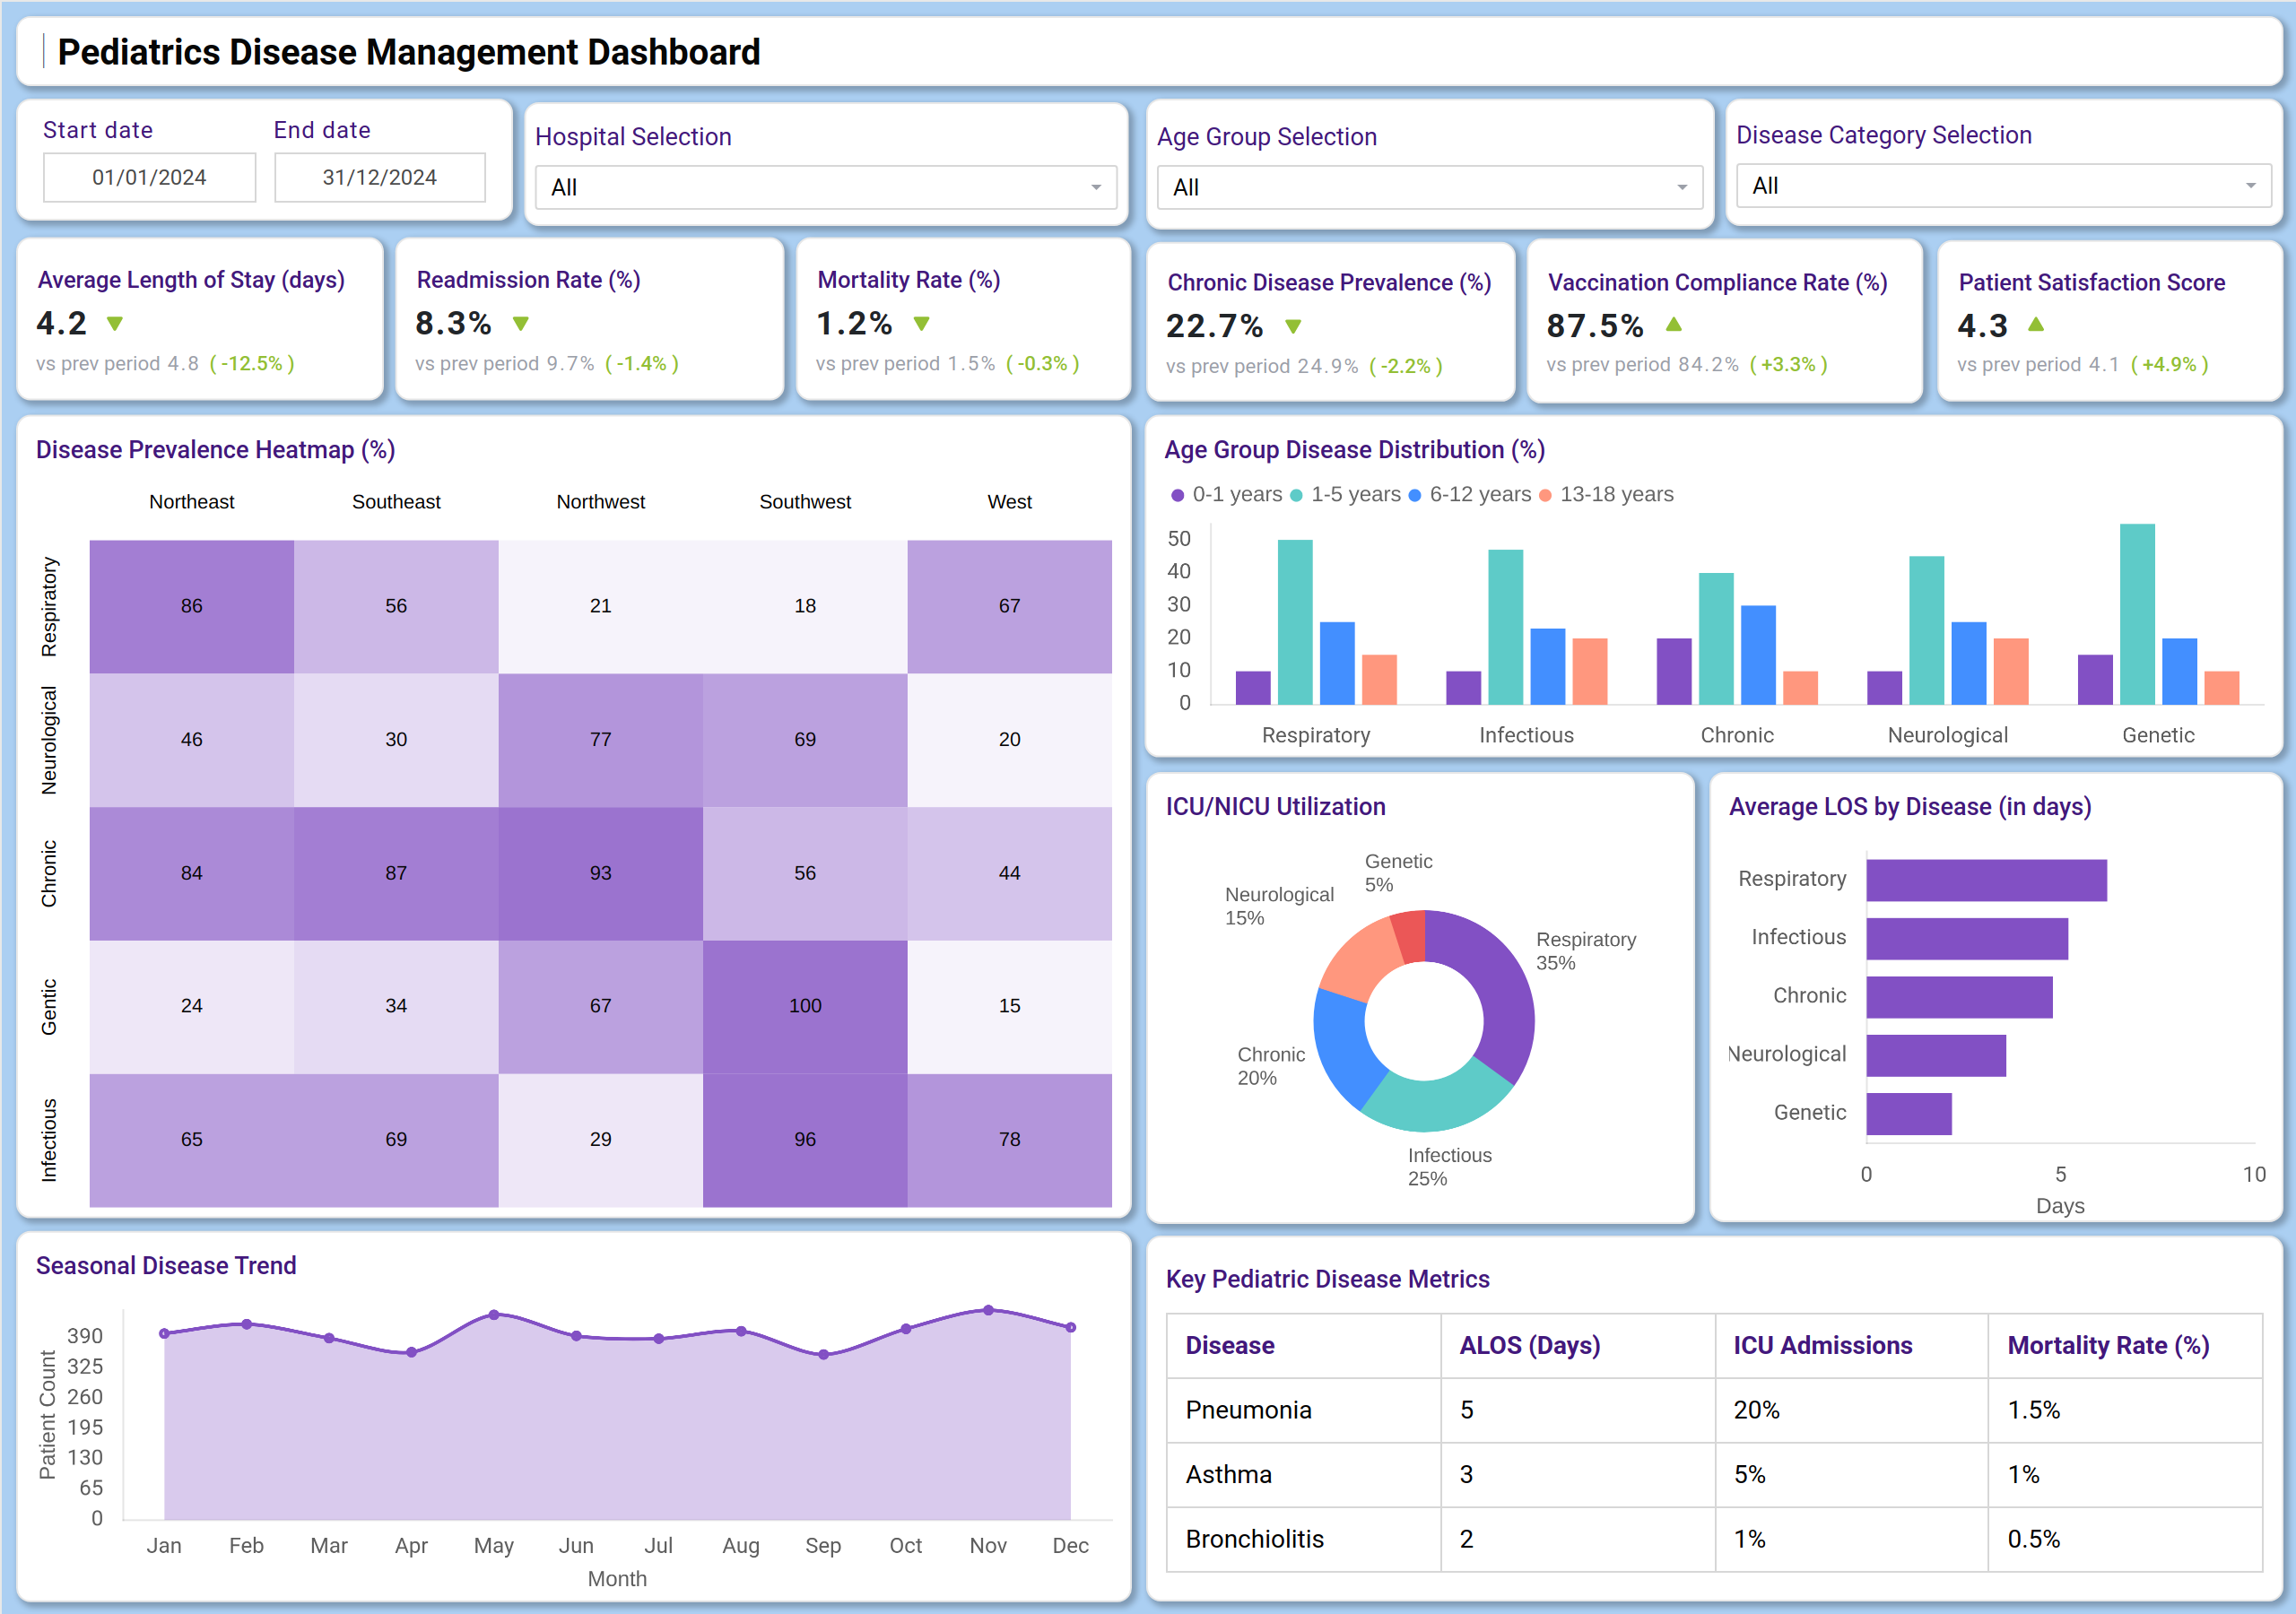
Pediatrics Disease Management Dashboard Example
A well-designed Pediatrics Disease Management Dashboard combines KPI cards and interactive charts to deliver actionable insights. At the top, metric tiles display critical stats like Average Length of Stay (4.2 days), Readmission Rate (8.3%), Mortality Rate (1.2%), and Vaccination Compliance (87.5%). Below, visualizations such as a disease prevalence heatmap, mortality by disease category, ICU utilization, and seasonal trend lines help identify patterns and areas for intervention. This layout makes it an effective child health analytics platform for tracking disease outbreaks, resource use, and treatment outcomes across age groups and regions.
How to Analyze Data in Pediatric Disease Management Dashboards
Maximize the value of your pediatrics disease management dashboard with these analytical approaches:
- Monitor clinical outcomes: Track ALOS, readmission, and mortality rates against previous periods.
- Identify regional hotspots: Use the disease prevalence heatmap to see which conditions are most common in each region.
- Evaluate ICU/NICU usage: Understand which disease categories require the most critical care resources.
- Track vaccination and chronic disease rates: Measure preventive care effectiveness and long-term health trends.
- Analyze seasonal trends: Anticipate peaks in infectious diseases using monthly patient count data.
- Compare age group distributions: See how diseases affect different pediatric age cohorts.
Benefits of Pediatrics Disease Management Dashboards
These are the benefits of using this dashboard for child wellness:
- Improved clinical oversight: Real-time tracking of key pediatric health metrics supports proactive care.
- Enhanced resource allocation: Data on ICU utilization and ALOS help optimize staff and bed planning.
- Better preventive care management: Vaccination and chronic disease trends support public health planning.
- Increased patient satisfaction: Monitoring satisfaction scores helps improve family and patient experiences.
- Data-driven reporting: Acts as a pediatric health reporting and compliance dashboard for audits and accreditation.
- Outbreak preparedness: Seasonal and regional data help hospitals prepare for disease surges.
By integrating clinical, operational, and satisfaction data, this dashboard serves as the optimal tool for pediatric disease management, enabling healthcare leaders to align care delivery with patient outcomes.
KPIs to Track in Pediatrics Disease Management Dashboards
- Average Length of Stay (ALOS): Measures the average number of days patients spend admitted in a hospital or healthcare facility.
- Readmission Rate (%): Evaluates how often patients are readmitted to a hospital within a specific time period after being discharged.
- Chronic Disease Prevalence (%): The proportion of a population diagnosed with one or more chronic conditions during a specified period.
- Vaccination Compliance Rate (%): The percentage of individuals who have received required or recommended vaccines within a specific population or time period.
- Patient Satisfaction Score: Measures how satisfied patients are with their overall healthcare experience
- ICU/NICU Utilization by Disease Category: Determines how hospital intensive care resources (ICU or NICU beds) are being used across different disease types or medical conditions.
- Age Group Disease Distribution (%): The proportion of patients affected by different diseases across various age groups.
Frequently Asked Questions
1. Who should use a Pediatrics Disease Management Dashboard?
Pediatric hospital administrators, chief medical officers, department heads, and public health officials are responsible for child health outcomes and operational efficiency.
2. Can this dashboard help reduce readmission rates?
Yes. By tracking readmission rates in real-time and linking them to disease categories and treatments, hospitals can implement targeted interventions to reduce avoidable readmissions.
3. Is this a helpful dashboard for compliance and reporting?
Absolutely. As a pediatrics health reporting and compliance dashboard, it helps maintain standards, supports audits, and ensures adherence to healthcare regulations.