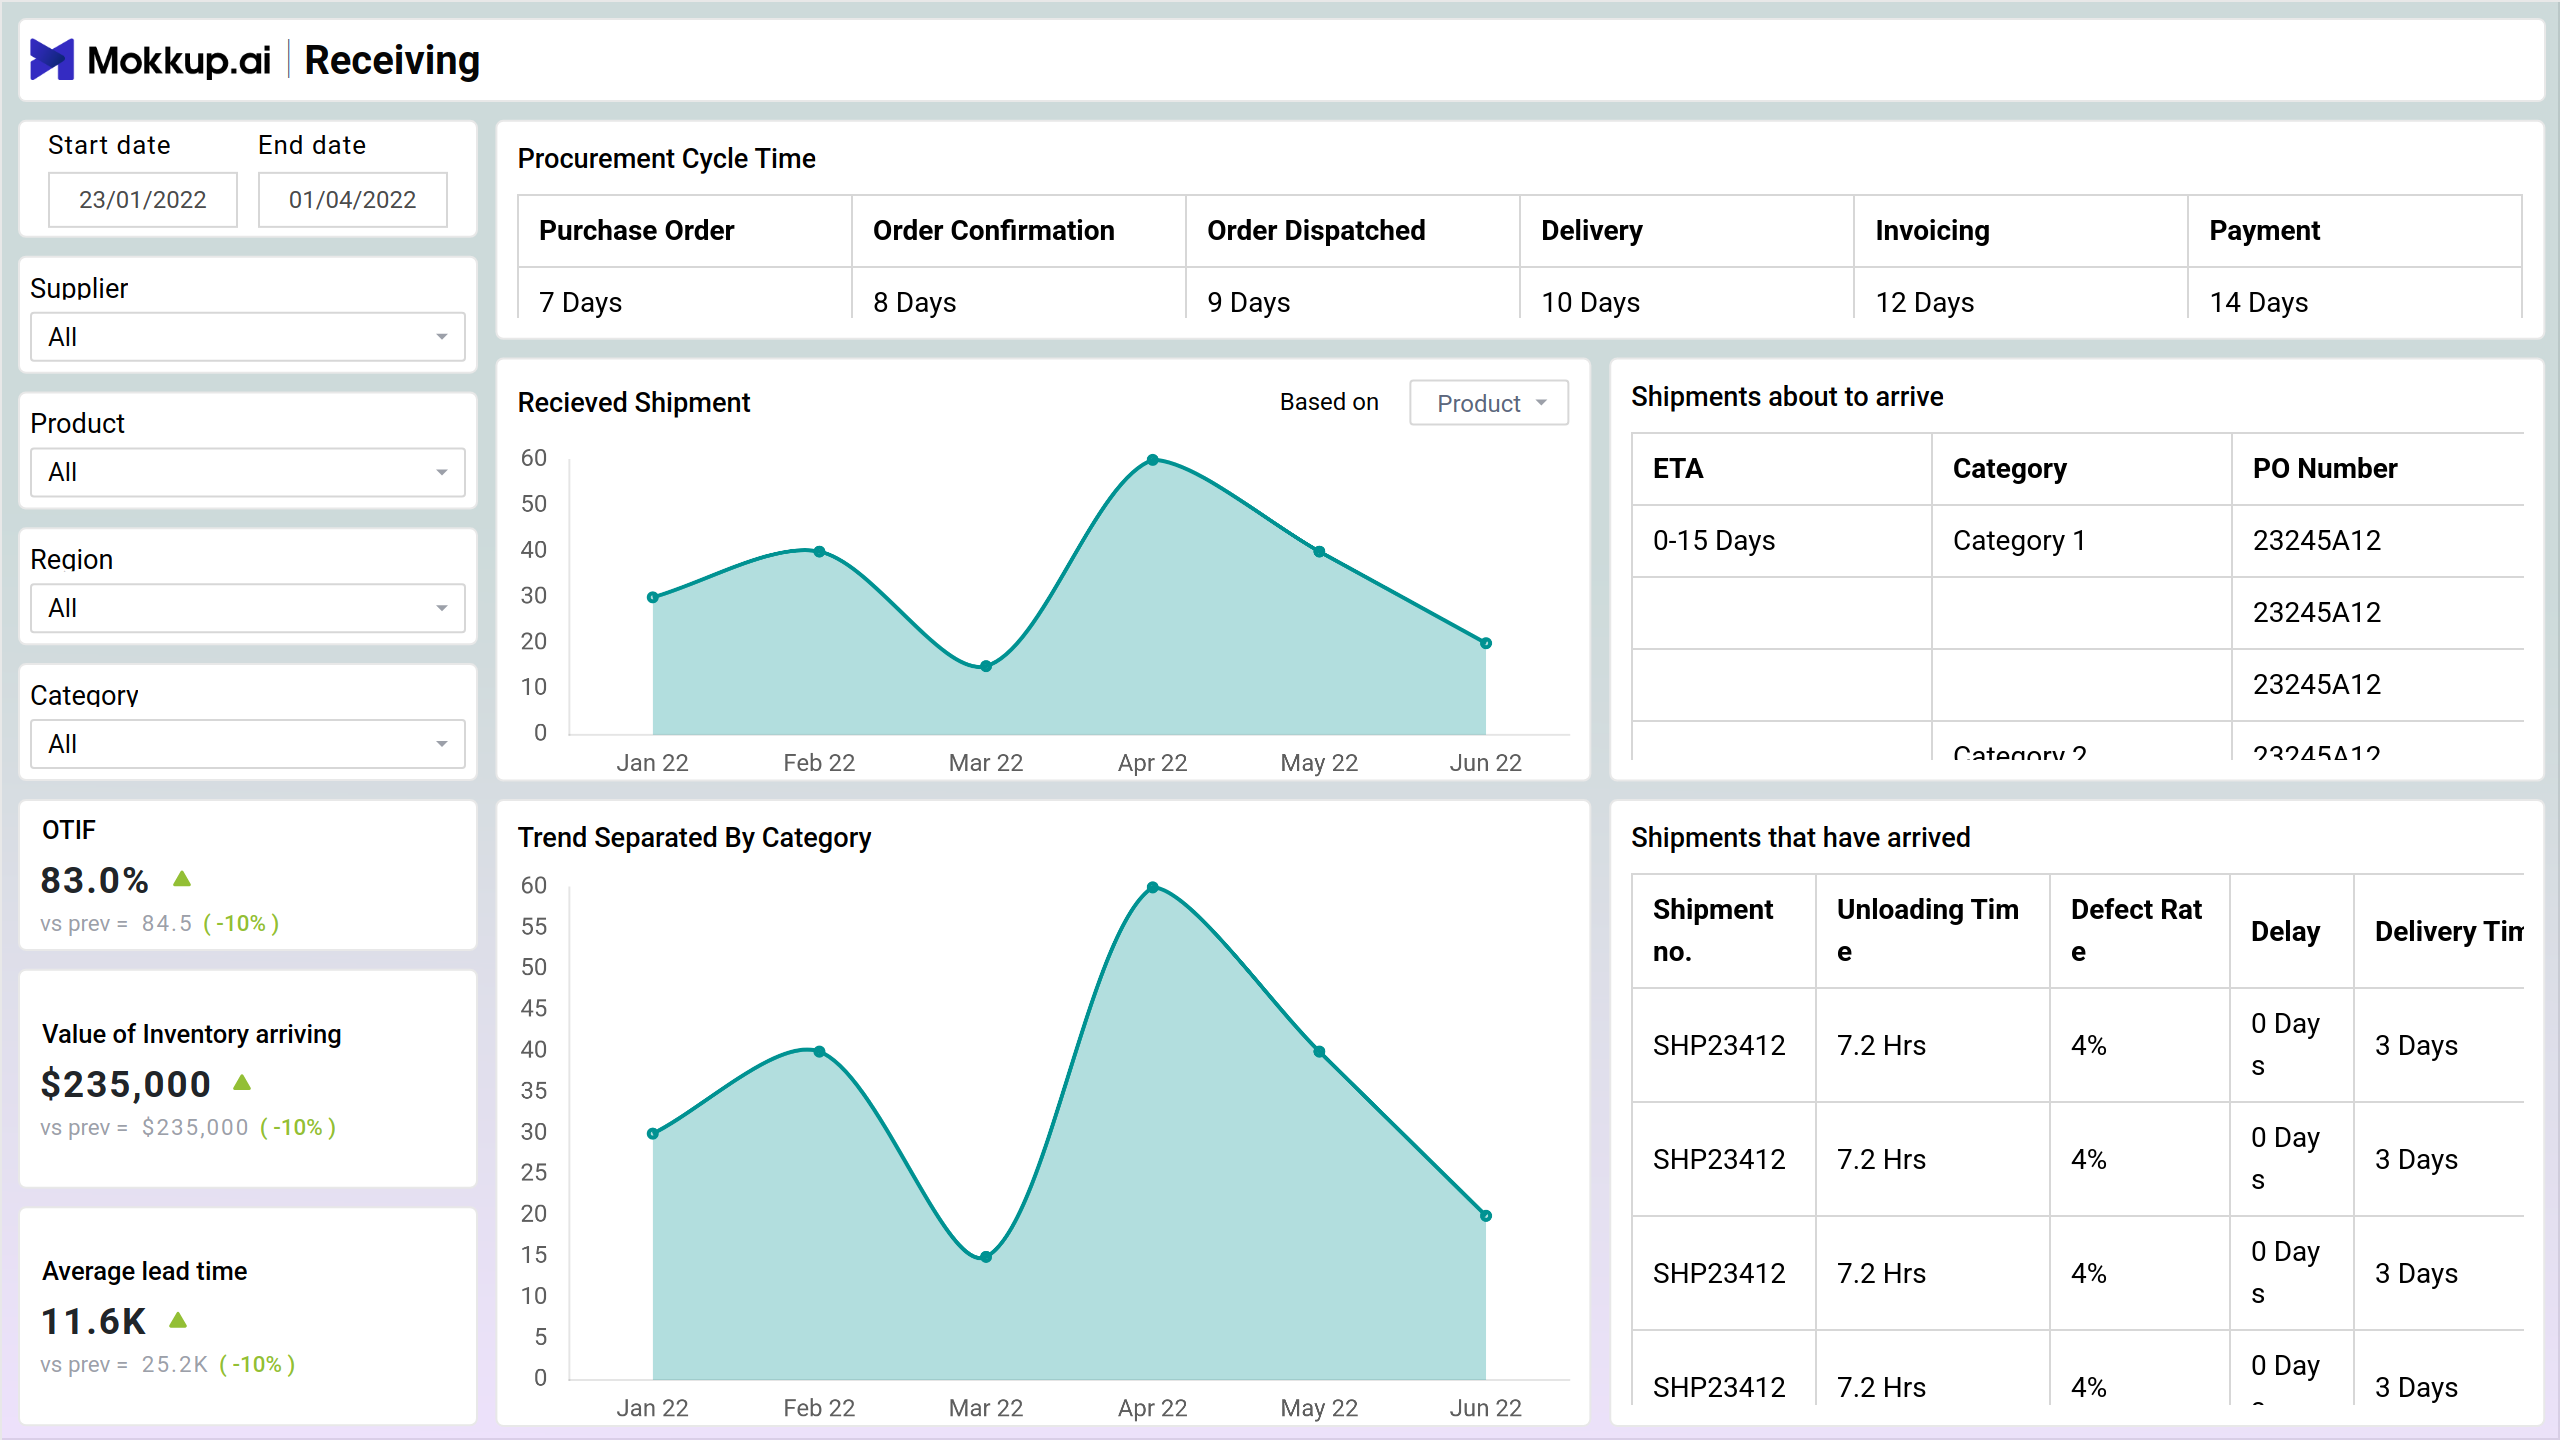
A Procurement Received Orders dashboard template gives a detailed analysis of the shipments that are to arrive from the suppliers. It would give the performance of various suppliers, information on various procurement procedures, and details about the delays in shipments.
The dashboard wireframe provides key metrics essential for assessing procurement performance. These metrics provide valuable insights into procurement efficiency and supply chain performance, helping in informed decision-making processes.
Key Terms to Know:
- Procurement Cycle Time: Measures the time taken to complete the procurement process from initiation to delivery, enabling evaluation of efficiency and effectiveness in procurement operations and supply chain management.
- OTIF% (On-Time, In-Full): Indicates the percentage of orders that are delivered on time and in full, reflecting the effectiveness of procurement and logistics operations in meeting delivery commitments.
- Value of Inventory Arriving: Displays the total value of inventory expected to arrive, providing visibility into the financial impact of incoming stock and aiding in budgeting and resource allocation decisions.
- Average Lead Time: Represents the average duration between placing an order and receiving the inventory, helping to assess supplier performance and identify areas for improvement in procurement processes.
Receiving Orders - Screen 2
Screen 2 offers insights into shipment performance and quality control metrics.
Key Terms to Know:
- Shipment on Track: Indicates the percentage of shipments that are progressing according to the planned schedule, providing visibility into the timeliness of deliveries and logistics performance.
- Unloading Time: Represents the average duration taken to unload incoming shipments upon arrival, helping to assess the efficiency of warehouse operations and logistics processes.
- Defect Rate: Reflects the percentage of received inventory items that are defective or do not meet quality standards, allowing for quality control assessment and corrective actions to be taken.
- Average Lead Time: Displays the duration it takes for goods to be delivered from the time an order is placed until it is received.
- Average Delay: Indicates the average delay in the arrival of shipments compared to the expected delivery date, providing insights into logistics performance and potential supply chain disruptions.
- Shipments In Progress: Displays the goods or items that have been dispatched or are en route to their destination but have not yet been delivered or received
- Shipment Received: Shows the goods or items that were in transit have been successfully delivered and received at their designated destination.
Receiving Orders - Screen 3
Screen 3 of the Received Orders Dashboard focuses on analyzing delays in shipments and their impact.
Key Terms to Know:
- Loss Due to Delays by Country: Breaks down the financial impact of delays in shipments by country, enabling procurement teams to identify regions with the highest losses and prioritize improvement efforts accordingly.
- Delays Bucketed: Categorizes delays into different buckets based on severity or duration, offering a structured analysis of delay patterns and facilitating targeted interventions to address specific delay factors.
- Delays Summary Report: Provides a comprehensive overview of delay-related metrics, including total losses, average delay duration, and trends over time, assisting in performance monitoring and strategic decision-making to optimize procurement processes.
Dashboard Template Insights
The wireframe provides crucial insights for optimizing procurement and supplier performance:
- It allows real-time monitoring of key procurement metrics such as OTIF%, average lead time, and defect rate, helping organizations evaluate supplier performance and pinpoint areas for improvement in order fulfillment.
- The dashboard wireframe offers insights into shipment tracking, unloading times, and delays, facilitating the optimization of logistics operations and warehouse management to enhance procurement efficiency and reduce delays.
- Metrics such as defect rate and loss due to delays provide visibility into product quality and the financial impact of shipment delays, enabling proactive quality control measures and mitigation strategies to minimize losses and ensure customer satisfaction.
Conclusion
A Procurement Received Orders dashboard template provides a comprehensive view of all received orders, from receipt to inspection to acceptance. This information can be used to track performance, identify areas for improvement, and make informed decisions about procurement processes. In addition to tracking key metrics, procurement received orders dashboards can also be used to track supplier performance and identify potential risks.