What is a Solar Project Development and CapEx Performance Dashboard?
A Solar Project Development and CapEx Performance Dashboard is a centralized analytics platform designed to help project developers, EPC contractors, and utility operators track development milestones, construction readiness, financial progress, and capital expenditure performance across solar projects. It functions as a solar project development progress monitoring dashboard, enabling teams to assess whether project timelines, budgets, and resource allocations align with planned targets.
The dashboard aggregates data from construction activities, procurement stages, cost categories, and scheduling indicators to provide complete visibility of project health. It also works as a utility-scale solar CapEx planning and expenditure tracking tool, enabling energy companies to understand cost utilization rates, committed CapEx, cost overrun drivers, and financial performance trends. By integrating development progress with CapEx analytics, this dashboard ensures that solar project execution remains efficient, compliant, and aligned with investment plans.
How to Create a Solar Project Development and CapEx Performance Dashboard
You don’t need to build your report from scratch, just start with a ready-to-use dashboard template from Mokkup. Add in your data and export it however you like. Here’s how to do it:
1. Create or Log in to Your Mokkup Account
Start by signing up on Mokkup.ai using your email. If you already have an account, just log in, and you’ll be good to go.
2. Choose and Customize Your Dashboard Template
Find the Solar Project Development and CapEx Performance Dashboard template in the Templates section. Use the drag-and-drop editor to adjust KPIs, edit filters, or add elements based on your data.
3. Export to Your BI Tool
Once your dashboard wireframe is ready, use the BI Tool Export feature to send it directly to Power BI or Tableau for further analysis and enhancements. You can also download the dashboard as a PDF, PNG, or JPEG, embed it on a platform, or invite your team to collaborate.
Note: This is a Pro template. You’ll need a Pro subscription on Mokkup to use and customize this dashboard wireframe. Upgrade anytime to unlock full access.
Solar Project Development and CapEx Performance Dashboard Example
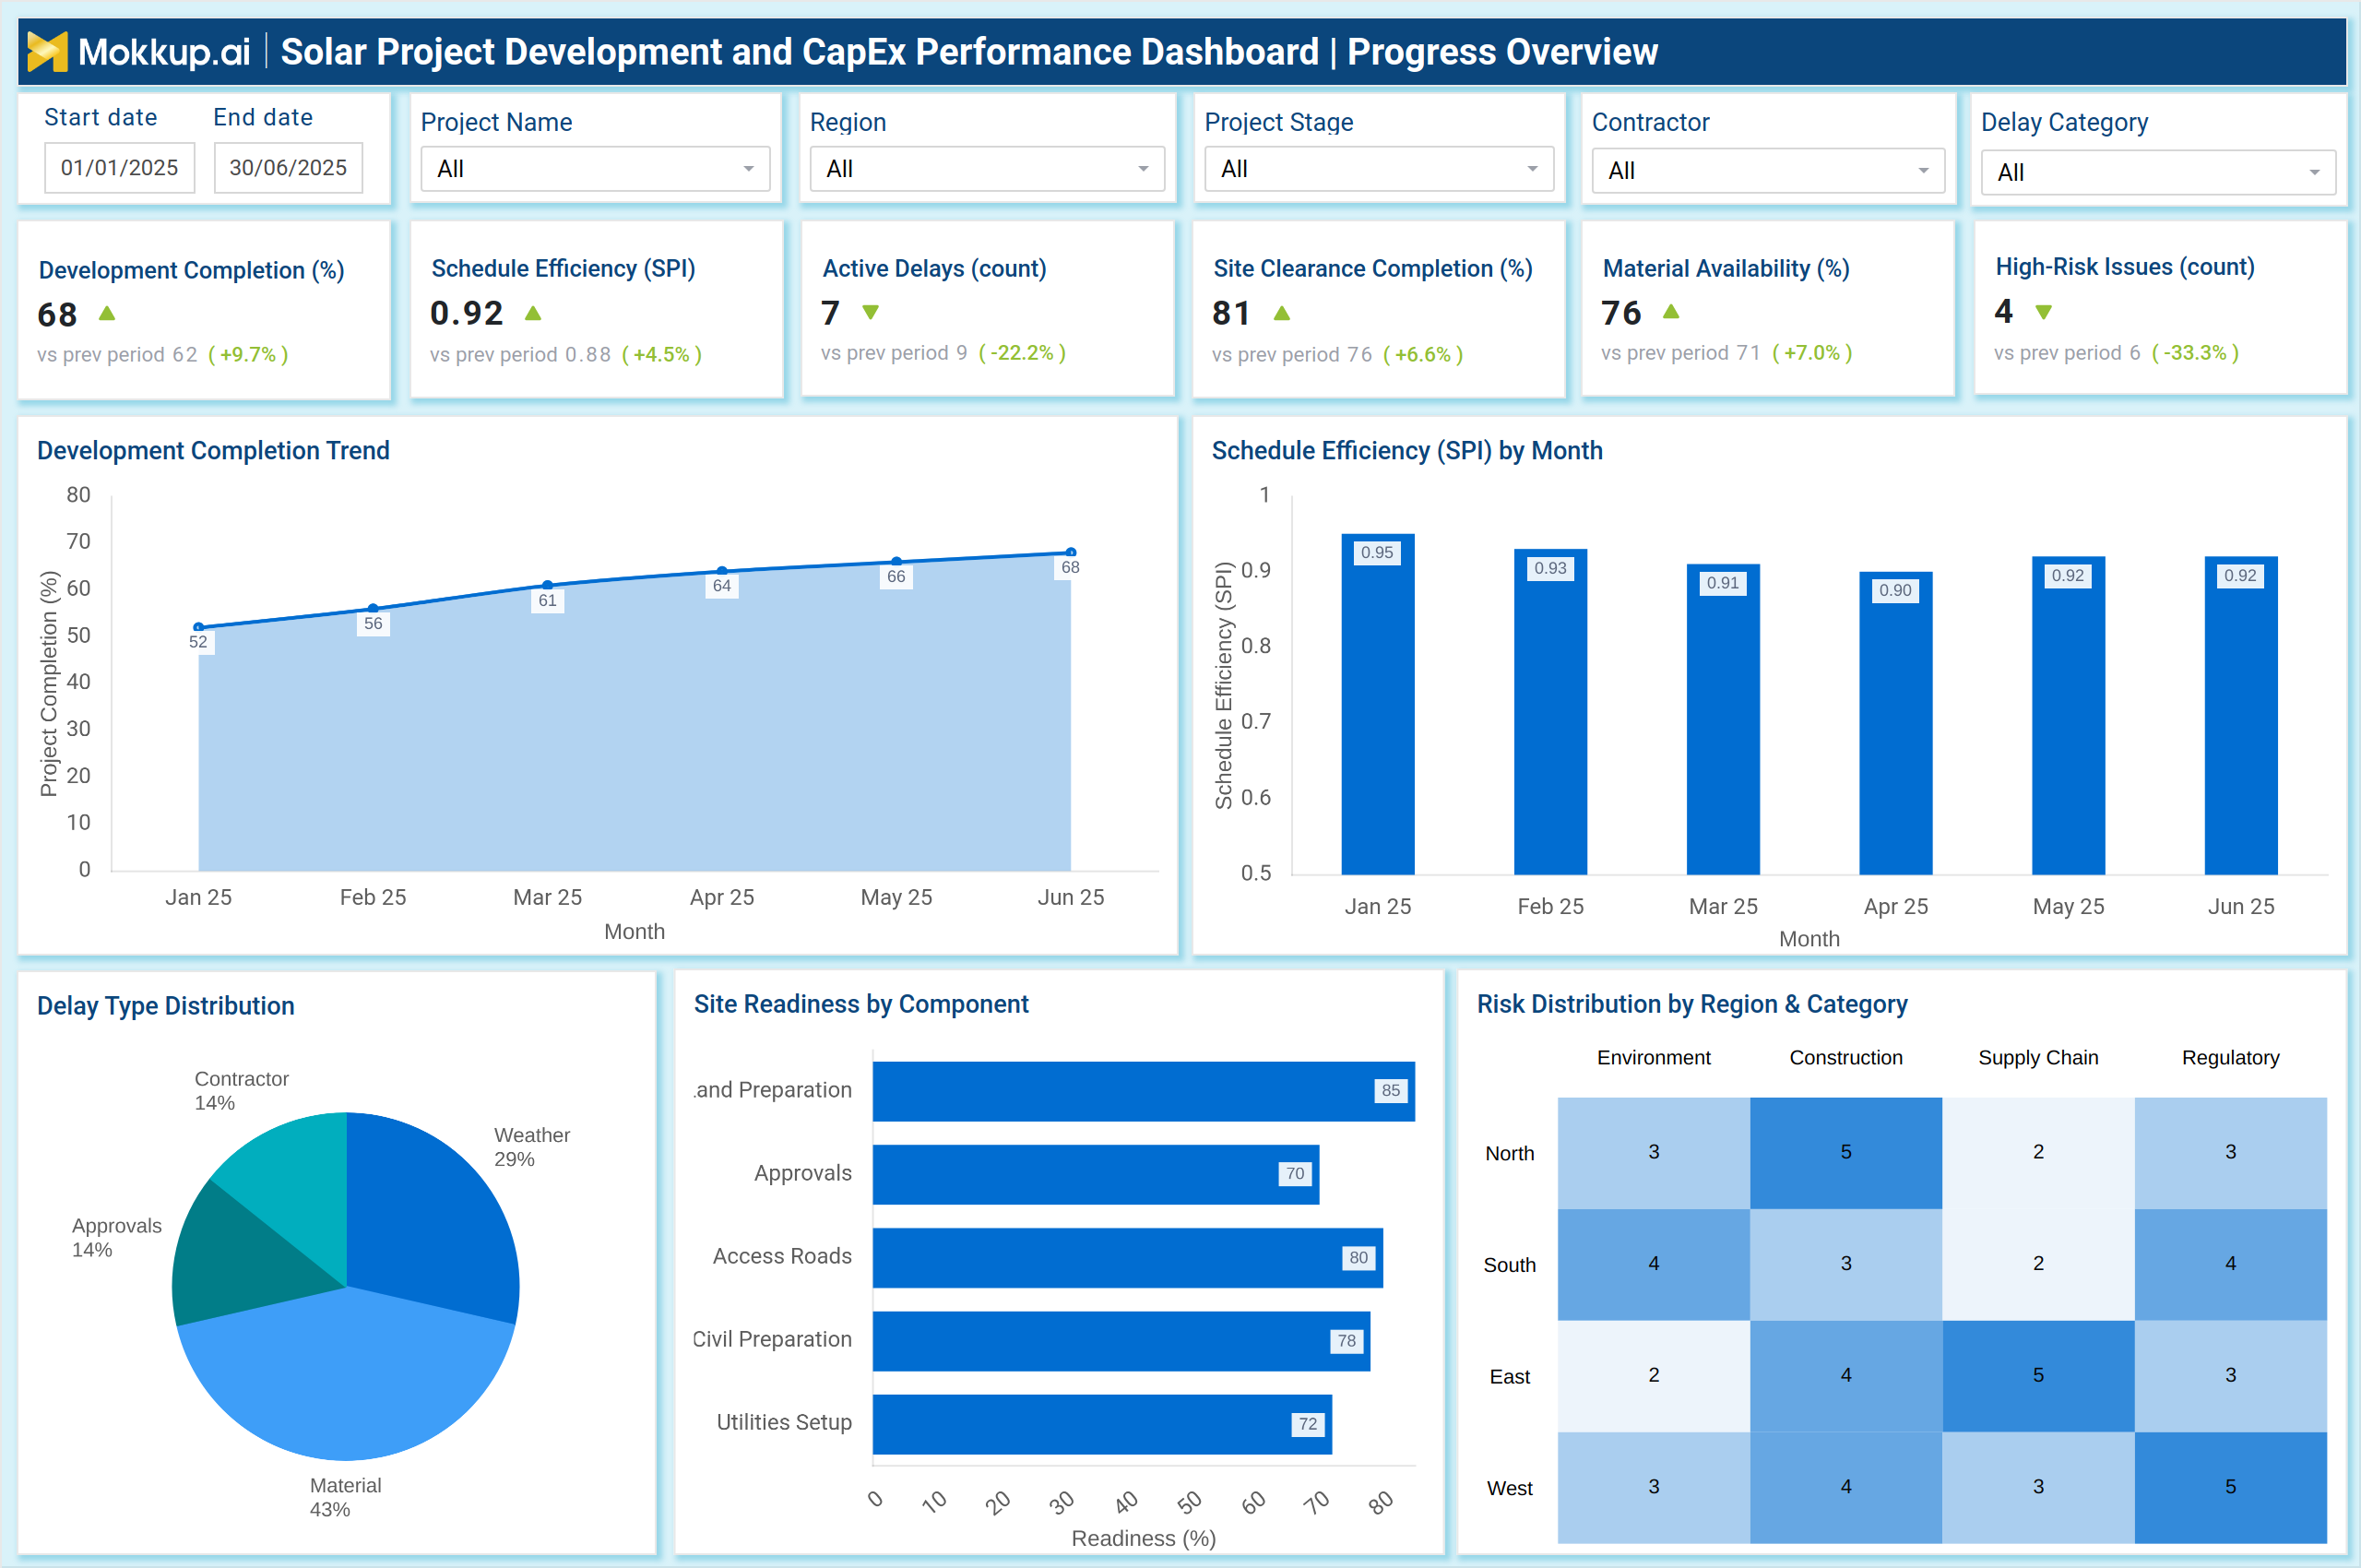
A typical example of this dashboard includes two integrated views: Development Progress Overview and CapEx & Cost Analysis, as shown in the reference visuals. The Development Progress view displays project completion percentage, Schedule Performance Index (SPI), active delays, site clearance progress, material availability, and high-risk issues. Visuals such as SPI trends, development completion curves, delay type distribution, and site readiness by component help evaluate the real-time health of EPC activities. This view serves as a tool for analyzing renewable energy project milestones and budget variances, connecting schedule efficiency with delay drivers and readiness indicators.
The CapEx & Cost Analysis view offers detailed insights into capital planning, budget utilization, committed versus uncommitted CapEx, cost overrun percentages, and forecast cost at completion. Category-level spend charts, monthly CapEx trends, cost overrun breakdowns, and vendor payment performance offer the financial clarity needed to guide execution decisions. This makes the dashboard a reliable solar EPC project schedule, cost, and resource performance dashboard designed to support planning and execution teams. Together, these views create a unified system for electric utility solar project lifecycle planning and execution insights, combining development progress with CapEx performance to ensure timely, cost-efficient project delivery.
How to Analyze Data in Solar Project Development and CapEx Performance Dashboard
Here is how you can analyze data from the solar plant capital expenditure optimization and financial performance system dashboard:
- Review the development completion percentage to understand the overall progress of execution.
- Track Schedule Performance Index (SPI) to measure schedule adherence and detect slippage early.
- Analyze active delays and their categories to identify contractor issues, weather impacts, or approval bottlenecks.
- Check site readiness indicators for land preparation, utilities setup, access roads, and civil works.
- Reviewing high-risk issues serves as an early warning signal for potential project disruptions.
- Monitor material availability to identify and mitigate supply chain risks.
- Evaluate the CapEx budget versus actual spend to identify over-spending or under-utilization.
- Assess cost overrun percentages and link them to cost drivers such as procurement delays or design changes.
- Analyze committed capital expenditures (CapEx) to understand how much of the project value is contractually locked.
- Review the forecasted cost at completion to ensure the final project cost aligns with the approved budget.
- Monitor vendor payment performance to identify EPC partners causing delays.
- Compare monthly capital expenditures (CapEx) trends to detect spending spikes or slowdowns.
- Review risk distribution across regions and categories to support mitigation planning.
Benefits of Solar Project Development and CapEx Performance Dashboard
The following are the benefits of using this dashboard:
- Offers unified visibility into development progress and capital performance.
- Supports real-time schedule and cost control across solar assets.
- Helps identify construction delays and site readiness gaps early.
- Improves procurement and material planning through availability indicators.
- Enables accurate budget utilization and variance analysis.
- Strengthens financial decision-making with clear capital expenditures (CapEx) commitments and forecasts.
- Reduces project risks through structured insight into safety, regulatory, and supply chain issues.
- Supports EPC oversight and contractor performance evaluation.
- Enables better investment planning for utility-scale solar assets.
- Provides complete lifecycle visibility for strategic execution teams.
KPIs to Track in Solar Project Development and CapEx Performance Dashboard
The following key KPIs can be tracked by using this dashboard:
- Development Completion (%) – Measures the percentage of project tasks completed to date.
- Schedule Efficiency (SPI) – Tracks how efficiently the project is progressing against planned timelines.
- Active Delays (count) – Indicates the number of ongoing schedule issues.
- Site Clearance Completion (%) – Shows readiness for development and construction stages.
- Material Availability (%) – Reflects supply chain stability.
- High-Risk Issues (count) – Captures issues affecting cost, schedule, or safety.
- Total CapEx Budget ($) – Approved investment planned for the project.
- CapEx Spent ($) – Actual capital spent to date.
- Budget Utilization (%) – Share of the approved budget already consumed.
- Cost Overrun (%) – Percentage deviation from the planned cost baseline.
- Committed CapEx (%) – Contracted portion of the total CapEx.
- Forecast Cost at Completion ($) – Expected total cost after project completion.
- CapEx Spending by Category – Breakdown across civil, mechanical, electrical, procurement, and services.
- Cost Overrun Drivers – Key Factors Contributing to Overspending.
- Vendor Payment Performance (%) – Measures on-time, delayed, and disputed payments.
Frequently Asked Questions
1. Who uses this dashboard?
Project managers, EPC contractors, financial controllers, asset development teams, and utility leadership teams.
2. Why is SPI important?
SPI shows whether project execution is ahead or behind schedule and helps detect timeline risks early.
3. How does this dashboard help reduce cost overruns?
It highlights the root causes of overspending and visualizes cost categories requiring attention.