
What is a Hydrogen Transition Workforce Readiness Dashboard?
The Hydrogen Transition Workforce Readiness Dashboard is an HR analytics template built for natural gas utilities managing the shift to hydrogen-blend gas operations. As utilities integrate hydrogen into their distribution and delivery infrastructure, the human side of that transition — training, certification, and skill development — requires the same rigorous tracking as the technical side. This dashboard consolidates workforce data across divisions, business units, regions, and role categories into a single view, giving HR leaders and operations managers a clear picture of where their teams stand.
It covers the full readiness lifecycle: from hydrogen certified staff tracking and training completion, to critical skill gap analysis and first-time assessment performance. The template is designed for HR departments in natural gas utilities where workforce compliance and hydrogen-specific competency are directly tied to operational safety and regulatory readiness.
How to Create a Hydrogen Transition Workforce Readiness Dashboard
You don’t need to build your report from scratch, just start with a ready-to-use Hydrogen Transition Workforce Readiness template from Mokkup. Add in your data and export it however you like. Here’s how to do it:
1. Create or Log in to Your Mokkup Account
Start by signing up on Mokkup.ai using your email. If you already have an account, just log in, and you'll be good to go.
2. Choose and Customize Your Dashboard Template
Find the Hydrogen Transition Workforce Readiness Dashboard template in the Templates section. Use the drag-and-drop editor to adjust KPIs, edit filters, or add elements based on your data.
3. Export to Your BI Tool
Once your dashboard wireframe is ready, use the BI Tool Export feature to send it directly to Power BI or Tableau for further analysis and enhancements. You can also download the dashboard as a PDF, PNG, or JPEG, embed it on a platform, or invite your team to collaborate. Note: This is a Pro template. You'll need a Pro subscription on Mokkup to use and customize this dashboard wireframe. Upgrade anytime to unlock full access.
Note: This is a Pro template. You’ll need a Pro subscription on Mokkup to use and customize this dashboard wireframe. Upgrade anytime to unlock full access.
Hydrogen Transition Workforce Readiness Dashboard Example
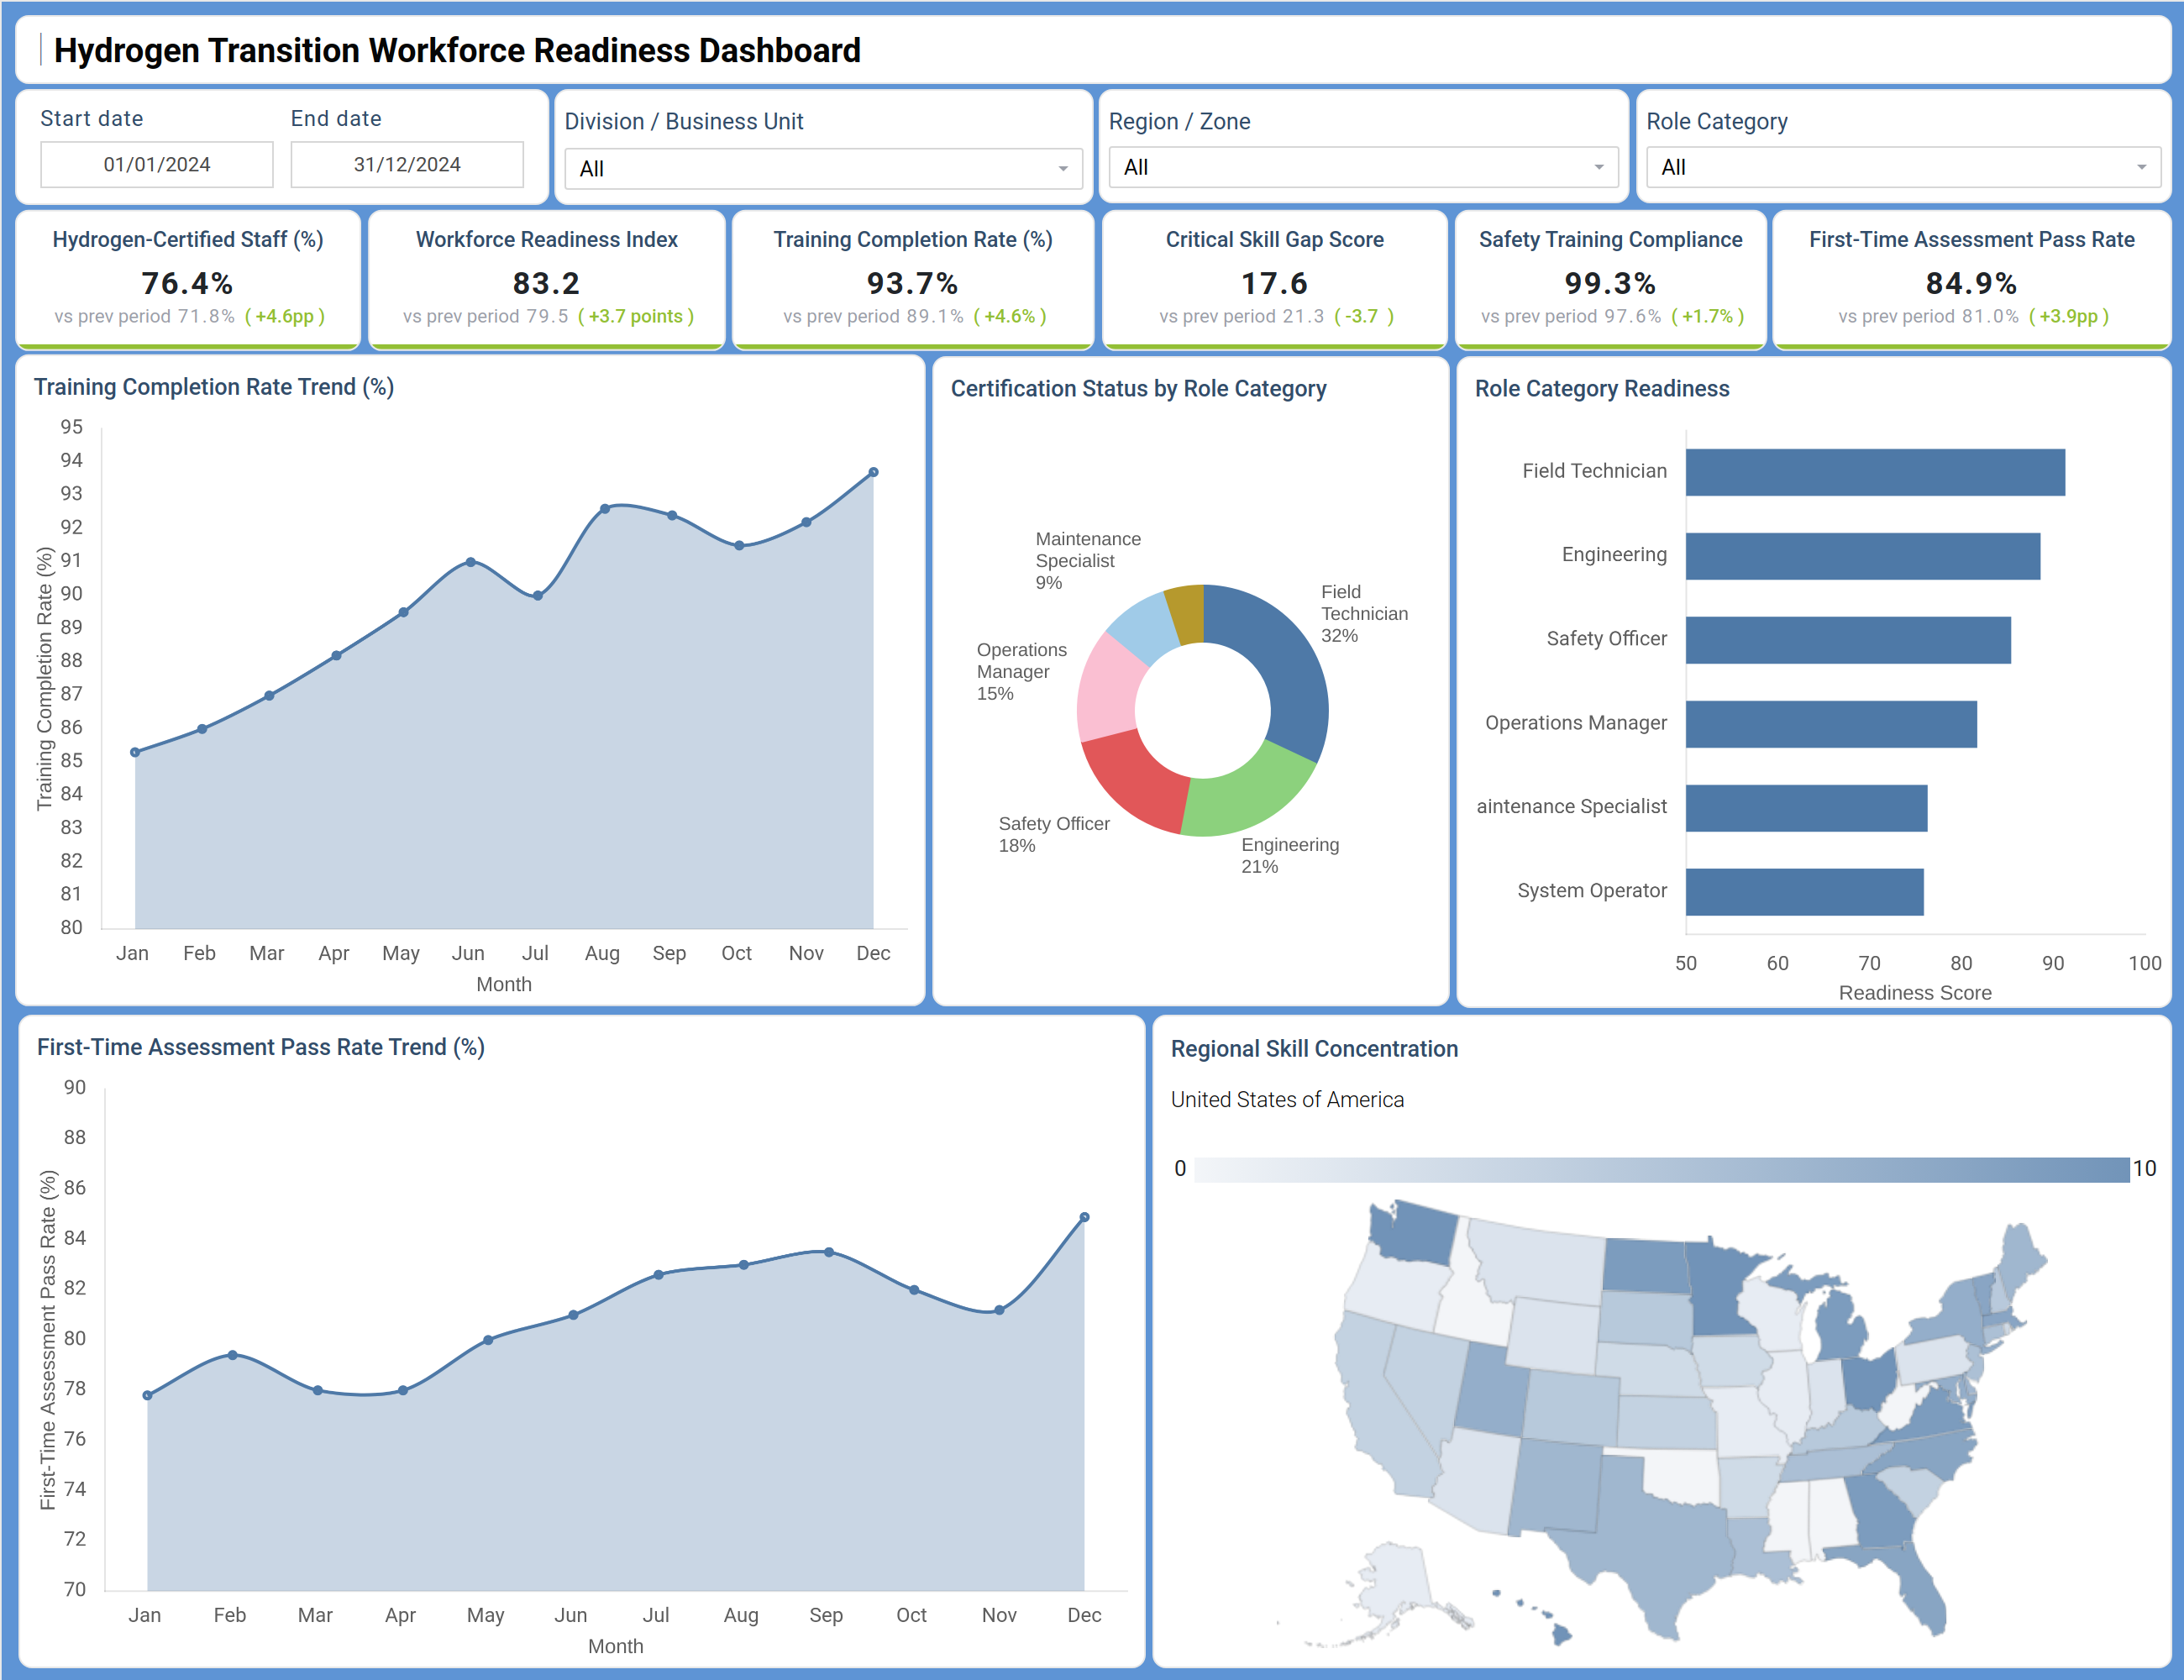
The dashboard opens with six KPI tiles — Hydrogen-Certified Staff (%), Workforce Readiness Index, Training Completion Rate (%), Critical Skill Gap Score, Safety Training Compliance, and First-Time Assessment Pass Rate — each showing performance against the previous period. A line chart tracks Training Completion Rate Trend (%) month by month, making it easy to spot dips. A donut chart shows Certification Status by Role Category across Field Technicians, Engineering, Safety Officers, Operations Managers, Maintenance Specialists, and System Operators. A horizontal bar chart displays Role Category Readiness scores for each group.
A second line chart tracks First-Time Assessment Pass Rate Trend (%) over time, indicating whether staff pass hydrogen-specific assessments on their first attempt. A geographic map shows Regional Skill Concentration across the United States, identifying areas with low hydrogen skill density. Filters for Start Date, End Date, Division / Business Unit, Region / Zone, and Role Category allow targeted data slicing.
How to Analyze Data in a Hydrogen Transition Workforce Readiness Dashboard
Here is how you can analyze data from this dashboard:
- KPI Performance Overview: Start with KPI tiles to assess hydrogen-certified staff percentage, workforce readiness index, and training completion against previous periods.
- Training Trend Analysis: Review Training Completion Rate Trend to identify drops in participation and link them to specific divisions or roles.
- Certification Gap Identification: Use Certification Status by Role Category to detect roles with low certification coverage and prioritize training efforts.
- Role-Based Readiness Comparison: Analyze Role Category Readiness scores to compare preparedness across technicians, engineers, and operations teams.
- Assessment Effectiveness Tracking: Evaluate First-Time Assessment Pass Rate Trend to measure training quality and identify areas needing improvement.
- Regional Skill Distribution: Use Regional Skill Concentration maps to identify geographic gaps in hydrogen-certified workforce availability.
- Segment-Level Drilldown: Apply filters for division, region, and role category to uncover localized workforce readiness gaps.
- Skill Gap Prioritization: Analyze Critical Skill Gap Score to identify high-risk areas requiring immediate training or hiring intervention.
- Safety Compliance Monitoring: Track Safety Training Compliance to ensure workforce readiness aligns with regulatory and operational safety requirements.
Benefits of a Hydrogen Transition Workforce Readiness Dashboard
The following are the benefits of using this dashboard:
- Centralized Workforce Visibility: Centralizes hydrogen certification, training, and assessment data across all divisions and roles.
- Early Skill Gap Identification: Identifies critical skill gaps by role and region before they create compliance or safety risks.
- Data-Driven Training Decisions: Supports strategic allocation of training budgets, certification programs, and hiring efforts.
- Improved Safety Compliance: Tracks safety training compliance continuously, reducing regulatory and operational risks.
- Trend-Based Workforce Monitoring: Enables tracking of workforce readiness trends over time instead of relying on static reports.
- Cross-Functional Alignment: Provides a shared view for HR and operations teams to improve coordination during the hydrogen transition.
KPIs to Track in a Hydrogen Transition Workforce Readiness Dashboard
The following key KPIs can be tracked by using this dashboard:
- Hydrogen-Certified Staff (%): Percentage of the workforce that holds a valid hydrogen-specific certification — a direct measure of operational readiness.
- Workforce Readiness Index: A composite score reflecting overall team preparedness for hydrogen-blend operations, aggregated across role categories and divisions.
- Training Completion Rate (%): Percentage of assigned training modules completed by staff, used to gauge program participation and flag lagging divisions or roles.
- Critical Skill Gap Score: Quantifies the severity of missing competencies across the workforce. A rising score signals an area needing a structured natural gas utilities workforce skills gap analysis response.
- Safety Training Compliance: Percentage of staff meeting required safety training standards — critical for regulatory compliance and safe hydrogen-blend gas operations.
- First-Time Assessment Pass Rate: Percentage of staff who pass hydrogen competency assessments on their first attempt, indicating training effectiveness before the assessment stage.
Frequently Asked Questions
Q1. What type of organization is this dashboard built for?
This dashboard is designed for HR and operations teams in natural gas utilities managing a hydrogen-blend gas transition. It is suited for safety training compliance dashboard for gas utilities use cases where certification and readiness tracking are tied to regulatory and operational requirements.
Q2. Can the dashboard be filtered by region or job role?
Yes. The dashboard includes filters for Start Date, End Date, Division / Business Unit, Region / Zone, and Role Category, allowing users to isolate data for any operational segment or geographic area.
Q3. How does the Regional Skill Concentration map help HR teams?
The map shows where hydrogen-certified staff are concentrated across the United States, making it straightforward to identify regions with low hydrogen skill density and prioritize workforce development or hiring efforts there.
Q4. What KPIs does this dashboard track for workforce readiness?
The dashboard tracks Hydrogen-Certified Staff (%), Workforce Readiness Index, Training Completion Rate (%), Critical Skill Gap Score, Safety Training Compliance, and First-Time Assessment Pass Rate — giving HR leaders a complete picture of hydrogen transition readiness.
Q5. How does this dashboard support regulatory compliance?
By continuously tracking Safety Training Compliance and certification status across all role categories, the dashboard helps utilities maintain regulatory readiness and quickly identify gaps before they become compliance risks.