
What is an Electric Power Distribution Utilities Workforce Readiness & Productivity Dashboard?
An Electric Power Distribution Utilities Workforce Readiness & Productivity Dashboard template is a centralized analytics platform that tracks workforce capacity, performance, and operational efficiency for distribution system operators (DSOs). It combines workforce readiness metrics, labor productivity indicators, safety data, and cost information into a single view. This type of workforce analytics for electric power utilities helps leaders understand how well field crews, engineers, technicians, and support teams are prepared to meet grid operations and maintenance demands.
By monitoring critical role vacancy rates, overtime hours, work orders completed per FTE, and workforce readiness scores, utilities can align staffing levels with service reliability goals. The dashboard also supports data-driven decisions for hiring, training, and workforce optimization across electric distribution operations.
How to Create an Electric Power Distribution Utilities Workforce Readiness & Productivity Dashboard
You don’t need to build your report from scratch, just start with a ready to use Electric Power Distribution Utilities Workforce Readiness & Productivity dashboard template from Mokkup. Add in your data and export it however you like. Here’s how to do it:
1. Create or Log in to Your Mokkup Account
Start by signing up on Mokkup.ai using your email. If you already have an account, just log in, and you’ll be good to go.
2. Choose and Customize Your Dashboard Template
Find the Electric Power Distribution Utilities Workforce Readiness & Productivity Dashboard template in the Templates section. Use the drag and drop editor to adjust KPIs, edit filters, or add elements based on your data.
3. Export to Your BI Tool
Once your dashboard wireframe is ready, use the BI Tool Export feature to send it directly to Power BI or Tableau for further analysis and enhancements. You can also download the dashboard as a PDF, PNG, or JPEG, embed it on a platform, or invite your team to collaborate.
Note: This is a Pro template. You’ll need a Pro subscription on Mokkup to use and customize this dashboard wireframe. Upgrade anytime to unlock full access.
Electric Power Distribution Utilities Workforce Readiness & Productivity Dashboard Example
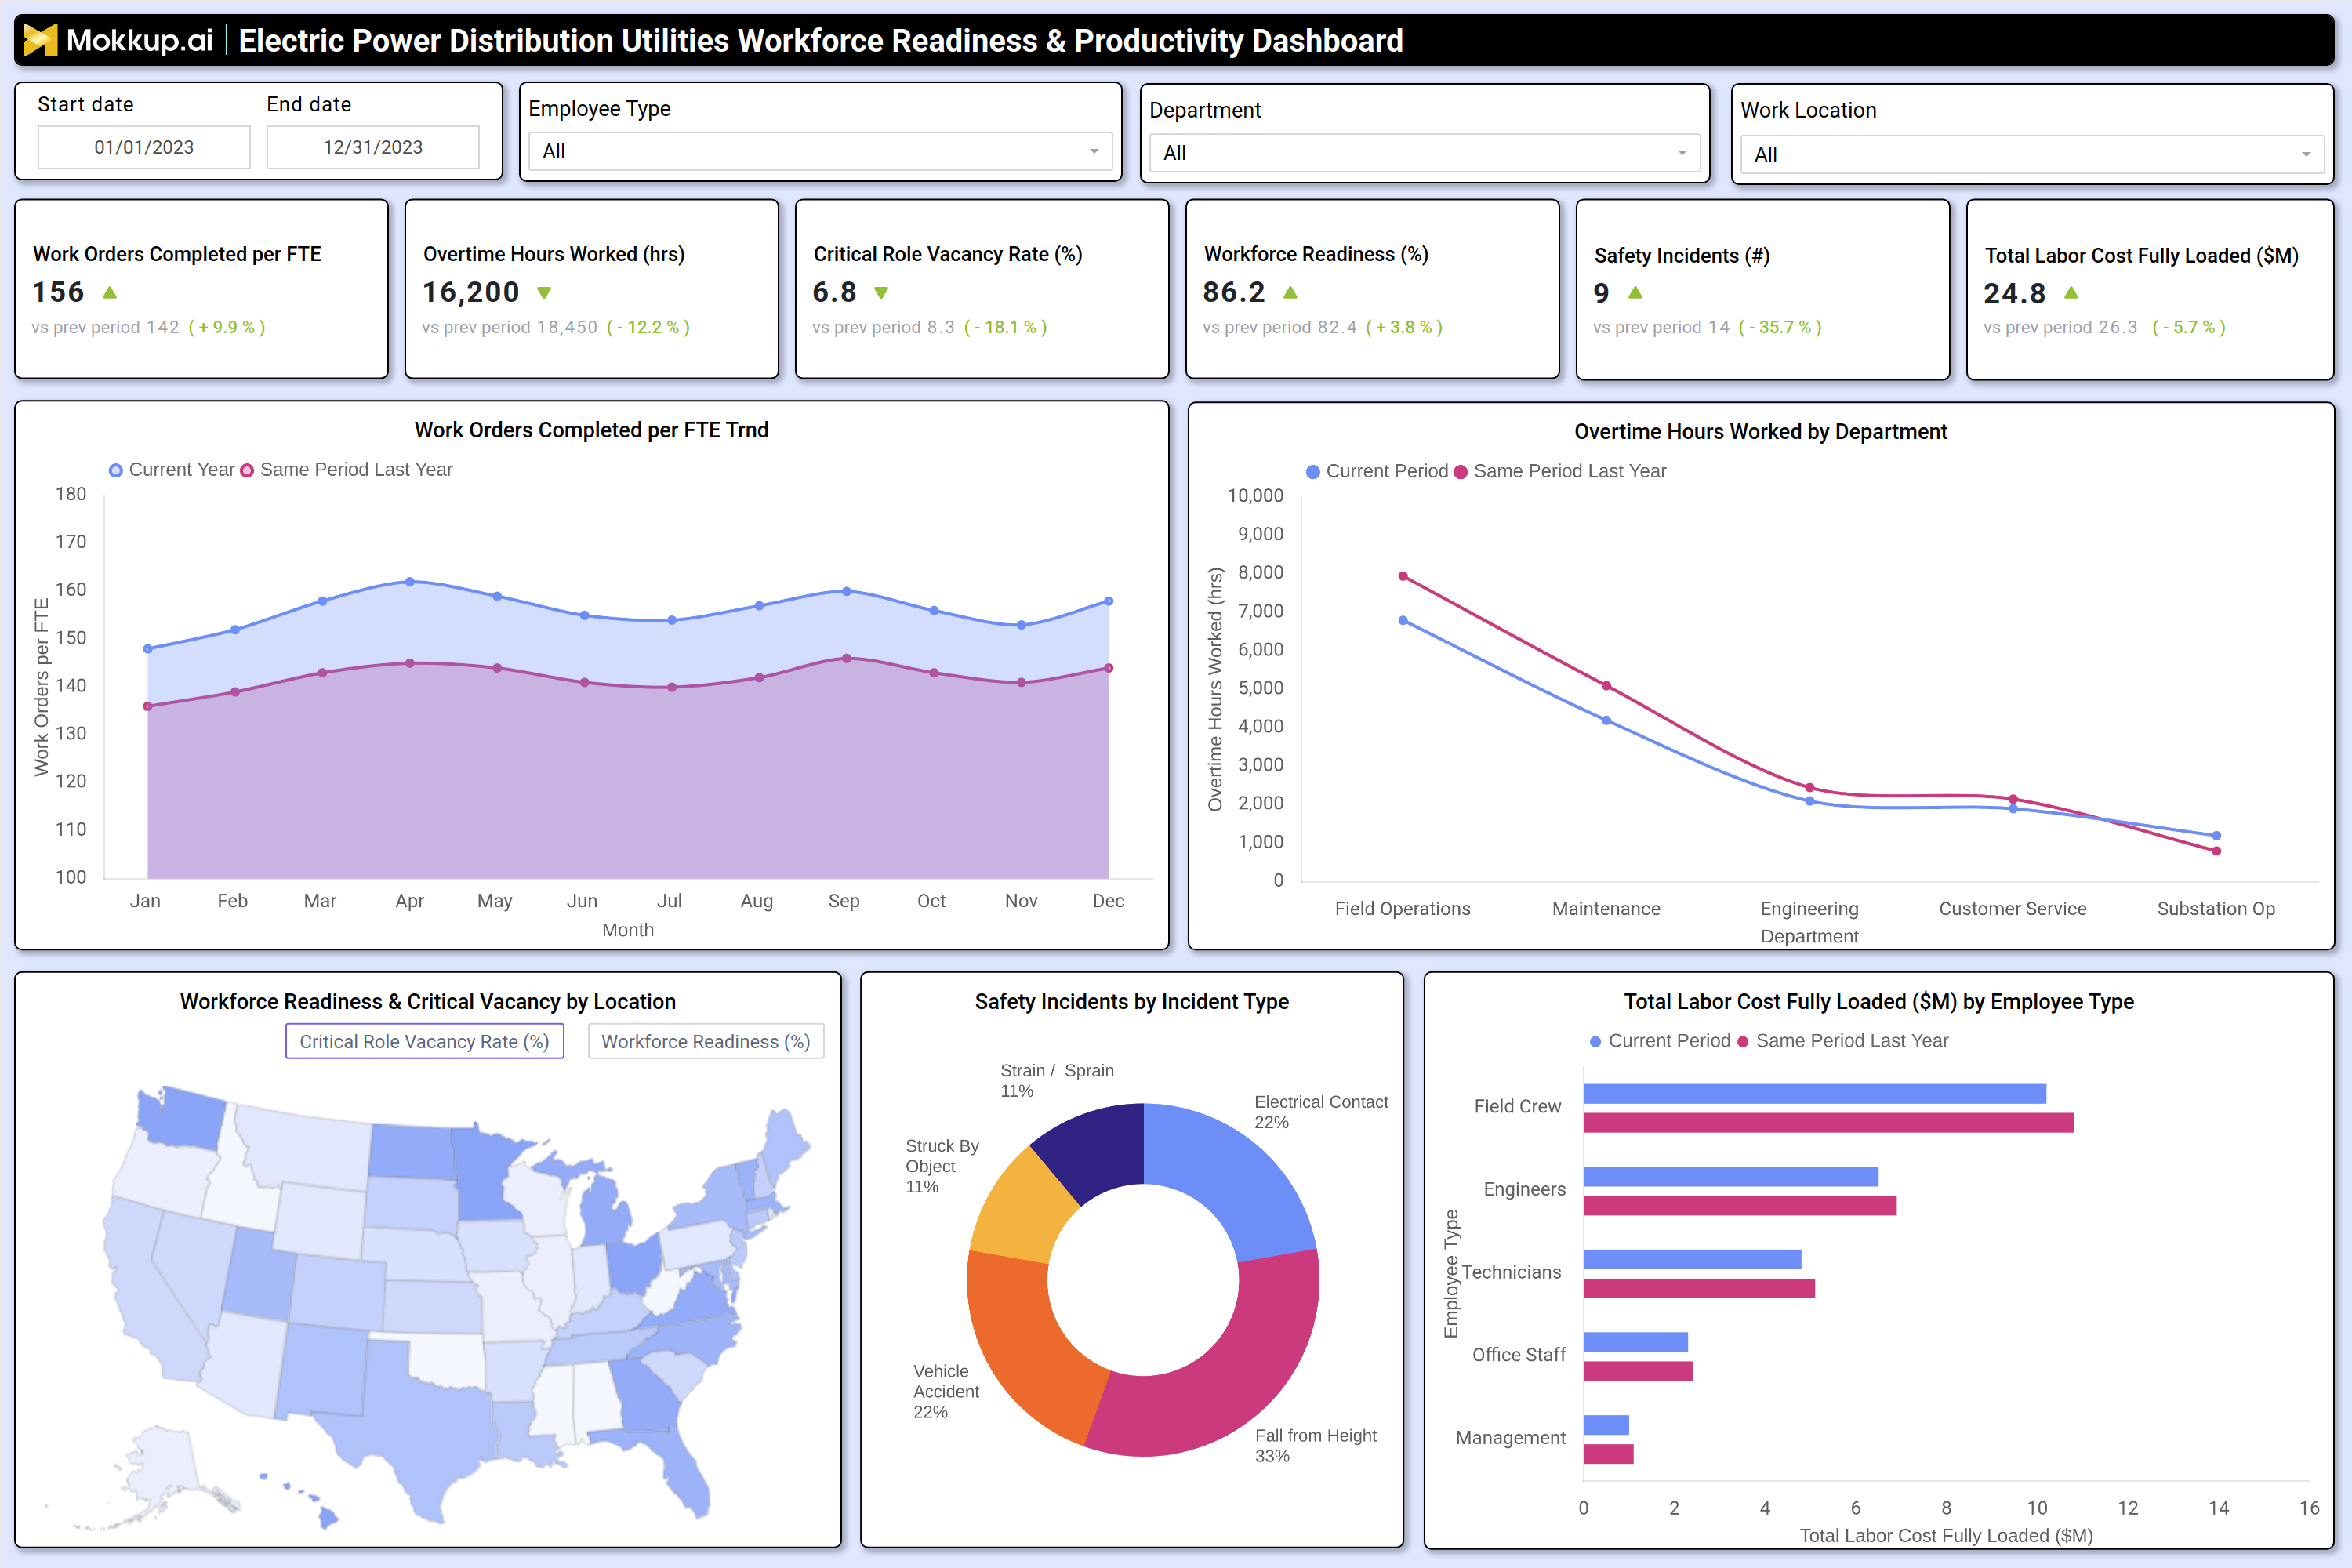
A typical productivity dashboard for electric distribution utilities includes interactive filters for date range, employee type, department, and work location. Key performance tiles show work orders completed per FTE, overtime hours worked, critical role vacancy rate, workforce readiness percentage, safety incidents, and total fully loaded labor cost. Trend charts compare current year performance against the same period last year for productivity and overtime.
Department level views highlight where overtime is concentrated across field operations, maintenance, engineering, customer service, and substation operations. A geographic map displays workforce readiness and vacancy rates by service territory. Safety incident breakdowns by type and labor cost by employee category provide additional operational context. Together, these components form a DSO workforce performance monitoring platform that gives leaders a view of workforce health and productivity.
How to Analyze Data in an Electric Power Distribution Utilities Workforce Readiness & Productivity Dashboard
Here is how you can analyze data from this dashboard wireframe:
- Labor Productivity Measurement: Review work orders completed per FTE to measure workforce productivity across departments and time periods.
- Overtime Utilization Analysis: Track overtime hours worked to identify workload imbalances and staffing shortages.
- Critical Role Coverage: Monitor critical role vacancy rates to assess hiring gaps in essential operational positions.
- Workforce Readiness Assessment: Compare workforce readiness percentages against target thresholds to evaluate training and certification coverage.
- Safety Risk Identification: Analyze safety incidents by type to identify high-risk activities and strengthen safety programs.
- Labor Cost Control: Evaluate total labor cost trends to manage overtime spending and overall workforce expenses.
- Department-Level Performance Review: Use department-level breakdowns to locate productivity or capacity bottlenecks.
- Performance Trend Comparison: Compare current performance with historical periods to detect improvement or decline.
Benefits of an Electric Power Distribution Utilities Workforce Readiness & Productivity Dashboard
The following are the benefits of using this dashboard wireframe:
- Workforce Visibility: Improves visibility into workforce capacity and readiness across all DSO operations.
- Optimized Staffing: Supports workforce optimization by aligning staffing levels with service demand.
- Reduced Overtime Costs: Reduces overtime expenses through proactive workload and resource planning.
- Higher Productivity: Enhances labor productivity using data-driven performance tracking.
- Stronger Safety Management: Strengthens safety management through incident trend analysis.
- Better Hiring and Training Decisions: Improves hiring and training strategies using vacancy and readiness metrics.
- Operational Efficiency Gains: Increases overall operational efficiency for power distribution companies.
- Faster Decision-Making: Enables faster and more accurate management decisions using workforce analytics.
KPIs to Track in an Electric Power Distribution Utilities Workforce Readiness & Productivity Dashboard
The following key KPIs can be tracked by using this dashboard wireframe:
- Work Orders Completed per FTE (Count): Measures workforce productivity by showing how many work orders each full time employee completes.
- Overtime Hours (Hrs): Tracks total overtime worked to indicate workload pressure and staffing shortages.
- Workforce Readiness Percentage (%): Shows the proportion of employees fully trained, certified, and available for operational duties.
- Critical Role Vacancy Rate (%): Measures the percentage of unfilled essential roles that directly impact grid operations.
- Safety Incidents (Count): Counts workplace accidents to monitor workforce safety performance and operational risk.
- Total Labor Cost Fully Loaded ($M): Represents total workforce cost including wages, benefits, overtime, and overhead.
Frequently Asked Questions
Q1. How does an electric power distribution workforce readiness dashboard help electric distribution utilities?
It helps utilities track work output per employee, control overtime, and improve workforce efficiency.
Q2. How does this dashboard help improve workforce productivity?
This dashboard brings together productivity, readiness, safety, and cost metrics in one view, allowing managers to identify staffing gaps, overtime drivers, and skill shortages early. By using these insights, utilities can allocate resources more effectively, reduce inefficiencies, and improve overall workforce productivity across operations.
Q3. Who should use a DSO workforce performance monitoring platform?
Utility operations managers, HR leaders, safety teams, and executive leadership.