What is a Hydrogen Blend Gas Supply Chain Reliability & Procurement Dashboard?
The Hydrogen Blend Gas Supply Chain Reliability & Procurement Dashboard is a purpose-built analytical tool for procurement managers, supply chain directors, and energy planners overseeing hydrogen blending programs. It brings together supplier performance data, blend quality metrics, procurement cost structures, and operational incident records into a unified view. As hydrogen blending operations grow in scale — drawing from green, grey, and blue hydrogen procurement sources — the demand for structured oversight of supplier commitments and quality consistency increases. This dashboard supports hydrogen blend gas supply chain management by connecting procurement decisions with operational outcomes, enabling teams to detect risk early and maintain continuity across injection zones.
How to Create a Hydrogen Blend Gas Supply Chain Reliability & Procurement Dashboard
You don't need to build your report from scratch, just start with a ready-to-use dashboard template from Mokkup. Add in your data and export it however you like. Here's how to do it:
1. Create or Log in to Your Mokkup Account
Start by signing up on Mokkup.ai using your email. If you already have an account, just log in, and you'll be good to go.
2. Choose and Customize Your Dashboard Template
Find the Hydrogen Blend Gas Supply Chain Reliability & Procurement Dashboard template in the Templates section. Use the drag-and-drop editor to adjust KPIs, edit filters, or add elements based on your data.
3. Export to Your BI Tool
Once your dashboard wireframe is ready, use the BI Tool Export feature to send it directly to Power BI or Tableau for further analysis and enhancements. You can also download the dashboard as a PDF, PNG, or JPEG, embed it on a platform, or invite your team to collaborate.
Note: This is a Pro template. You'll need a Pro subscription on Mokkup to use and customize this dashboard wireframe. Upgrade anytime to unlock full access.
Hydrogen Blend Gas Supply Chain Reliability & Procurement Dashboard Example
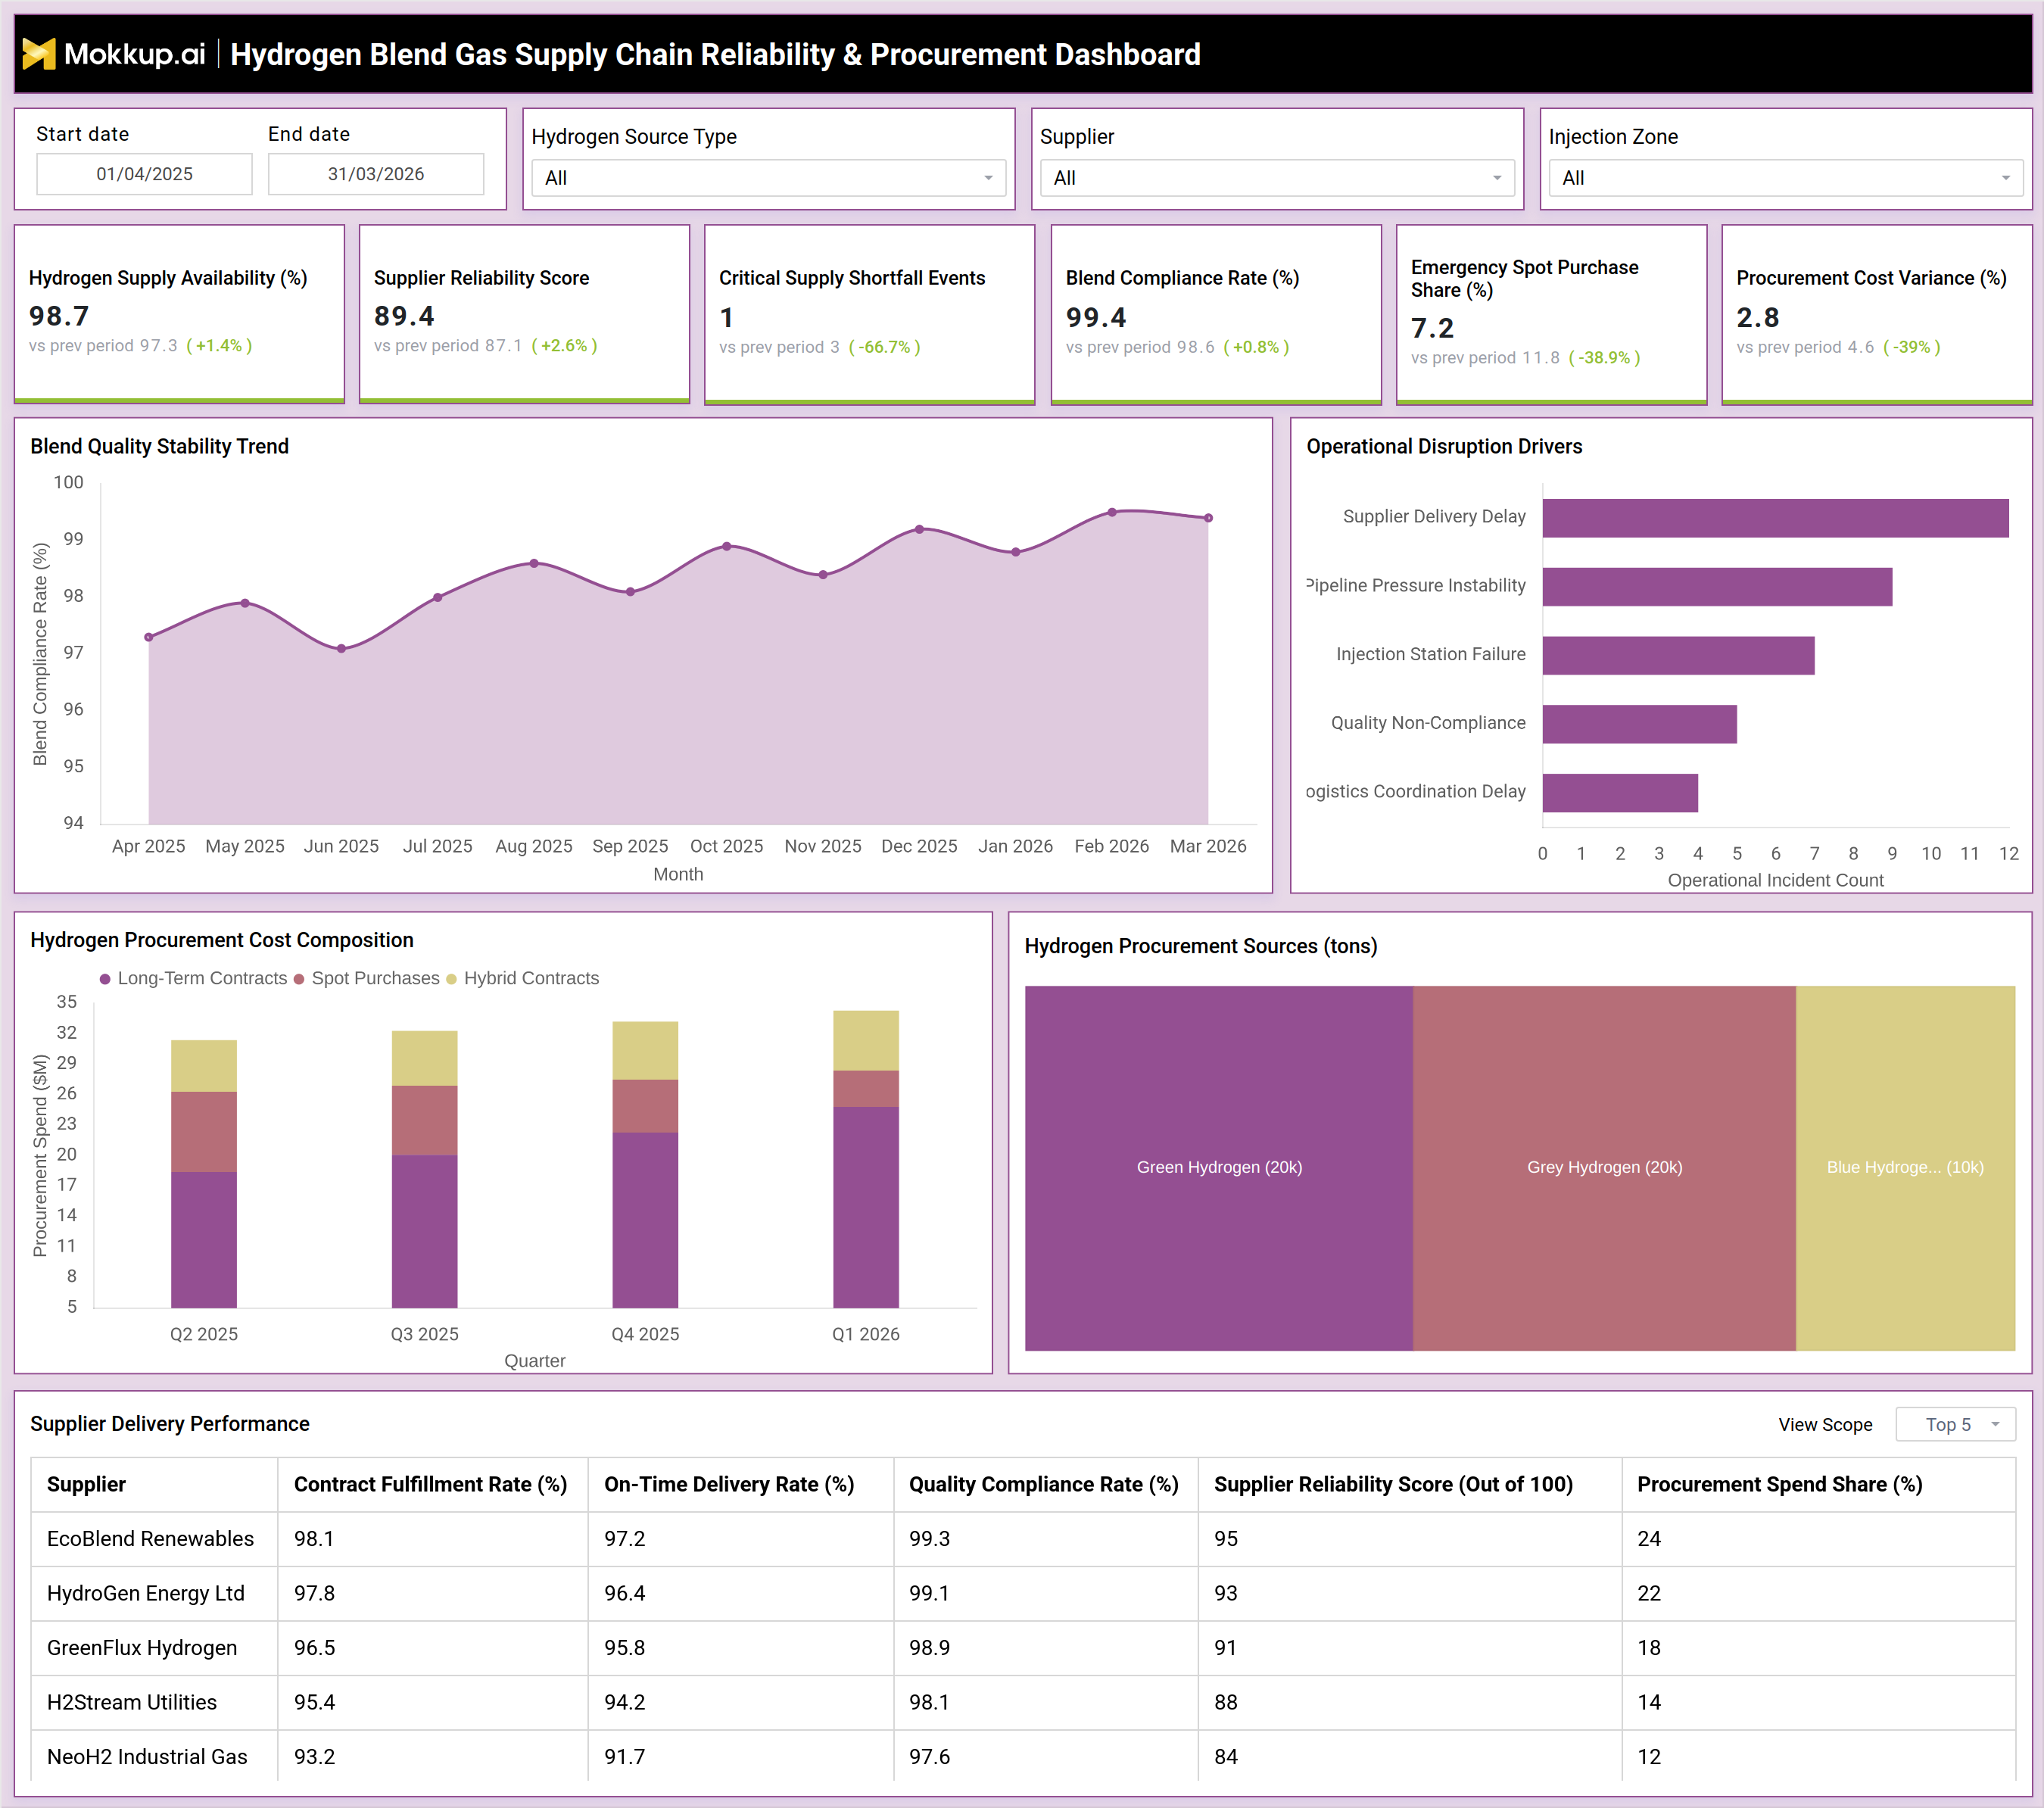
A procurement director opens this dashboard to assess the current state of supplier commitments ahead of a quarterly review. The Supplier Delivery Performance table immediately surfaces which suppliers are meeting their contract fulfillment, on-time delivery, and quality compliance obligations, and which are falling short of the supplier reliability score thresholds defined in the contract. Teams use this view to triage risk before it escalates, comparing procurement spend share across suppliers to identify concentration exposure. In the Hydrogen Procurement Cost Composition chart, planners examine how spending is distributed between long-term contracts, spot purchases, and hybrid contracts over time. A rise in spot purchase share signals supply stress, prompting the team to investigate whether the cause lies in green hydrogen procurement sources availability or a compliance-driven shortfall.
The blend quality stability trend line gives quality teams a month-by-month view of compliance rate behavior. When a dip appears, teams cross-reference it with the Operational Disruption Drivers chart, which ranks incidents by count: supplier delivery delay, pipeline pressure instability, injection station failure, quality noncompliance, and logistics coordination delay. Addressing operational disruption drivers in the gas supply chain before they repeat keeps blend compliance above target thresholds and reduces emergency sourcing pressure. The combined view enables supply chain teams to shift from reactive response to deliberate planning, maintaining hydrogen supply availability while controlling procurement costs across all active injection zones.
How to Analyze Data in a Hydrogen Blend Gas Supply Chain Reliability & Procurement Dashboard
Here is how you can analyze data from this dashboard:
- Filter by Hydrogen Source Type, Supplier, or Injection Zone to segment data by operational scope.
- Review the Supplier Delivery Performance table to compare contract fulfillment rate, on-time delivery rate, and quality compliance rate across all active suppliers.
- Use the Hydrogen Procurement Cost Composition chart to track spend distribution between long-term contracts, spot purchases, and hybrid contracts by quarter.
- Monitor the Blend Quality Stability Trend line to detect month-over-month deviations in blend compliance rate monitoring.
- Cross-reference the Operational Disruption Drivers chart with supplier data to attribute incidents to specific root causes.
- Analyze Hydrogen Procurement Sources to track volume split across green, grey, and blue hydrogen categories.
Benefits of a Hydrogen Blend Gas Supply Chain Reliability & Procurement Dashboard
The following are the benefits of using this dashboard:
- Centralizes hydrogen blend gas supply chain management data — from supplier delivery to blend quality — in one structured view.
- Reduces procurement cost overruns with direct visibility into hydrogen procurement cost variance tracking and spot purchase dependency.
- Strengthens supplier accountability by quantifying fulfillment, delivery, and quality performance across the entire supplier base.
- Supports blend compliance rate monitoring through a continuous quality trend line rather than periodic audits.
- Surfaces operational disruption drivers in the gas supply chain before they compound into supply shortfalls.
- Enables strategic sourcing decisions by visualizing procurement volume across green hydrogen procurement sources and alternative hydrogen types.
- Reduces reliance on manual reporting by consolidating procurement, quality, and delivery data in one view.
KPIs to Track in a Hydrogen Blend Gas Supply Chain Reliability & Procurement Dashboard
The following key KPIs can be tracked by using this dashboard:
- Hydrogen Supply Availability (%) — measures the proportion of time hydrogen supply meets operational demand without interruption.
- Supplier Reliability Score — a composite score rating each supplier's dependability based on delivery, quality, and fulfillment performance; a declining supplier reliability score for hydrogen procurement flags vendor risk early.
- Critical Supply Shortfall Events — counts incidents where supply fell below critical thresholds, signaling procurement exposure.
- Blend Compliance Rate (%) — tracks the percentage of blend batches that meet quality standards; central to blend compliance rate monitoring.
- Emergency Spot Purchase Share (%) — indicates the proportion of total procurement fulfilled via unplanned spot purchases, reflecting supply chain stress.
- Procurement Cost Variance (%) — measures deviation of actual spend from planned procurement budgets; drives hydrogen procurement cost variance tracking decisions.
- Contract Fulfillment Rate (%) — the share of contracted hydrogen volumes actually delivered by each supplier.
- On-Time Delivery Rate (%) — percentage of deliveries completed within the agreed schedule.
- Quality Compliance Rate (%) — proportion of delivered hydrogen meeting blend quality specifications per batch.
Frequently Asked Questions
1. What types of organizations benefit most from this dashboard?
Gas utilities, energy companies, and industrial manufacturers that source hydrogen from multiple suppliers and manage blending for injection or distribution will benefit most. It is designed for teams where supplier reliability and blend quality directly affect operational continuity.
2. How does hydrogen procurement cost variance tracking support budget control?
The dashboard surfaces deviations between planned and actual procurement spend at the KPI level, enabling managers to investigate whether the variance stems from spot purchase dependency or contract-price drift. Consistent hydrogen procurement cost variance tracking prevents reactive spending decisions before they impact the annual budget.
3. Can this dashboard support sourcing decisions for green hydrogen?
Yes. The Hydrogen Procurement Sources chart breaks down procurement volumes by hydrogen type, including green hydrogen, enabling teams to evaluate the volume share from green hydrogen procurement sources and adjust their supply mix based on cost, availability, and sustainability targets.