
What is a CNG Gas Price Exposure & Cost Volatility Dashboard?
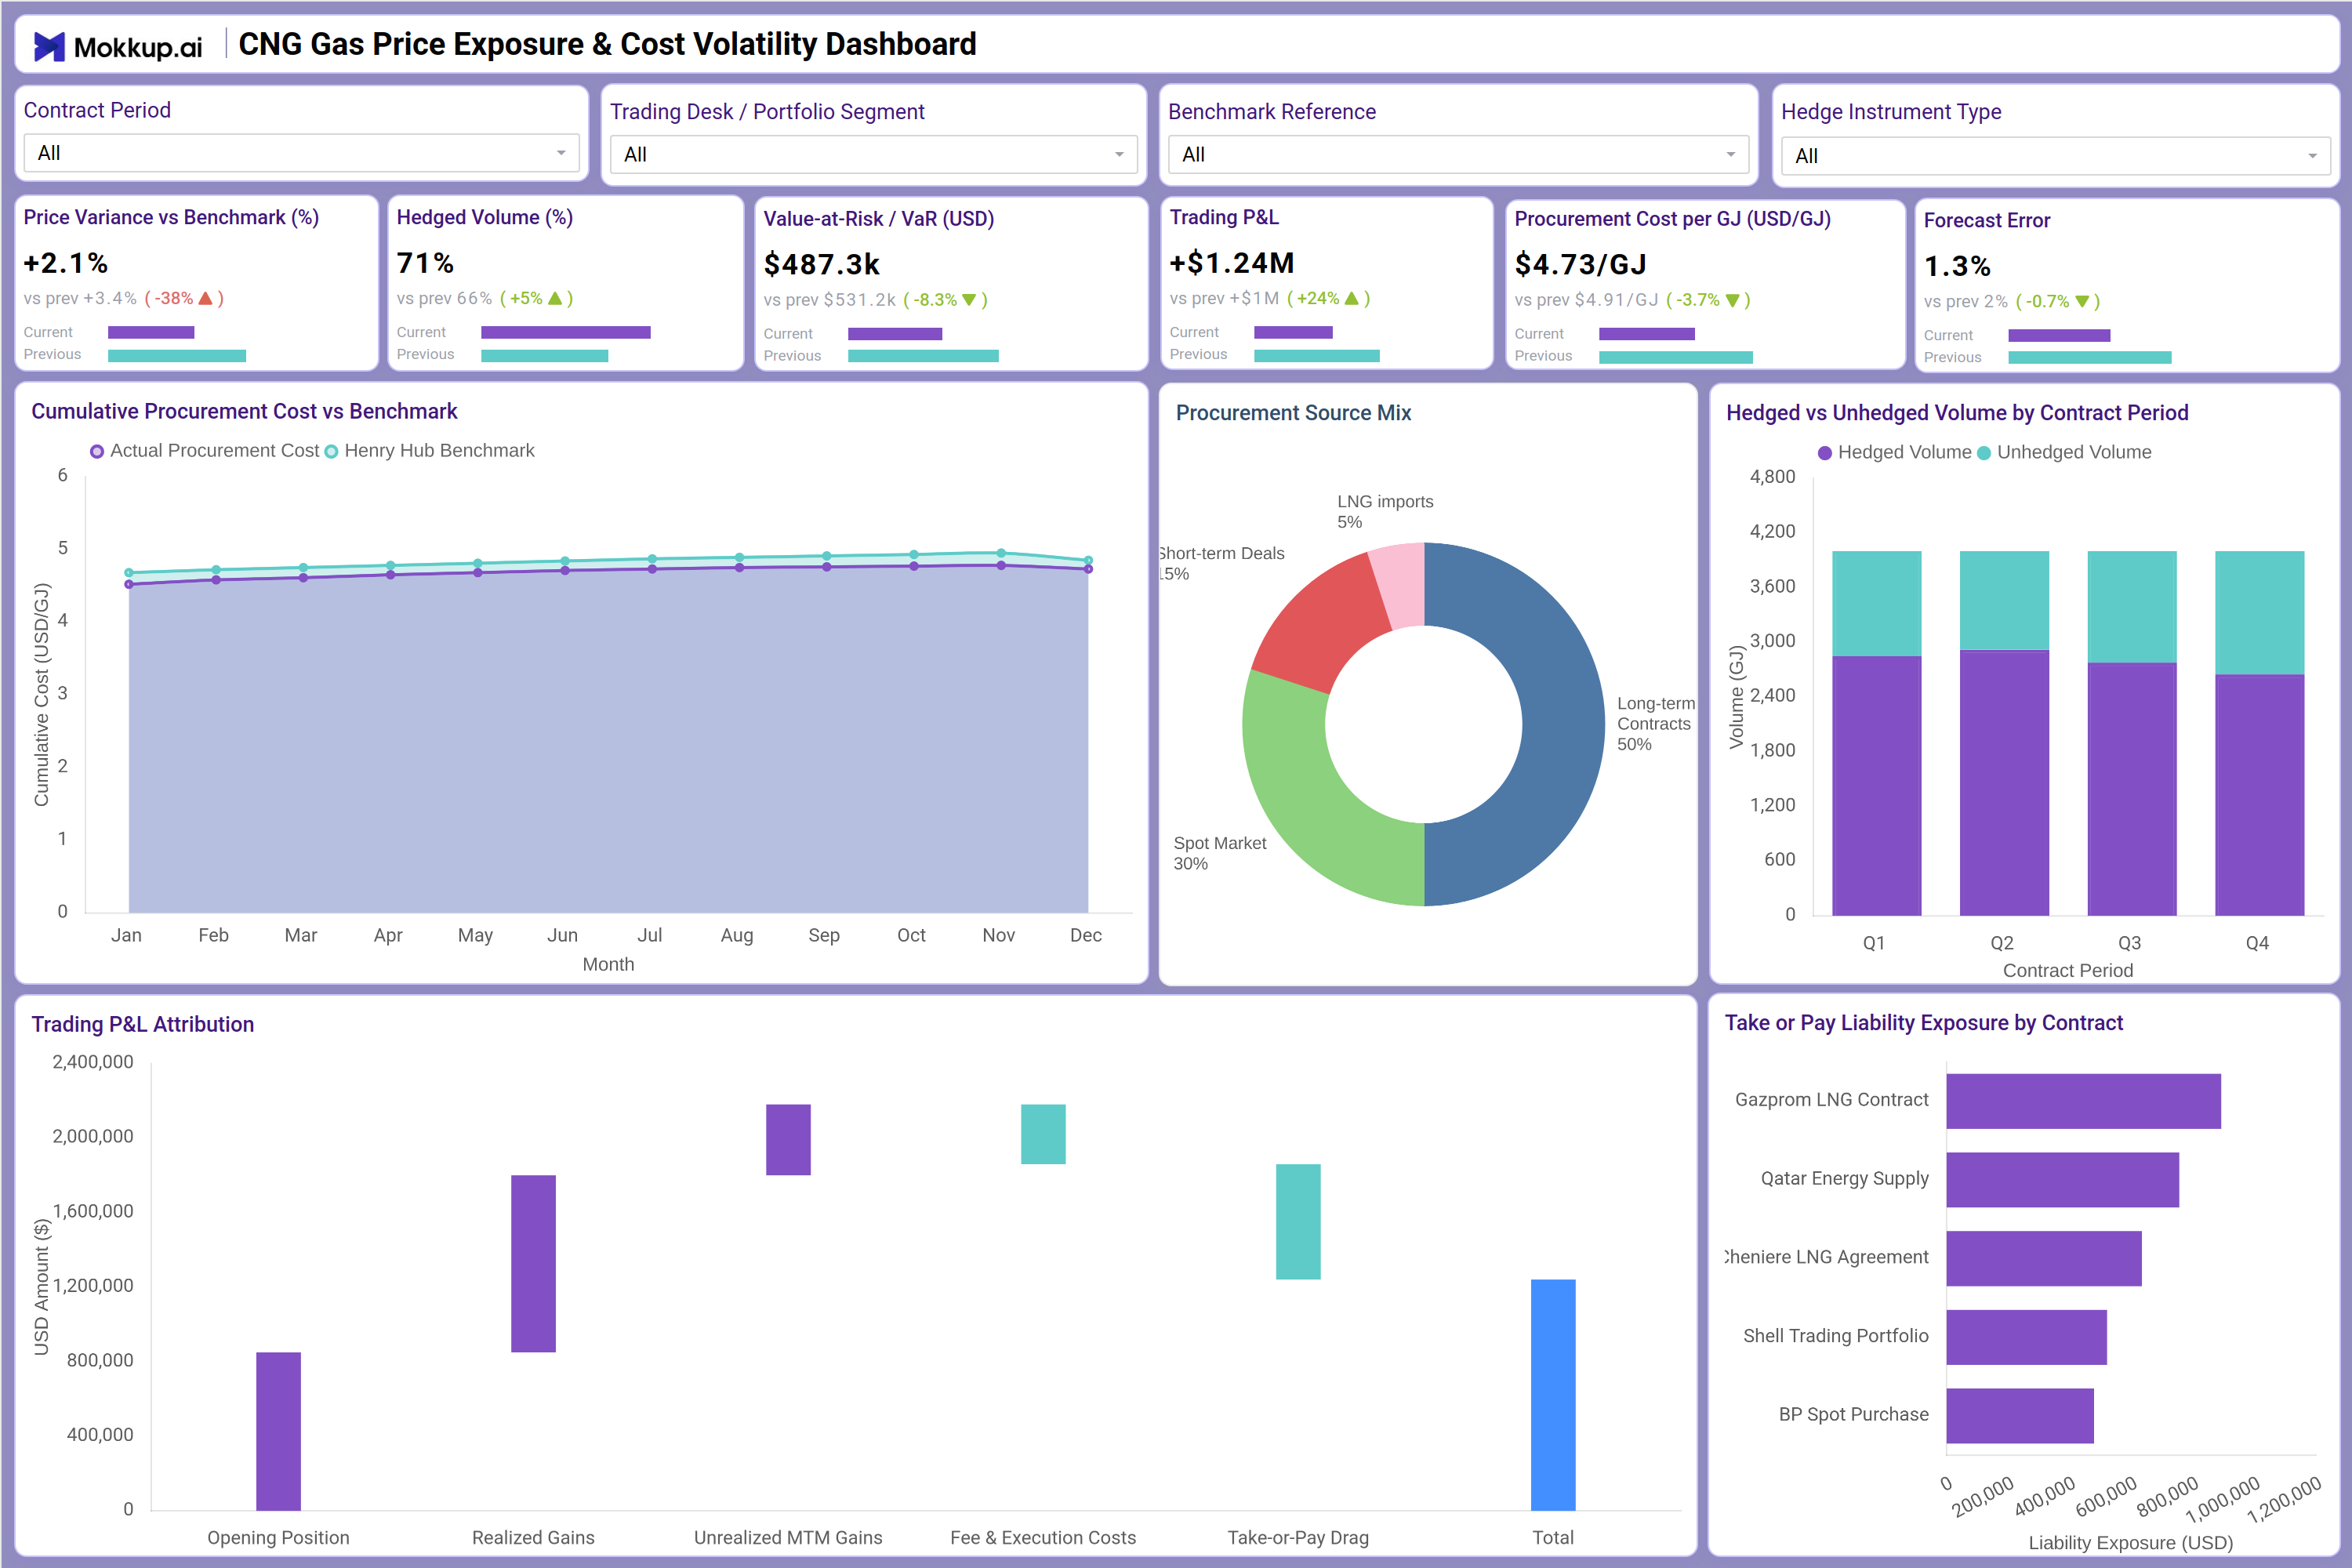
The CNG Gas Price Exposure & Cost Volatility Dashboard is a structured analytical tool built for energy traders, procurement managers, and portfolio analysts who need to monitor compressed natural gas price movements and procurement cost performance against market benchmarks. This CNG gas price exposure dashboard consolidates six critical KPIs - including Price Variance vs Benchmark, Hedged Volume, Value-at-Risk, Trading P&L, Procurement Cost per GJ, and Forecast Error - into a single, filterable view.
It tracks procurement source diversification across long-term contracts, spot market purchases, short-term deals, and LNG imports, while providing contract-level take-or-pay liability visibility. As a procurement cost benchmark comparison dashboard, it enables energy teams to detect cost deviations early, optimize hedging strategies, and align procurement decisions with market conditions across contract periods and trading desk segments.
How to Create a CNG Gas Price Exposure & Cost Volatility Dashboard
You don’t need to build your report from scratch, just start with a ready-to-use CNG Gas Price Exposure & Cost Volatility dashboard template from Mokkup. Add in your data and export it however you like. Here’s how to do it:
1. Create or Log in to Your Mokkup Account
Start by signing up on Mokkup.ai using your email. If you already have an account, just log in, and you'll be good to go.
2. Choose and Customize Your Dashboard Template
Find the CNG Gas Price Exposure & Cost Volatility Dashboard template in the Templates section. Use the drag-and-drop editor to adjust KPIs, edit filters, or add elements based on your data.
3. Export to Your BI Tool
Once your dashboard wireframe is ready, use the BI Tool Export feature to send it directly to Power BI or Tableau for further analysis and enhancements. You can also download the dashboard as a PDF, PNG, or JPEG, embed it on a platform, or invite your team to collaborate.
Note: This is a Pro template. You'll need a Pro subscription on Mokkup to use and customize this dashboard wireframe. Upgrade anytime to unlock full access.
CNG Gas Price Exposure & Cost Volatility Dashboard Example
A gas procurement analyst opens this dashboard at the start of each trading week to understand whether their portfolio is exposed to adverse price movements and whether hedging coverage is sufficient across active contract periods. The KPI row immediately surfaces whether current procurement costs are running above or below the Henry Hub benchmark and how much of the volume is covered under hedged positions, giving the team a fast read on risk posture before drilling deeper. As the analyst moves into the cumulative procurement cost vs benchmark chart, they can track month-by-month cost trajectory and identify periods where actual spend diverged from benchmark pricing. This cost volatility tracking for CNG procurement helps teams pinpoint which months saw the greatest exposure and whether take-or-pay drag or execution costs contributed to that divergence. The procurement source mix donut chart then shows how reliant the portfolio is on spot market purchases versus long-term contracts, informing decisions about rebalancing supply sources.
For risk and P&L review, trading managers use the Trading P&L Attribution waterfall breakdown to assess how opening positions, realized gains, unrealized MTM movements, and fee and execution costs combined into the total P&L outcome. The hedged vs unhedged volume analysis by contract period stacked bar chart reveals where hedging gaps exist across Q1 through Q4, allowing the desk to take corrective action before contract windows close. The take-or-pay liability exposure chart gives contract managers a ranked view of counterparty exposure across named contracts. Across all these views, the dashboard enables trading desks and procurement teams to manage CNG price risk with precision, reduce forecast error, and keep total procurement costs aligned with strategy rather than reacting to market swings after the fact.
How to Analyze Data in a CNG Gas Price Exposure & Cost Volatility Dashboard
Here is how you can analyze data from this dashboard:
- Filter by Contract Period: Isolate performance metrics for specific contract windows.
- Compare Portfolio Segments: Analyze cost and P&L performance across trading desks.
- Track Benchmark Variance: Monitor procurement costs against Henry Hub pricing.
- Review Cost Trends: Use cumulative procurement cost trends to identify early deviations.
- Assess Procurement Mix: Analyze source mix to detect overdependence on spot or short-term markets.
- Evaluate Hedging Coverage: Compare hedged vs unhedged volumes to identify risk gaps.
- Analyze P&L Drivers: Review attribution charts to separate execution costs from MTM gains.
- Prioritize Contract Risks: Use liability exposure charts to identify contracts needing renegotiation.
- Compare Hedge Instruments: Filter by hedge type to assess effectiveness in reducing volatility.
- Measure Forecast Accuracy: Track forecast error to improve procurement planning.
Benefits of a CNG Gas Price Exposure & Cost Volatility Dashboard
The following are the benefits of using this dashboard:
- Centralized Risk Visibility: Combines price exposure, hedging, and procurement cost data in one dashboard.
- Comprehensive Volatility Tracking: Monitors procurement risk across multiple sourcing channels.
- Reduced Manual Reconciliation: Prebuilt P&L attribution charts simplify reporting.
- Contract-Level Risk Insights: Highlights take-or-pay liabilities for proactive mitigation.
- Better Hedging Analysis: Provides quarterly hedged vs unhedged volume comparisons.
- Improved Cost Control: Detects benchmark deviations before they significantly impact costs.
- Shared Portfolio Visibility: Aligns procurement teams and trading desks around risk and performance metrics.
KPIs to Track in a CNG Gas Price Exposure & Cost Volatility Dashboard
The following key KPIs can be tracked by using this dashboard:
- Price Variance vs Benchmark (%): A core metric in any CNG gas price exposure dashboard - measures how much actual procurement cost deviates from the Henry Hub benchmark, signaling over- or under-spend.
- Hedged Volume (%): Tracks the proportion of total CNG volume covered by hedge instruments - critical for assessing risk coverage and guiding hedging strategy adjustments.
- Value-at-Risk / VaR (USD): Quantifies the maximum potential loss in the portfolio under adverse market conditions - essential for value-at-risk CNG portfolio dashboard reporting and risk limit compliance.
- Trading P&L (USD): Measures the net profit or loss generated by trading activity - used to evaluate desk performance and validate the impact of procurement decisions.
- Procurement Cost per GJ (USD/GJ): Tracks the average cost of procuring one gigajoule of CNG across all sources - the primary efficiency metric in any procurement cost benchmark comparison dashboard.
- Forecast Error (%): Measures the accuracy of procurement volume and price forecasts - lower values indicate tighter planning alignment and reduced exposure to unplanned costs.
Frequently Asked Questions
Q1. Who is this CNG Gas Price Exposure & Cost Volatility Dashboard designed for?
This dashboard is built for energy traders, gas procurement managers, and portfolio risk analysts who need to monitor CNG price exposure, hedging effectiveness, and procurement cost performance. It is also useful for contract managers tracking take-or-pay liabilities across multiple counterparties.
Q2. Can this dashboard track procurement performance across different supply sources?
Yes. The Procurement Source Mix donut chart breaks down volume across long-term contracts, spot market purchases, short-term deals, and LNG imports, enabling teams to assess source diversification and identify over-reliance on any single channel.
Q3. How does the Trading P&L Attribution chart work?
The Trading P&L Attribution chart uses a waterfall layout to decompose the total P&L outcome into its components: opening position, realized gains, unrealized MTM gains, fee and execution costs, and take-or-pay drag. This makes it straightforward to identify which factors drove overall trading P&L attribution in natural gas portfolio management.