
What is a Hydrogen Blend Gas Safety & Leak Risk Dashboard?
A hydrogen gas safety & leak risk dashboard is a specialized analytics platform designed for natural gas utilities to monitor, assess, and mitigate risks associated with hydrogen natural gas blends. This hydrogen gas pipeline safety monitoring dashboard integrates data from sensors, pipeline inspections, and incident reports to provide a view of safety performance. It tracks hydrogen embrittlement risk tracking for gas utilities, leak detection efficiency, and compliance with safety regulations. By consolidating hydrogen gas infrastructure risk assessment tools, the dashboard helps utilities identify high-risk pipeline segments, predict potential failures, and optimize maintenance schedules. It also supports safety compliance for hydrogen natural gas blends by ensuring adherence to industry standards and regulatory requirements. With interactive filters for region, pipeline material, and defect type, utility operators can drill down into specific risk factors and take proactive measures to prevent accidents.
How to Create a Hydrogen Blend Gas Safety & Leak Risk Dashboard
You don’t need to build your report from scratch; just start with a ready-to-use dashboard template from Mokkup. Add in your data and export it however you like. Here’s how to do it:
1. Create or Log in to Your Mokkup Account
Start by signing up on Mokkup.ai using your email. If you already have an account, just log in, and you’ll be good to go.
2. Choose and Customize Your Dashboard Template
Find the Hydrogen Blend Gas Safety & Leak Risk Dashboard template in the Templates section. Use the drag and drop editor to adjust KPIs, edit filters, or add elements based on your data.
3. Export to Your BI Tool
Once your dashboard wireframe is ready, use the BI Tool Export feature to send it directly to Power BI or Tableau for further analysis and enhancements. You can also download the dashboard as a PDF, PNG, or JPEG, embed it on a platform, or invite your team to collaborate.
Note: This is a Pro template. You’ll need a Pro subscription on Mokkup to use and customize this dashboard wireframe. Upgrade anytime to unlock full access.
Hydrogen Blend Gas Safety & Leak Risk Dashboard Example
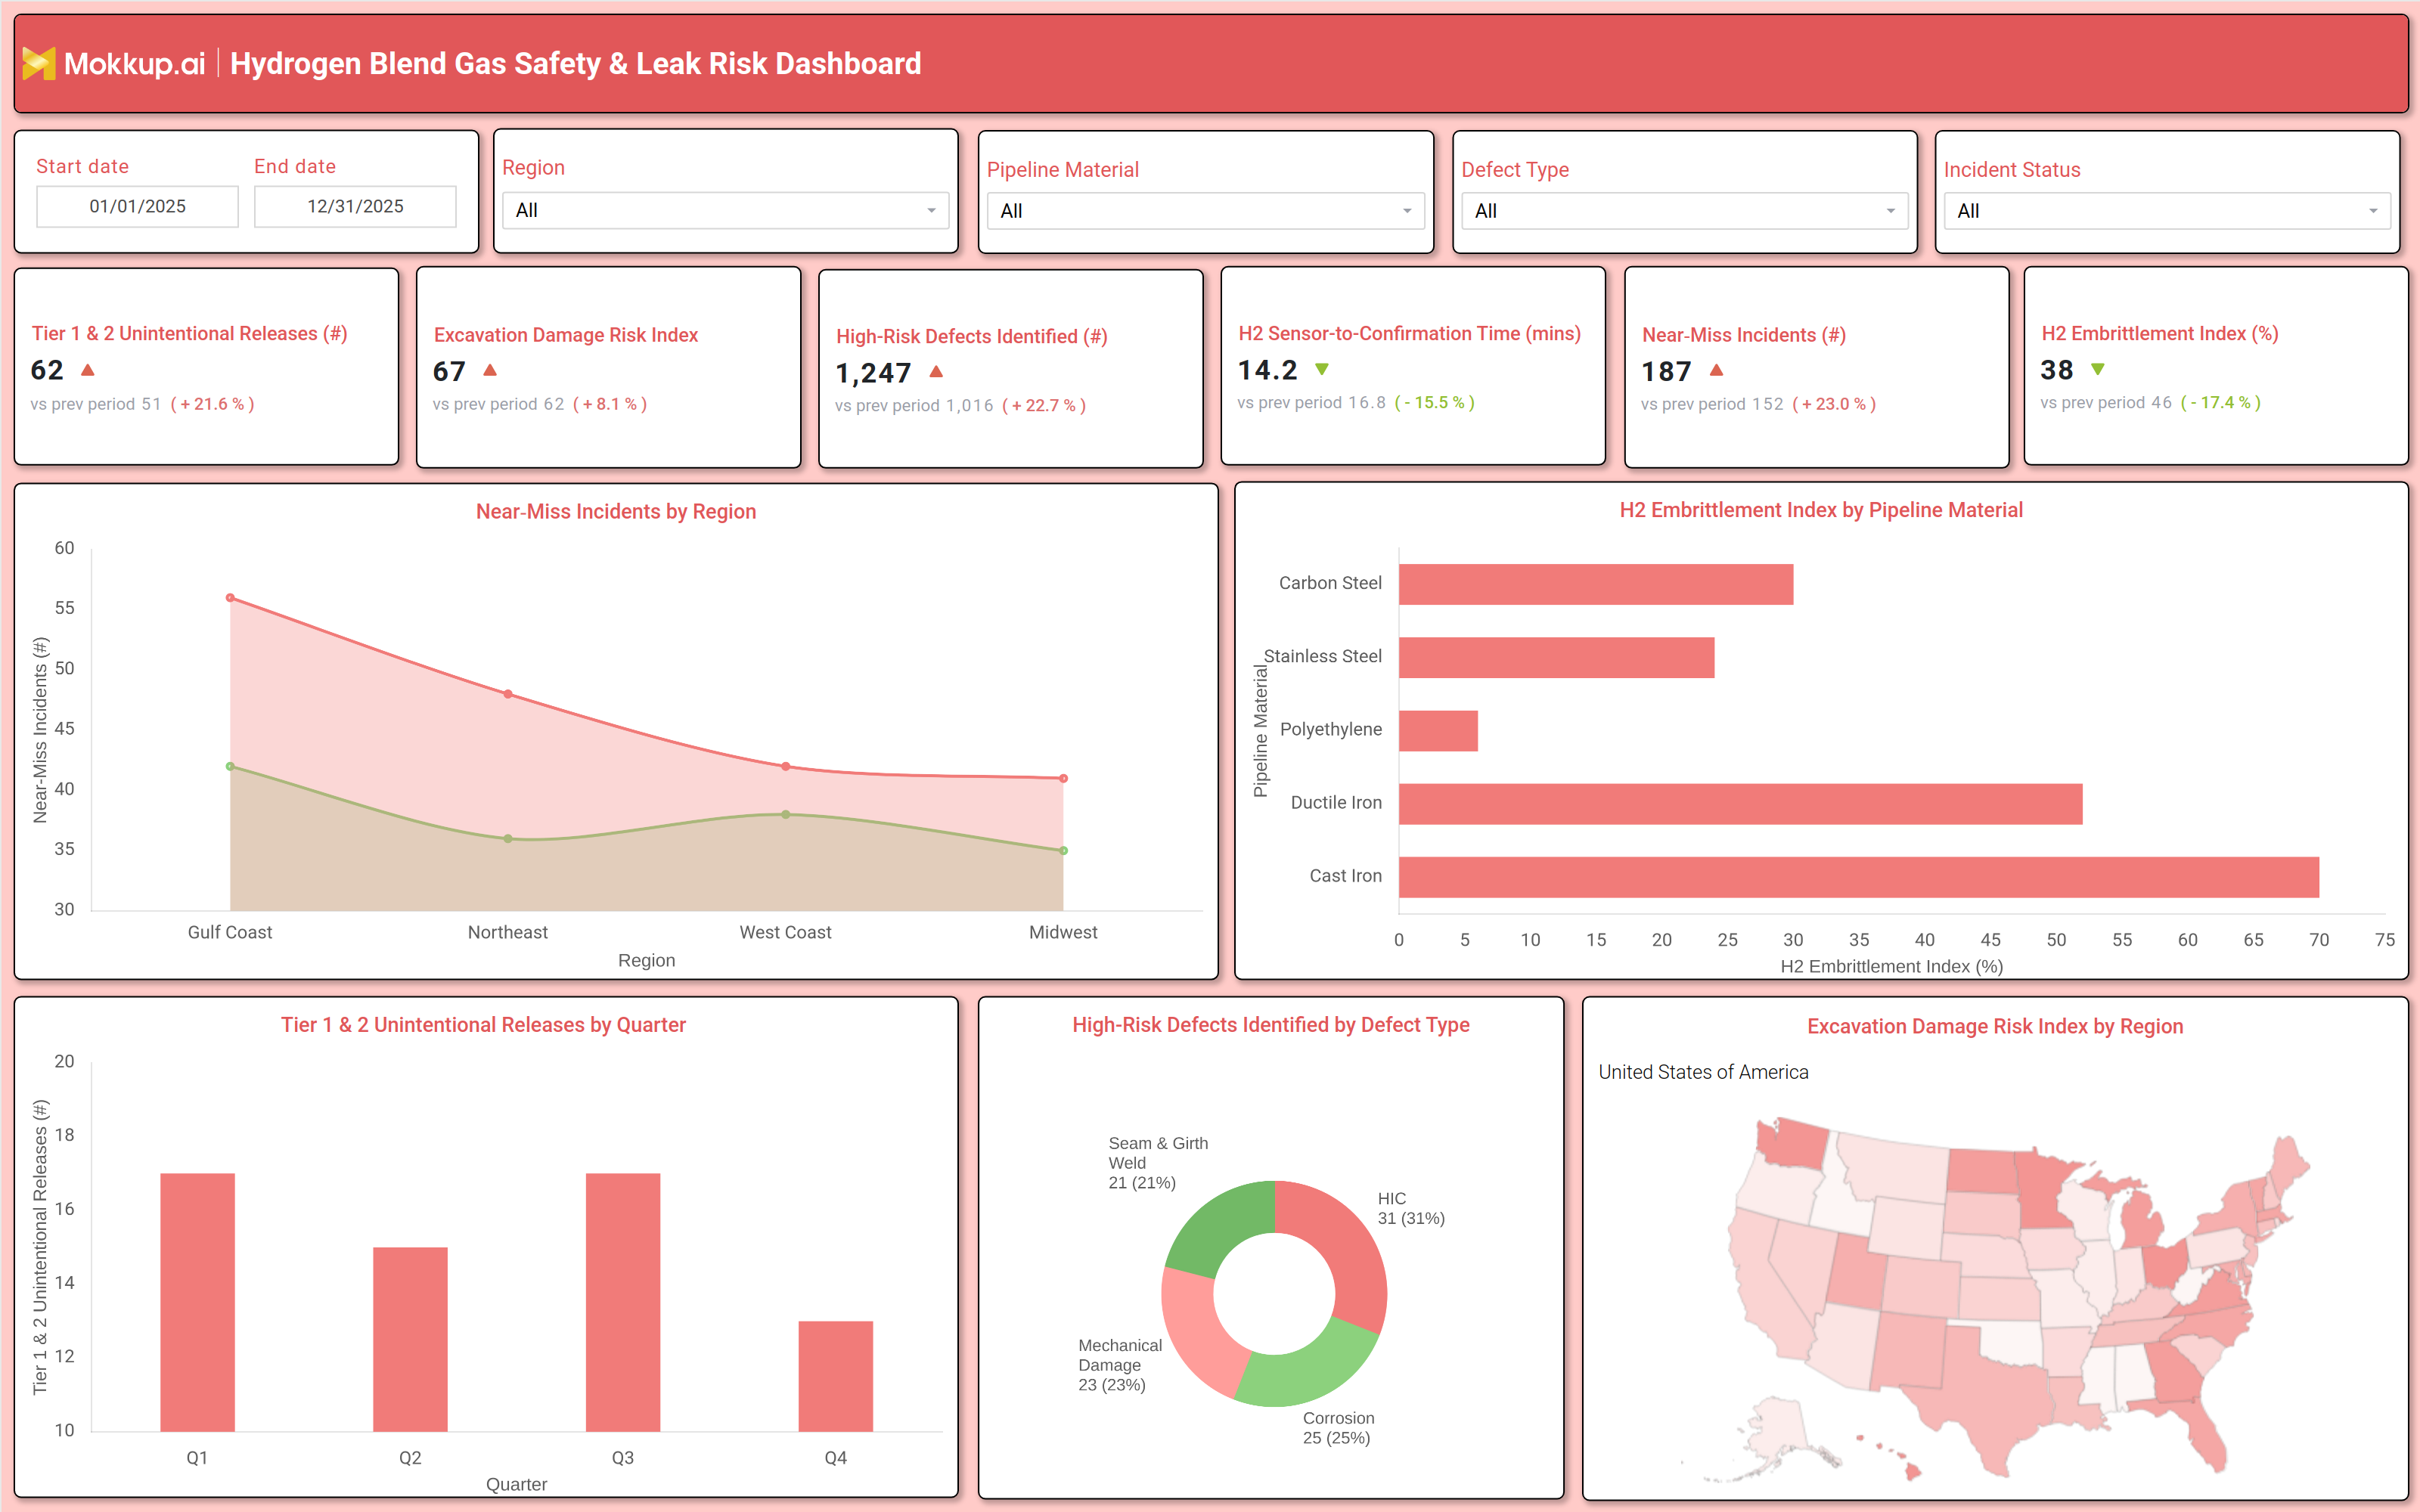
A typical hydrogen blend gas leak prevention and alert system includes key performance indicators (KPIs) such as Tier 1 & 2 unintentional releases, excavation damage risk index, high-risk defects identified, and hydrogen embrittlement index. The dashboard features trend charts comparing near-miss incidents by region, a breakdown of high-risk defects by type (e.g., corrosion, mechanical damage), and a geographic heatmap of excavation damage risks across service territories.
Interactive filters allow users to adjust the view by date range, pipeline material (e.g., carbon steel, polyethylene), defect type, and incident status. A hydrogen embrittlement index by pipeline material highlights which materials are most vulnerable to hydrogen-induced cracking, helping utilities prioritize inspections and replacements. The dashboard also tracks H₂ sensor confirmation time, ensuring rapid response to potential leaks. Together, these components form a gas utility hydrogen blend safety management software that enables data-driven decision-making for safer hydrogen gas distribution.
How to Analyze Data in a Hydrogen Blend Gas Safety & Leak Risk Dashboard
Here is how you can analyze data from this hydrogen blend gas infrastructure safety assessment dashboard:
- Monitor Tier 1 & 2 unintentional releases to assess the frequency and severity of leaks, comparing current performance against historical trends.
- Track excavation damage risk index to identify regions with high construction-related pipeline threats and implement preventive measures.
- Review high-risk defects identified to prioritize maintenance for corrosion, mechanical damage, and seam/girth weld failures.
- Analyze H₂ sensor confirmation time to evaluate leak detection efficiency and reduce response delays.
- Compare near-miss incidents by region to detect patterns and allocate safety resources effectively.
- Assess the hydrogen embrittlement index of pipeline materials to determine which materials require closer monitoring or replacement.
- Evaluate incident status trends to ensure timely resolution of reported defects and leaks.
Benefits of a Hydrogen Blend Gas Safety & Leak Risk Dashboard
The following are the benefits of using this natural gas utility hydrogen safety analytics dashboard:
- Enhances pipeline safety by providing early warnings for leaks and structural weaknesses in hydrogen gas infrastructure.
- Reduces operational risks through proactive monitoring of hydrogen embrittlement and excavation damage.
- Improves regulatory compliance by tracking safety metrics and ensuring adherence to hydrogen gas standards.
- Optimizes maintenance schedules by identifying high risk pipeline segments and defect types.
- Supports data driven decisionmaking with actionable insights on leak detection, incident response, and risk mitigation.
- Increases transparency for stakeholders by visualizing safety performance across regions and pipeline materials.
- Lowers long term costs by preventing major leaks, equipment failures, and regulatory fines.
KPIs to Track in a Hydrogen Blend Gas Safety & Leak Risk Dashboard
The following key KPIs can be tracked by using this hydrogen blend gas pipeline safety monitoring dashboard:
- Tier 1 & 2 Unintentional Releases (#): Measures the number of significant gas leaks, indicating pipeline integrity and safety performance.
- Excavation Damage Risk Index: Assesses the likelihood of pipeline damage due to construction activities, helping utilities prioritize preventive measures.
- High Risk Defects Identified (#): Tracks the number of critical pipeline defects (e.g., corrosion, mechanical damage) that require immediate attention.
- H₂ Sensor to Confirmation Time (mins): Evaluates the efficiency of leak detection systems by measuring the time between sensor alerts and incident confirmation.
- Near Miss Incidents (#): Counts closecall events that could have led to leaks or accidents, highlighting areas for safety improvements.
- Hydrogen Embrittlement Index (%): Quantifies the risk of pipeline material degradation due to hydrogen exposure, guiding material selection and maintenance strategies.
Frequently Asked Questions
1. What is a hydrogen gas safety dashboard used for?
A hydrogen gas safety dashboard monitors pipeline integrity, leak risks, and compliance for natural gas utilities blending hydrogen. It helps prevent accidents by tracking defects, embrittlement risks, and incident response times.
2. What data sources feed into a pipeline integrity monitoring dashboard for hydrogen utilities?
Key data sources include pipeline inspection reports, H₂ sensor readings, incident logs, excavation activity records, and material specifications.
3. Who should use a hydrogen gas safety & leak risk dashboard?
Utility operators, safety managers, pipeline engineers, and regulatory compliance teams use this Gas Distribution Hydrogen Safety Compliance Monitoring Dashboard to monitor risks and ensure safe hydrogen gas distribution.