What is a Hydroelectric Power Plant Safety Monitoring Dashboard?
A Hydroelectric Power Plant Safety Monitoring Dashboard is a centralized digital platform designed to track, analyze, and improve safety performance across hydroelectric facilities. It consolidates operational safety data related to incidents, near misses, work permits, hazard identification, emergency preparedness, and compliance metrics into a single, real-time view. By enabling continuous monitoring of hydroelectric facility safety, the dashboard supports safety managers, plant operators, maintenance teams, and leadership in identifying risks early and enforcing preventive controls.
This hydroelectric safety monitoring dashboard functions as a core hydro plant safety system, providing visibility into workforce safety, contractor compliance, permit-to-work adherence, and emergency readiness. It plays a crucial role in reducing lost-time injuries, enhancing hazard mitigation effectiveness, and ensuring compliance with internal safety standards and regulatory frameworks. The dashboard also supports long-term hydropower plant safety analytics by tracking trends and root causes of incidents across departments and locations.
How to Create aHydroelectric Power Plant Safety Monitoring Dashboard
You don’t need to build your report from scratch, just start with a ready-to-use dashboard template from Mokkup. Add in your data and export it however you like. Here’s how to do it:
1. Create or Log in to Your Mokkup Account
Start by signing up on Mokkup.ai using your email. If you already have an account, just log in, and you’ll be good to go.
2. Choose and Customize Your Dashboard Template
Find the Hydroelectric Power Plant Safety Monitoring Dashboard template in the Templates section. Use the drag-and-drop editor to adjust KPIs, edit filters, or add elements based on your data.
3. Export to Your BI Tool
Once your dashboard wireframe is ready, use the BI Tool Export feature to send it directly to Power BI or Tableau for further analysis and enhancements. You can also download the dashboard as a PDF, PNG, or JPEG, embed it on a platform, or invite your team to collaborate.
Note: This is a Pro template. You’ll need a Pro subscription on Mokkup to use and customize this dashboard wireframe. Upgrade anytime to unlock full access.
Hydroelectric Power Plant Safety Monitoring Dashboard Example
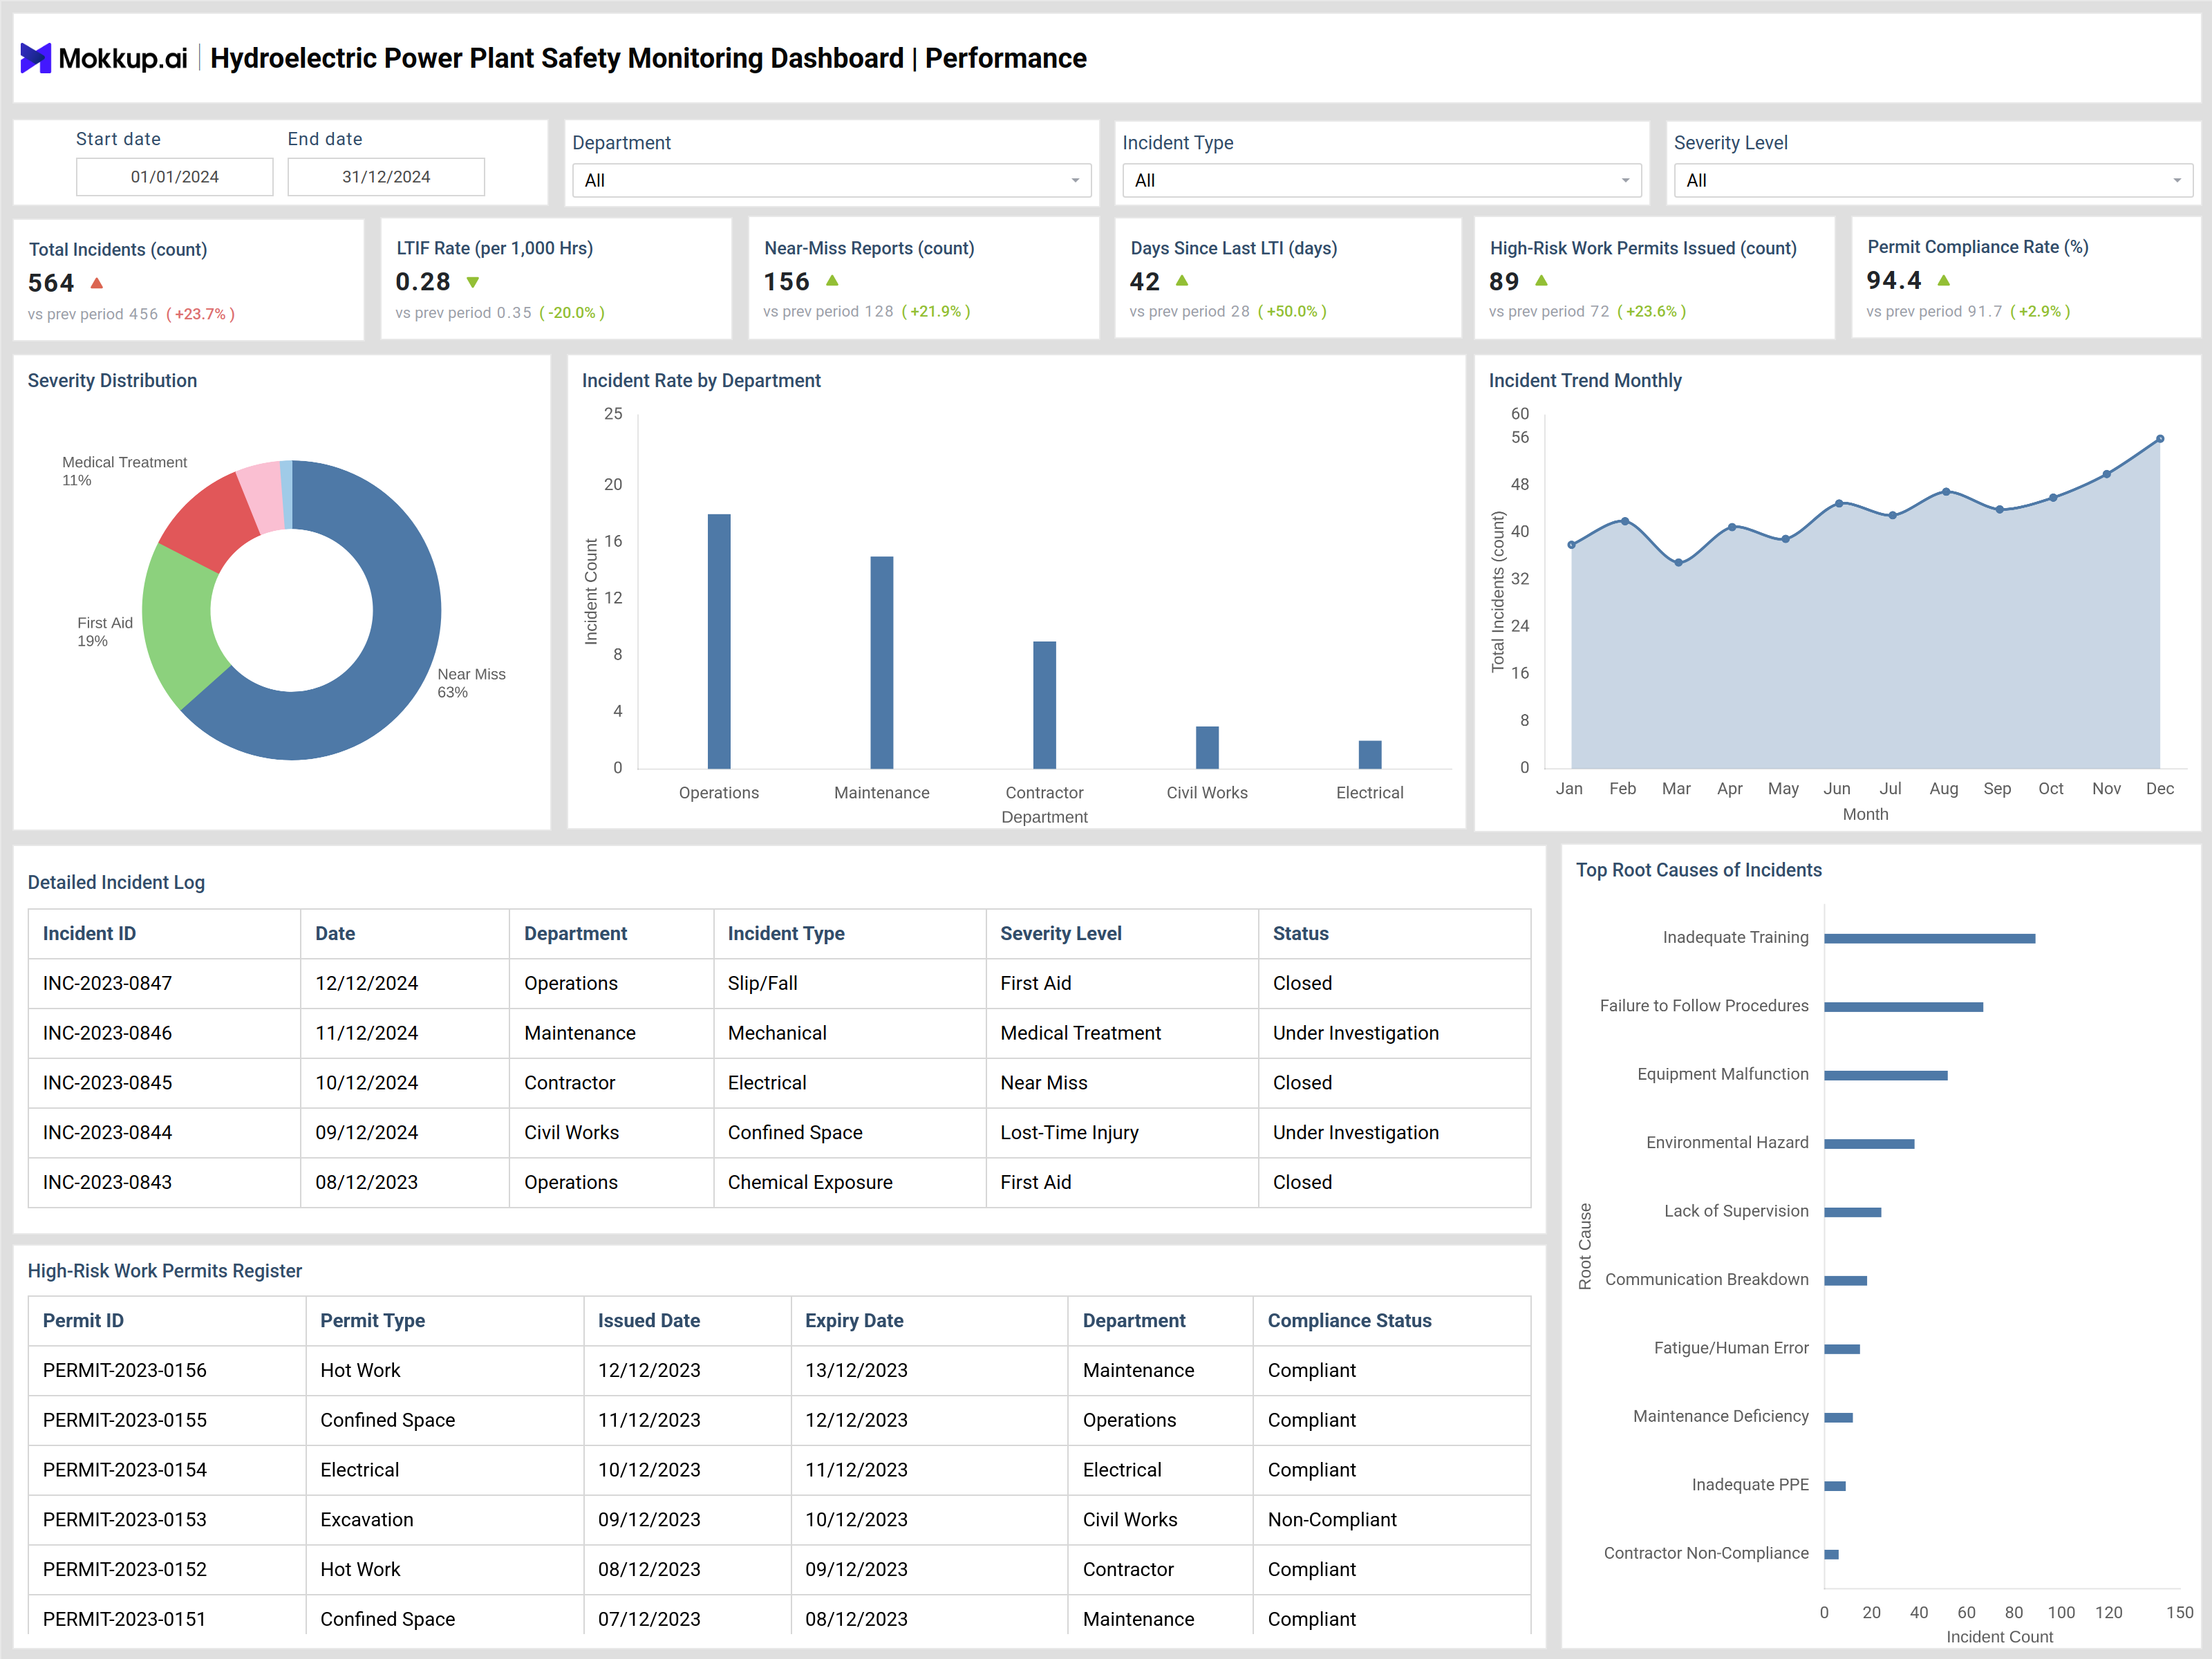
You can build a hydroelectric operational safety dashboard using the modules shown in the reference images to cover both workplace safety performance and emergency readiness in one integrated system. The dashboard typically opens with high-level KPIs such as total incidents, lost-time injury frequency rate (LTIFR), near-miss reports, days since last LTI, high-risk work permits issued, and permit compliance rate. These indicators provide an immediate snapshot of the overall hydro power plant safety status. The safety performance section visualizes incident severity distribution, incident trends by month, and incident rates by department, such as operations, maintenance, contractors, and civil works. Detailed incident logs capture incident type, severity level, investigation status, and closure progress, supporting structured safety reviews.
Root cause analysis charts highlight systemic issues such as inadequate training, procedural gaps, or equipment malfunctions. The emergency readiness view extends safety oversight by tracking hazards identified, hazard mitigation closure rates, critical risks open, permit-to-work violations, PPE compliance, and safety training completion. Visualizations such as hazard category breakdowns, permit compliance trends, and active hazard registers support proactive hydroelectric plant safety monitoring and emergency preparedness planning across all facility zones.
How to Analyze a Hydroelectric Power Plant Safety Monitoring Dashboard
Here is how you can analyze data from this dashboard:
- Review total incidents and LTIFR trends to evaluate overall safety performance and injury risk exposure.
- Monitor near-miss reports to identify early warning signs before incidents escalate.
- Analyze incident trends by department to detect high-risk operational areas.
- Track days since last LTI to assess safety culture consistency over time.
- Evaluate permit compliance rates to ensure safe execution of high-risk activities.
- Review hazard identification and closure trends to verify the effectiveness of mitigation actions.
- Analyze hazard categories to prioritize engineering or procedural controls.
- Monitor PPE compliance and safety training completion to confirm workforce readiness.
- Use detailed incident and hazard logs to support audits and corrective action tracking.
Benefits of Hydroelectric Power Plant Safety Monitoring Dashboard
The following are the benefits of using this dashboard:
- Provides real-time visibility into plant-wide safety performance.
- Reduces workplace accidents through early risk identification.
- Improves compliance with safety regulations and internal standards.
- Strengthens emergency readiness and hazard response capability.
- Enhances contractor and permit-to-work safety governance.
- Supports data-driven safety decision-making for leadership.
- Improves accountability through structured incident and hazard tracking.
- Enables continuous improvement using historical safety analytics.
KPIs to Track in Hydroelectric Power Plant Safety Monitoring Dashboard
The following key KPIs can be tracked by using the hydroelectric facility safety monitoring dashboard:
- Total Incidents (count): Measures the total number of safety-related incidents recorded in the facility.
- LTIFR (per 1,000 hours): Tracks the frequency of lost-time injuries relative to work hours.
- Near-Miss Reports (count): Indicates how many potential incidents were identified before causing harm.
- Days Since Last LTI: Shows the number of days since the most recent lost-time injury.
- High-Risk Work Permits Issued (count): Tracks permits issued for hazardous tasks such as hot work or confined space entry.
- Permit Compliance Rate: Measures adherence to permit-to-work safety requirements.
- Hazards Identified (count): Counts newly identified safety hazards across the plant.
- Hazard Mitigation Closure Rate: Tracks the percentage of hazards that have been effectively resolved.
- Critical Risk Items Open (count): Indicates unresolved high-risk safety issues requiring immediate attention.
- PPE Compliance Rate: Measures workforce adherence to personal protective equipment requirements.
- Safety Training Completion: Tracks completion of mandatory safety training programs.
- Permit-to-Work Violations (count): Counts deviations from approved work permit conditions.
Frequently Asked Questions
1. Why is a safety monitoring dashboard important for hydroelectric plants?
It enables continuous hydroelectric plant safety monitoring, helping plants reduce accidents, manage hazards, and maintain compliance.
2. Who uses a hydroelectric safety monitoring dashboard?
Safety managers, plant operators, maintenance teams, contractors, and senior leadership.
3. Does the dashboard support emergency preparedness?
Yes, it tracks hazard identification, mitigation progress, PPE compliance, and training readiness.
4. Can this dashboard improve contractor safety performance?
Yes, it provides visibility into contractor incidents, permit compliance, and training status.
5. Is the dashboard useful for audits and inspections?
Yes, it centralizes safety records, incident logs, and compliance metrics for audit readiness.