What is a Hydrogen Blend Gas Pipeline & Asset Compatibility Dashboard?
The Hydrogen Blend Gas Pipeline & Asset Compatibility Dashboard is a structured template designed for pipeline operators, asset integrity engineers, and energy transition teams managing the shift to hydrogen-blended gas networks. This hydrogen blend gas pipeline compatibility dashboard consolidates key operational metrics, including material compatibility rates, embrittlement risk scores, inspection compliance, and retrofitting progress across regional infrastructure in a single view. It helps teams identify which pipeline segments face the greatest material risk under increasing hydrogen concentrations, enabling data-driven decisions before failures occur. By tracking high-risk asset exposure gas pipeline monitoring metrics alongside compliance and mitigation data, utilities can prioritize capital allocation and regulatory reporting with confidence.
How to Create a Hydrogen Blend Gas Pipeline & Asset Compatibility Dashboard
You don’t need to build your report from scratch; just start with a ready-to-use dashboard template from Mokkup. Add in your data and export it however you like. Here’s how to do it:
1. Create or Log in to Your Mokkup Account
Start by signing up on Mokkup.ai using your email. If you already have an account, just log in, and you'll be good to go.
2. Choose and Customize Your Dashboard Template
Find the Hydrogen Blend Gas Pipeline & Asset Compatibility Dashboard template in the Templates section. Use the drag-and-drop editor to adjust KPIs, edit filters, or add elements based on your data.
3. Export to Your BI Tool
Once your dashboard wireframe is ready, use the BI Tool Export feature to send it directly to Power BI or Tableau for further analysis and enhancements. You can also download the dashboard as a PDF, PNG, or JPEG, embed it on a platform, or invite your team to collaborate.
Note: This is a Pro template. You'll need a Pro subscription on Mokkup to use and customize this dashboard wireframe. Upgrade anytime to unlock full access.
Hydrogen Blend Gas Pipeline & Asset Compatibility Dashboard Example
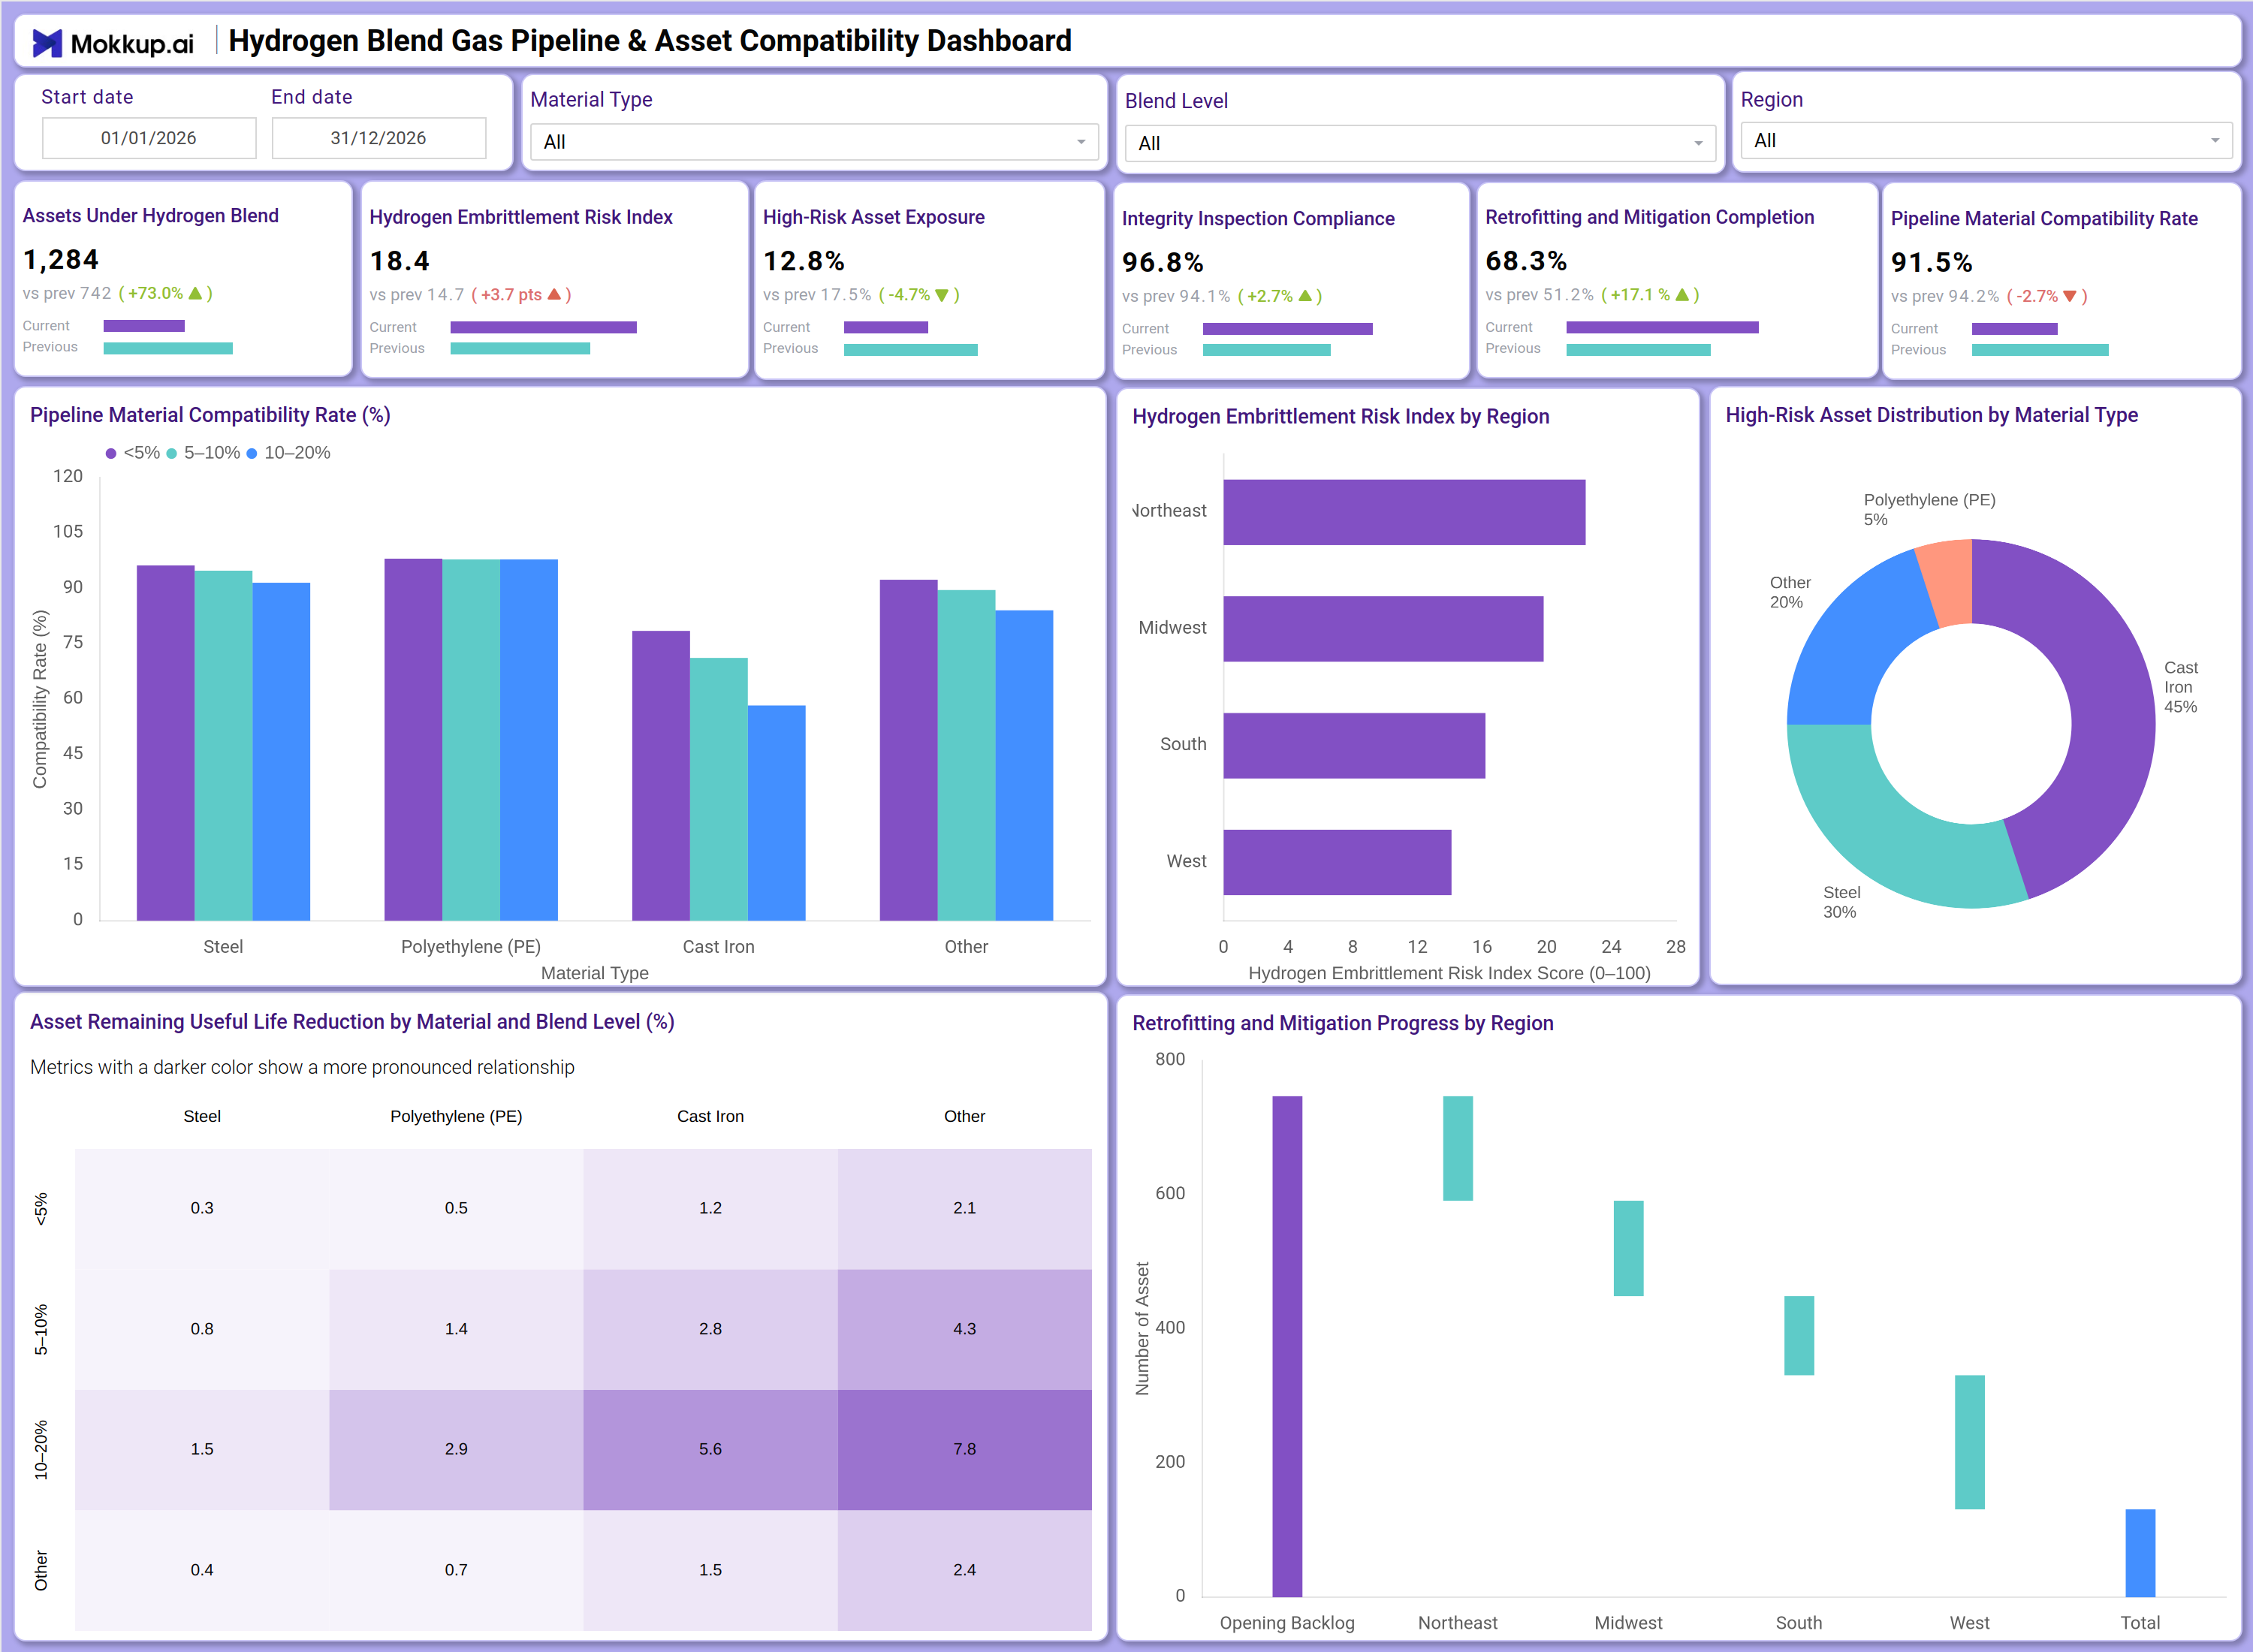
An asset integrity team reviewing a hydrogen blending rollout opens this dashboard to understand where material risk is accumulating across their pipeline network. Before committing to a regional expansion of blend levels, the team checks pipeline material compatibility rate tracking data to determine whether Steel, Polyethylene (PE), Cast Iron, or other materials in active service can withstand higher hydrogen concentrations without accelerated degradation. On the main screen, managers review the hydrogen embrittlement risk index by region to see whether the Northeast, Midwest, South, or West is approaching critical thresholds. The regional breakdown allows regional leads to focus remediation efforts where embrittlement scores are highest rather than applying a one-size-fits-all response across all geographies.
In the heatmap section, planners use asset remaining useful life reduction hydrogen blend data segmented by material type and blend level to estimate how rapidly useful life is being eroded at each blend concentration. This guides decisions on when to schedule inspections, accelerate replacements, or pause blend increases in vulnerable pipeline segments. The retrofitting and mitigation progress pipeline assets chart gives leadership a clear view of how the backlog is being cleared across each region. When combined with inspection compliance rates, teams can determine whether the current pace of remediation is sufficient to stay ahead of emerging risk before blend levels are raised further.
How to Analyze Data in a Hydrogen Blend Gas Pipeline & Asset Compatibility Dashboard
Here is how you can analyze data from this dashboard:
- Use the Material Type filter to isolate compatibility and risk data for Steel, Polyethylene (PE), Cast Iron, or Other pipeline segments.
- Use the Blend Level filter to compare asset performance metrics under different hydrogen concentration bands (<5%, 5-10%, 10-20%).
- Use the Region filter to narrow analysis to Northeast, Midwest, South, or West and identify the highest-risk geographic areas.
- Monitor the Hydrogen Embrittlement Risk Index by Region bar chart to determine which regions require immediate intervention.
- Analyze the Pipeline Material Compatibility Rate (%) grouped bar chart to understand which material types perform best under each blend level.
- Review the High-Risk Asset Distribution by Material Type donut chart to see the proportion of high-risk assets concentrated in Cast Iron, Steel, and other materials.
- Use the Asset Remaining Useful Life Reduction heatmap to quantify degradation rates across material-blend combinations and prioritize replacement planning.
- Track Retrofitting and Mitigation Progress by Region to assess backlog clearance pace and compare regional execution against overall targets.
Benefits of a Hydrogen Blend Gas Pipeline & Asset Compatibility Dashboard
The following are the benefits of using this dashboard:
- Centralizes hydrogen embrittlement risk, inspection compliance, and retrofitting data across all regions in one structured template.
- Supports pipeline material compatibility rate tracking across multiple material types and blend concentrations simultaneously.
- Reduces manual reporting effort for hydrogen transition audits with pre-built KPI tiles and chart layouts.
- Enables region-level analysis of asset remaining useful life reduction hydrogen blend impact to guide capital expenditure decisions.
- Provides a heatmap breakdown of useful life degradation by material and blend level for granular replacement planning.
- Helps integrity engineers and operations leads align remediation schedules with blend level expansion timelines.
- Gives field teams and executive stakeholders a shared view of retrofitting and mitigation progress pipeline assets across all regions.
KPIs to Track in a Hydrogen Blend Gas Pipeline & Asset Compatibility Dashboard
The following key KPIs can be tracked by using this dashboard:
- Assets Under Hydrogen Blend (Count): KPIs (Key Performance Indicators) such as this track the total number of pipeline assets currently operating under hydrogen-blended gas conditions, establishing the baseline scope of exposure.
- Hydrogen Embrittlement Risk Index (Score 0-100): A composite score measuring material susceptibility to hydrogen embrittlement; central to hydrogen blend gas pipeline compatibility dashboard risk assessments and intervention prioritization.
- High-Risk Asset Exposure (%): Quantifies the share of assets classified as high-risk under current blend levels, directly tied to high-risk asset exposure gas pipeline monitoring and prioritization workflows.
- Integrity Inspection Compliance (%): Measures the percentage of assets that have completed scheduled integrity inspections within the defined period, supporting regulatory compliance reporting.
- Retrofitting and Mitigation Completion (%): Tracks the share of identified high-risk assets that have undergone retrofitting or mitigation actions, a direct indicator of retrofitting and mitigation progress pipeline assets execution.
- Pipeline Material Compatibility Rate (%): Evaluates the compatibility of pipeline materials with current hydrogen blend levels; the core output of pipeline material compatibility rate tracking for operational and planning teams.
Frequently Asked Questions
1. What industries benefit most from this Hydrogen Blend Gas Pipeline & Asset Compatibility Dashboard?
Gas distribution utilities, pipeline operators, and energy transition teams benefit most. It is also relevant for asset integrity consultants and infrastructure regulators overseeing hydrogen blending programs.
2. Can this dashboard track embrittlement risk across different material types?
Yes. The Hydrogen Embrittlement Risk Index by Region chart and the Asset Remaining Useful Life Reduction heatmap both segment data by material type, so teams can compare embrittlement exposure across Steel, Polyethylene (PE), Cast Iron, and Other materials directly.
3. Is this dashboard suitable for hydrogen blend expansion planning?
Yes. The Blend Level filter and the useful life reduction heatmap allow planners to assess how increasing hydrogen concentrations affect asset degradation by material, supporting informed decisions on when and where to raise blend levels.