What is an Electric Power Retail Supplier Contract Compliance Dashboard?
The Electric Power Retail Supplier Contract Compliance Dashboard is a structured analytics template built for retail energy procurement teams, contract managers, and compliance officers who need a consolidated view of supplier contract performance. This electric power retail supplier contract compliance dashboard tracks critical metrics such as contract compliance rate, KPI energy supplier agreements, billing accuracy, violation incidents, and cost variance across all active contracts. Procurement directors and regulatory teams use it to maintain visibility over supplier obligations and identify risk exposure before it affects operations. Acting as a dedicated supplier contract compliance tracking tool, it eliminates the need to manually reconcile contract data across disconnected reporting systems.
How to Create an Electric Power Retail Supplier Contract Compliance Dashboard
You don't need to build your report from scratch, just start with a ready-to-use dashboard template from Mokkup. Add in your data and export it however you like. Here's how to do it:
1. Create or Log in to Your Mokkup Account
Start by signing up on Mokkup.ai using your email. If you already have an account, just log in, and you'll be good to go.
2. Choose and Customize Your Dashboard Template
Find the Electric Power Retail Supplier Contract Compliance Dashboard template in the Templates section. Use the drag-and-drop editor to adjust KPIs, edit filters, or add elements based on your data.
3. Export to Your BI Tool
Once your dashboard wireframe is ready, use the BI Tool Export feature to send it directly to Power BI or Tableau for further analysis and enhancements. You can also download the dashboard as a PDF, PNG, or JPEG, embed it on a platform, or invite your team to collaborate.
Note: This is a Pro template. You'll need a Pro subscription on Mokkup to use and customize this dashboard wireframe. Upgrade anytime to unlock full access.
Electric Power Retail Supplier Contract Compliance Dashboard Example
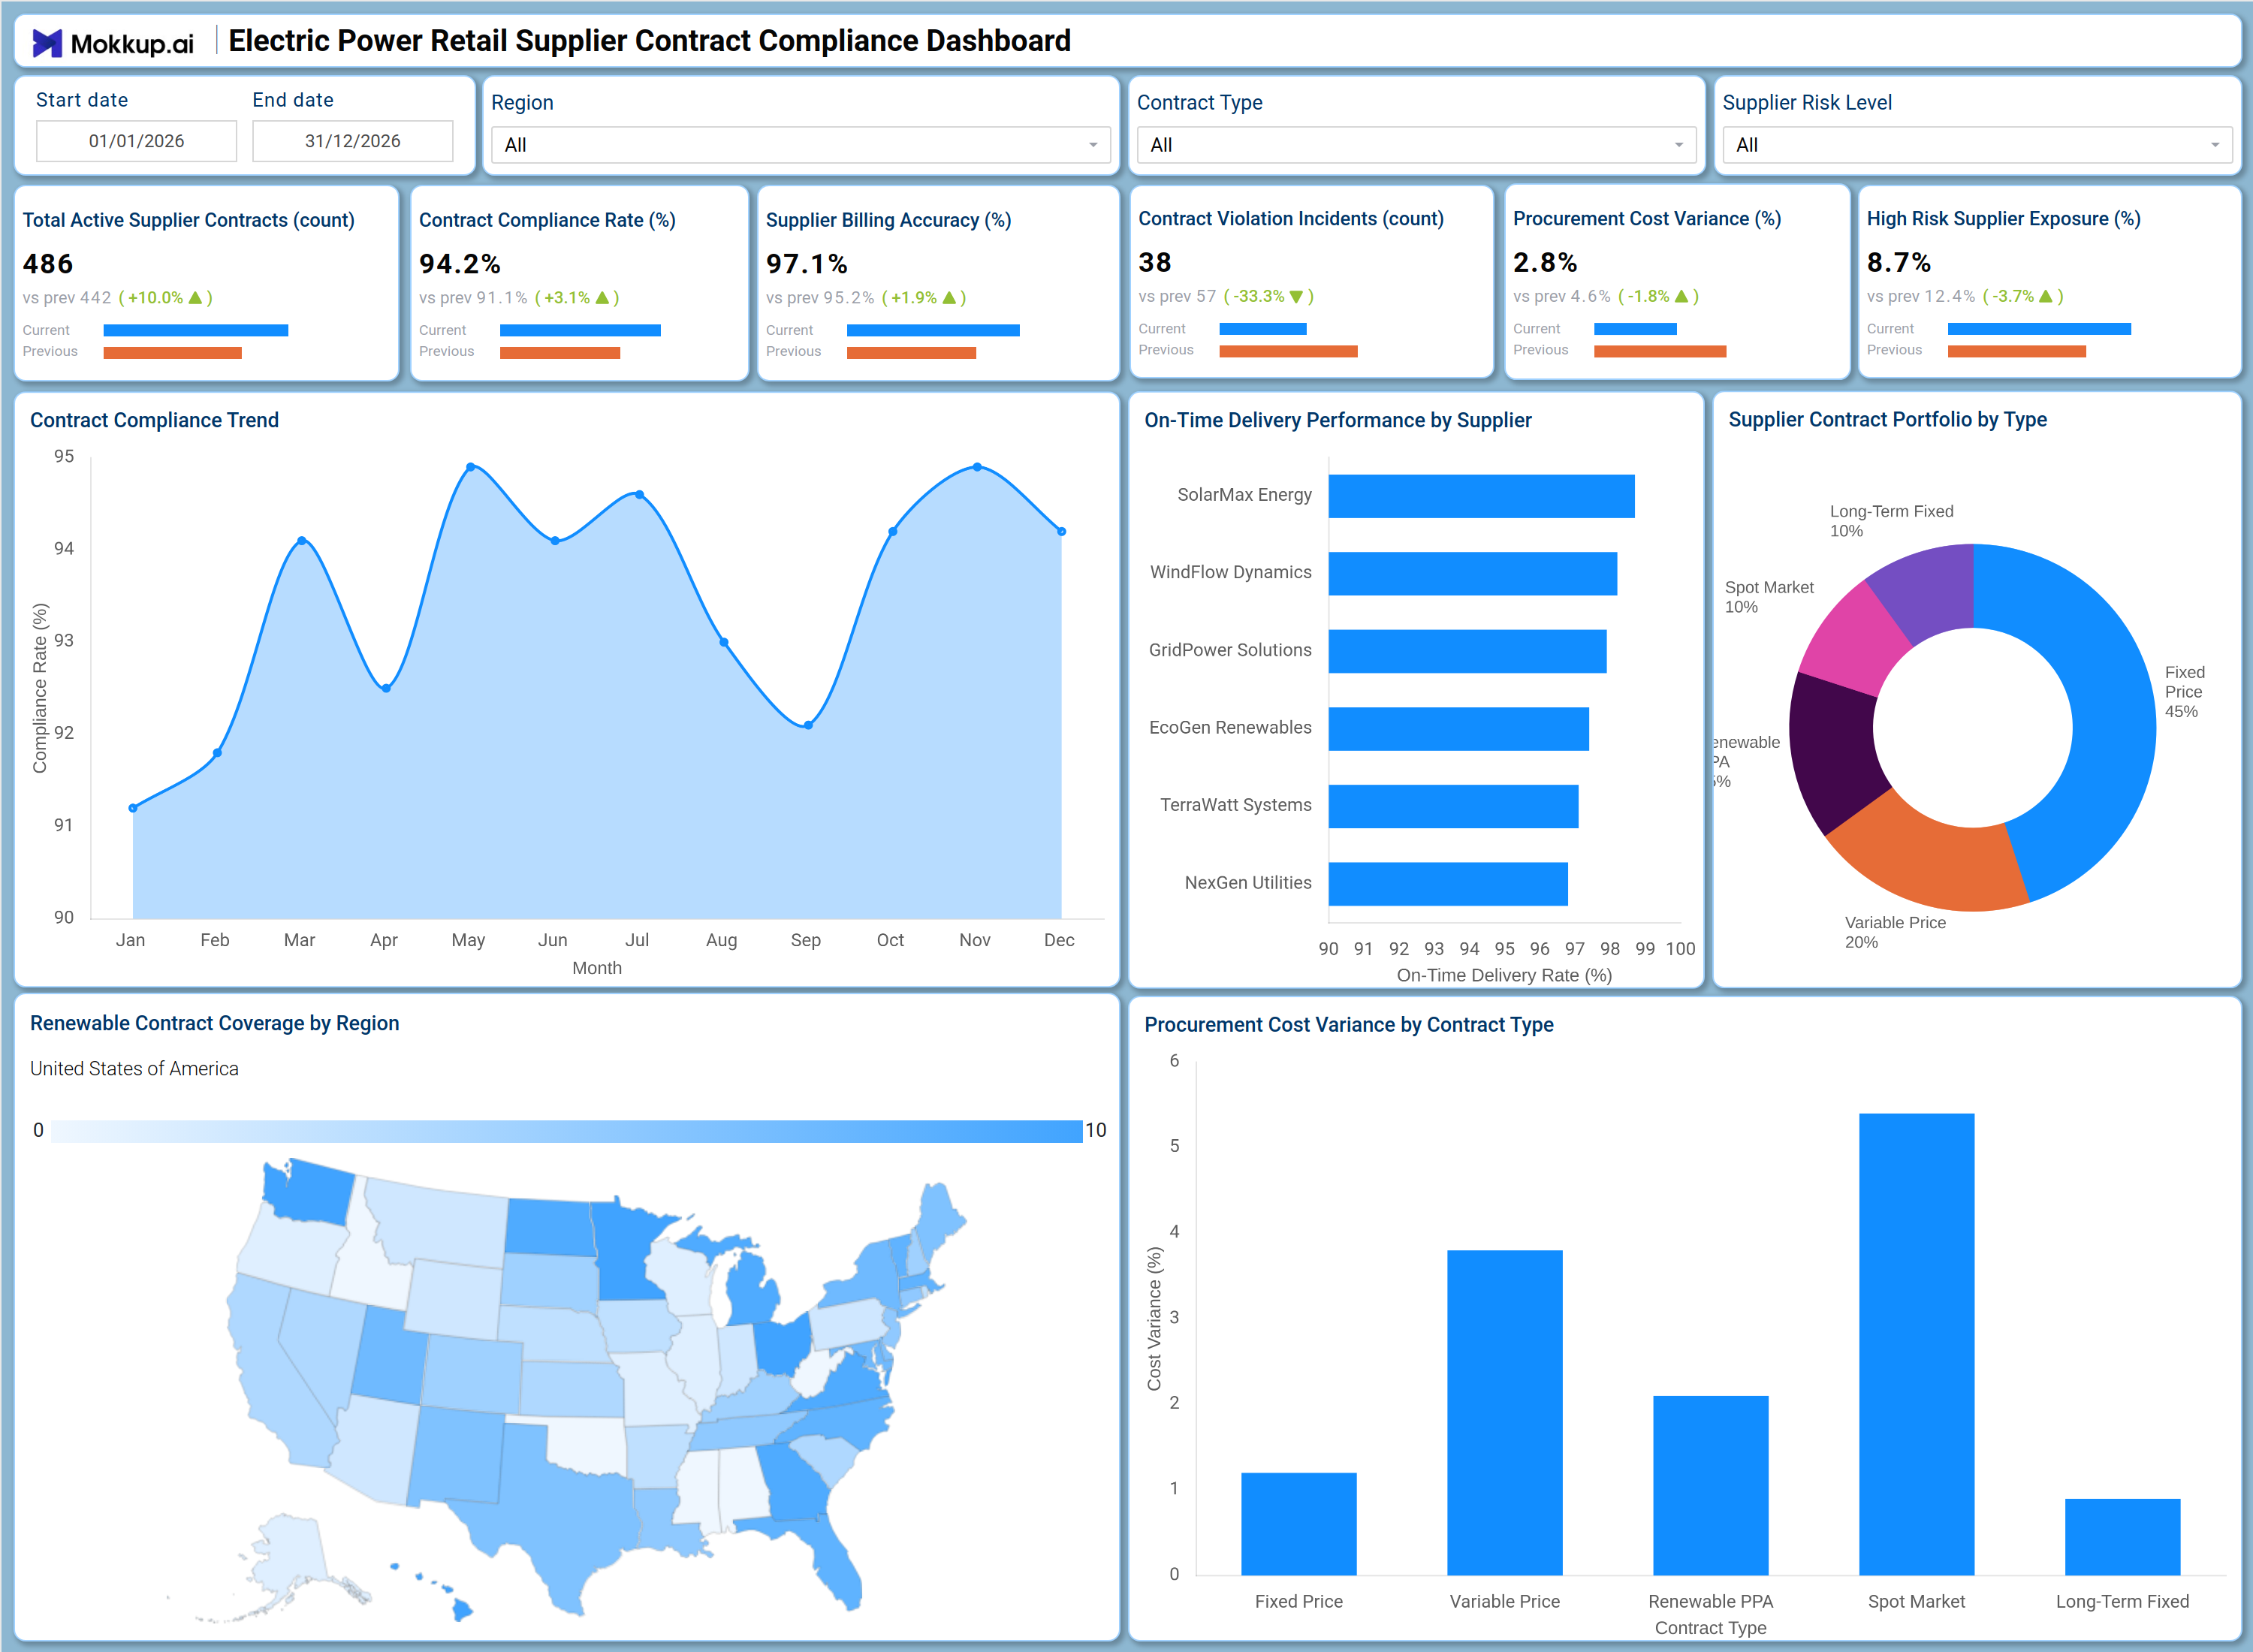
A contract compliance manager at a retail energy company opens this dashboard at the start of a review cycle to assess whether supplier agreements are performing within acceptable parameters. The KPI tiles immediately surface whether violation incidents are trending upward and how billing accuracy is holding across the supplier base. If the contract compliance trend line dips in a specific month, the manager can cross-reference the on-time delivery performance by supplier chart to identify which suppliers are underdelivering and by how much. The Procurement Cost Variance by Contract Type bar chart helps procurement leads understand where actual spend is diverging from contracted rates, making it straightforward to compare procurement cost variance by contract type across fixed-price, variable, and spot market agreements.
The Supplier Contract Portfolio by Type donut chart gives leadership a snapshot of how contract exposure is distributed, while the Renewable Contract Coverage by Region map highlights geographic concentration in renewable commitments and where regulatory targets may be at risk due to gaps in renewable contract coverage by region. Using the Supplier Risk Level and Contract Type filters, risk officers can isolate high-exposure agreements and act before renewal windows close. The electric power retail supplier contract compliance dashboard enables compliance teams to shift from reactive oversight to structured, data-driven contract management.
How to Analyze Data in an Electric Power Retail Supplier Contract Compliance Dashboard
Here is how you can analyze data from this dashboard:
- Use the Start Date and End Date filters to scope compliance analysis to specific contract review or audit periods.
- Apply the Supplier Risk Level filter to isolate high-risk supplier agreements and prioritize corrective actions.
- Monitor the Contract Compliance Trend chart to detect month-over-month drops in the contract compliance rate KPI that energy supplier teams rely on.
- Review the On-Time Delivery Performance by Supplier bar chart to identify which suppliers consistently miss contractual delivery targets.
- Analyze the Procurement Cost Variance by Contract Type bar chart to flag where actual spend deviates most from contracted terms.
- Use the Supplier Contract Portfolio by Type donut chart to assess concentration risk across fixed, variable, and spot contract structures.
- Filter by Region on the Renewable Contract Coverage map to evaluate renewable contract coverage by region and identify geographic gaps.
- Track Contract Violation Incidents alongside high-risk supplier exposure to prioritize supplier escalations and renegotiations.
Benefits of an Electric Power Retail Supplier Contract Compliance Dashboard
The following are the benefits of using this dashboard:
- Centralize the contract compliance rate KPI energy supplier data across all active agreements in one structured template.
- Supports supplier contract compliance tracking tool capabilities across fixed, variable, spot, and renewable contract structures simultaneously.
- Reduces manual data consolidation for compliance reviews with pre-built KPI tiles covering billing accuracy and violation tracking.
- Enables region-level analysis of renewable contract coverage by region to support regulatory and sustainability planning.
- Provides a donut chart breakdown of contract portfolio distribution to guide strategic contract mix and renewal decisions.
- Supports high-risk supplier exposure monitoring by surfacing the share of contract value tied to flagged suppliers.
- Gives procurement managers and contract administrators a shared view of supplier delivery and billing performance.
KPIs to Track in an Electric Power Retail Supplier Contract Compliance Dashboard
The following key KPIs can be tracked by using this dashboard:
- Total Active Supplier Contracts (count): Tracks the total number of live supplier agreements in the electric power retail supplier contract compliance dashboard, providing the base for all compliance and risk analysis.
- Contract Compliance Rate (%): The primary contract compliance rate KPI energy supplier teams use to evaluate how well suppliers are meeting their contractual obligations over time.
- Supplier Billing Accuracy (%): Measures the percentage of invoices submitted without discrepancies, critical for identifying billing disputes before they affect cash flow.
- Contract Violation Incidents (count): Quantifies documented supplier breaches, supporting procurement cost variance by contract type escalation and audit workflows.
- Procurement Cost Variance (%): Measures the deviation between contracted procurement rates and actual spend, central to cost control and supplier renegotiation decisions.
- High Risk Supplier Exposure (%): Evaluates the share of total contract value tied to flagged suppliers, directly supporting high risk supplier exposure monitoring and risk mitigation planning.
Frequently Asked Questions
1. What industries benefit most from the Electric Power Retail Supplier Contract Compliance Dashboard?
This dashboard is built for retail energy companies, power procurement teams, and contract compliance officers managing multiple supplier agreements. It is particularly valuable for organizations with mixed contract portfolios spanning fixed-price, spot market, and renewable energy contracts.
2. Can this dashboard track supplier performance across different contract types?
Yes. The On-Time Delivery Performance by Supplier chart and the Procurement Cost Variance by Contract Type bar chart allow teams to compare delivery and cost performance across fixed, variable, renewable, and spot market contracts simultaneously.
3. Is this dashboard suitable for renewable energy contract compliance reporting?
Yes. The Renewable Contract Coverage by Region map and the Supplier Contract Portfolio by Type chart give energy planners a clear view of where renewable commitments are concentrated and where coverage gaps may exist.