
What is a Hydrogen Blend Gas Network Upgrade Dashboard?
A Hydrogen Blend Gas Network Upgrade Dashboard is a specialized visualization platform designed to monitor, track, and manage the complex process of upgrading natural gas distribution networks to accommodate hydrogen blending. It consolidates critical infrastructure and project metrics including regulator compliance scores, hydrogen blend concentration, contractor performance ratings, pilot progress trends, project phase distribution, and infrastructure upgrade completion rates into a unified interface.
By integrating hydrogen blend infrastructure tracking, gas network upgrade monitoring, pilot project management, and hydrogen-ready asset inventory, this dashboard enables project managers, gas distribution engineers, hydrogen program directors, and utility leadership to oversee the safe and efficient transition of legacy gas networks toward hydrogen compatibility. It serves as a central command center for managing the technical, regulatory, and operational complexities of hydrogen blending initiatives.
How to Create a Hydrogen Blend Gas Network Upgrade Dashboard
You don’t need to build your report from scratch, just start with a ready-to-use Hydrogen Blend Gas Network Upgrade dashboard template from Mokkup. Add in your data and export it however you like. Here’s how to do it:
1. Create or Log in to Your Mokkup Account
Start by signing up on Mokkup.ai using your email. If you already have an account, just log in, and you'll be good to go.
2. Choose and Customize Your Dashboard Template
Find the Hydrogen Blend Gas Network Upgrade Dashboard template in the Templates section. Use the drag-and-drop editor to adjust KPIs, edit filters, or add elements based on your data.
3. Export to Your BI Tool
Once your dashboard wireframe is ready, use the BI Tool Export feature to send it directly to Power BI or Tableau for further analysis and enhancements. You can also download the dashboard as a PDF, PNG, or JPEG, embed it on a platform, or invite your team to collaborate. Note: This is a Pro template. You'll need a Pro subscription on Mokkup to use and customize this dashboard wireframe. Upgrade anytime to unlock full access.
Note: This is a Pro template. You’ll need a Pro subscription on Mokkup to use and customize this dashboard wireframe. Upgrade anytime to unlock full access.
Hydrogen Blend Gas Network Upgrade Dashboard Example
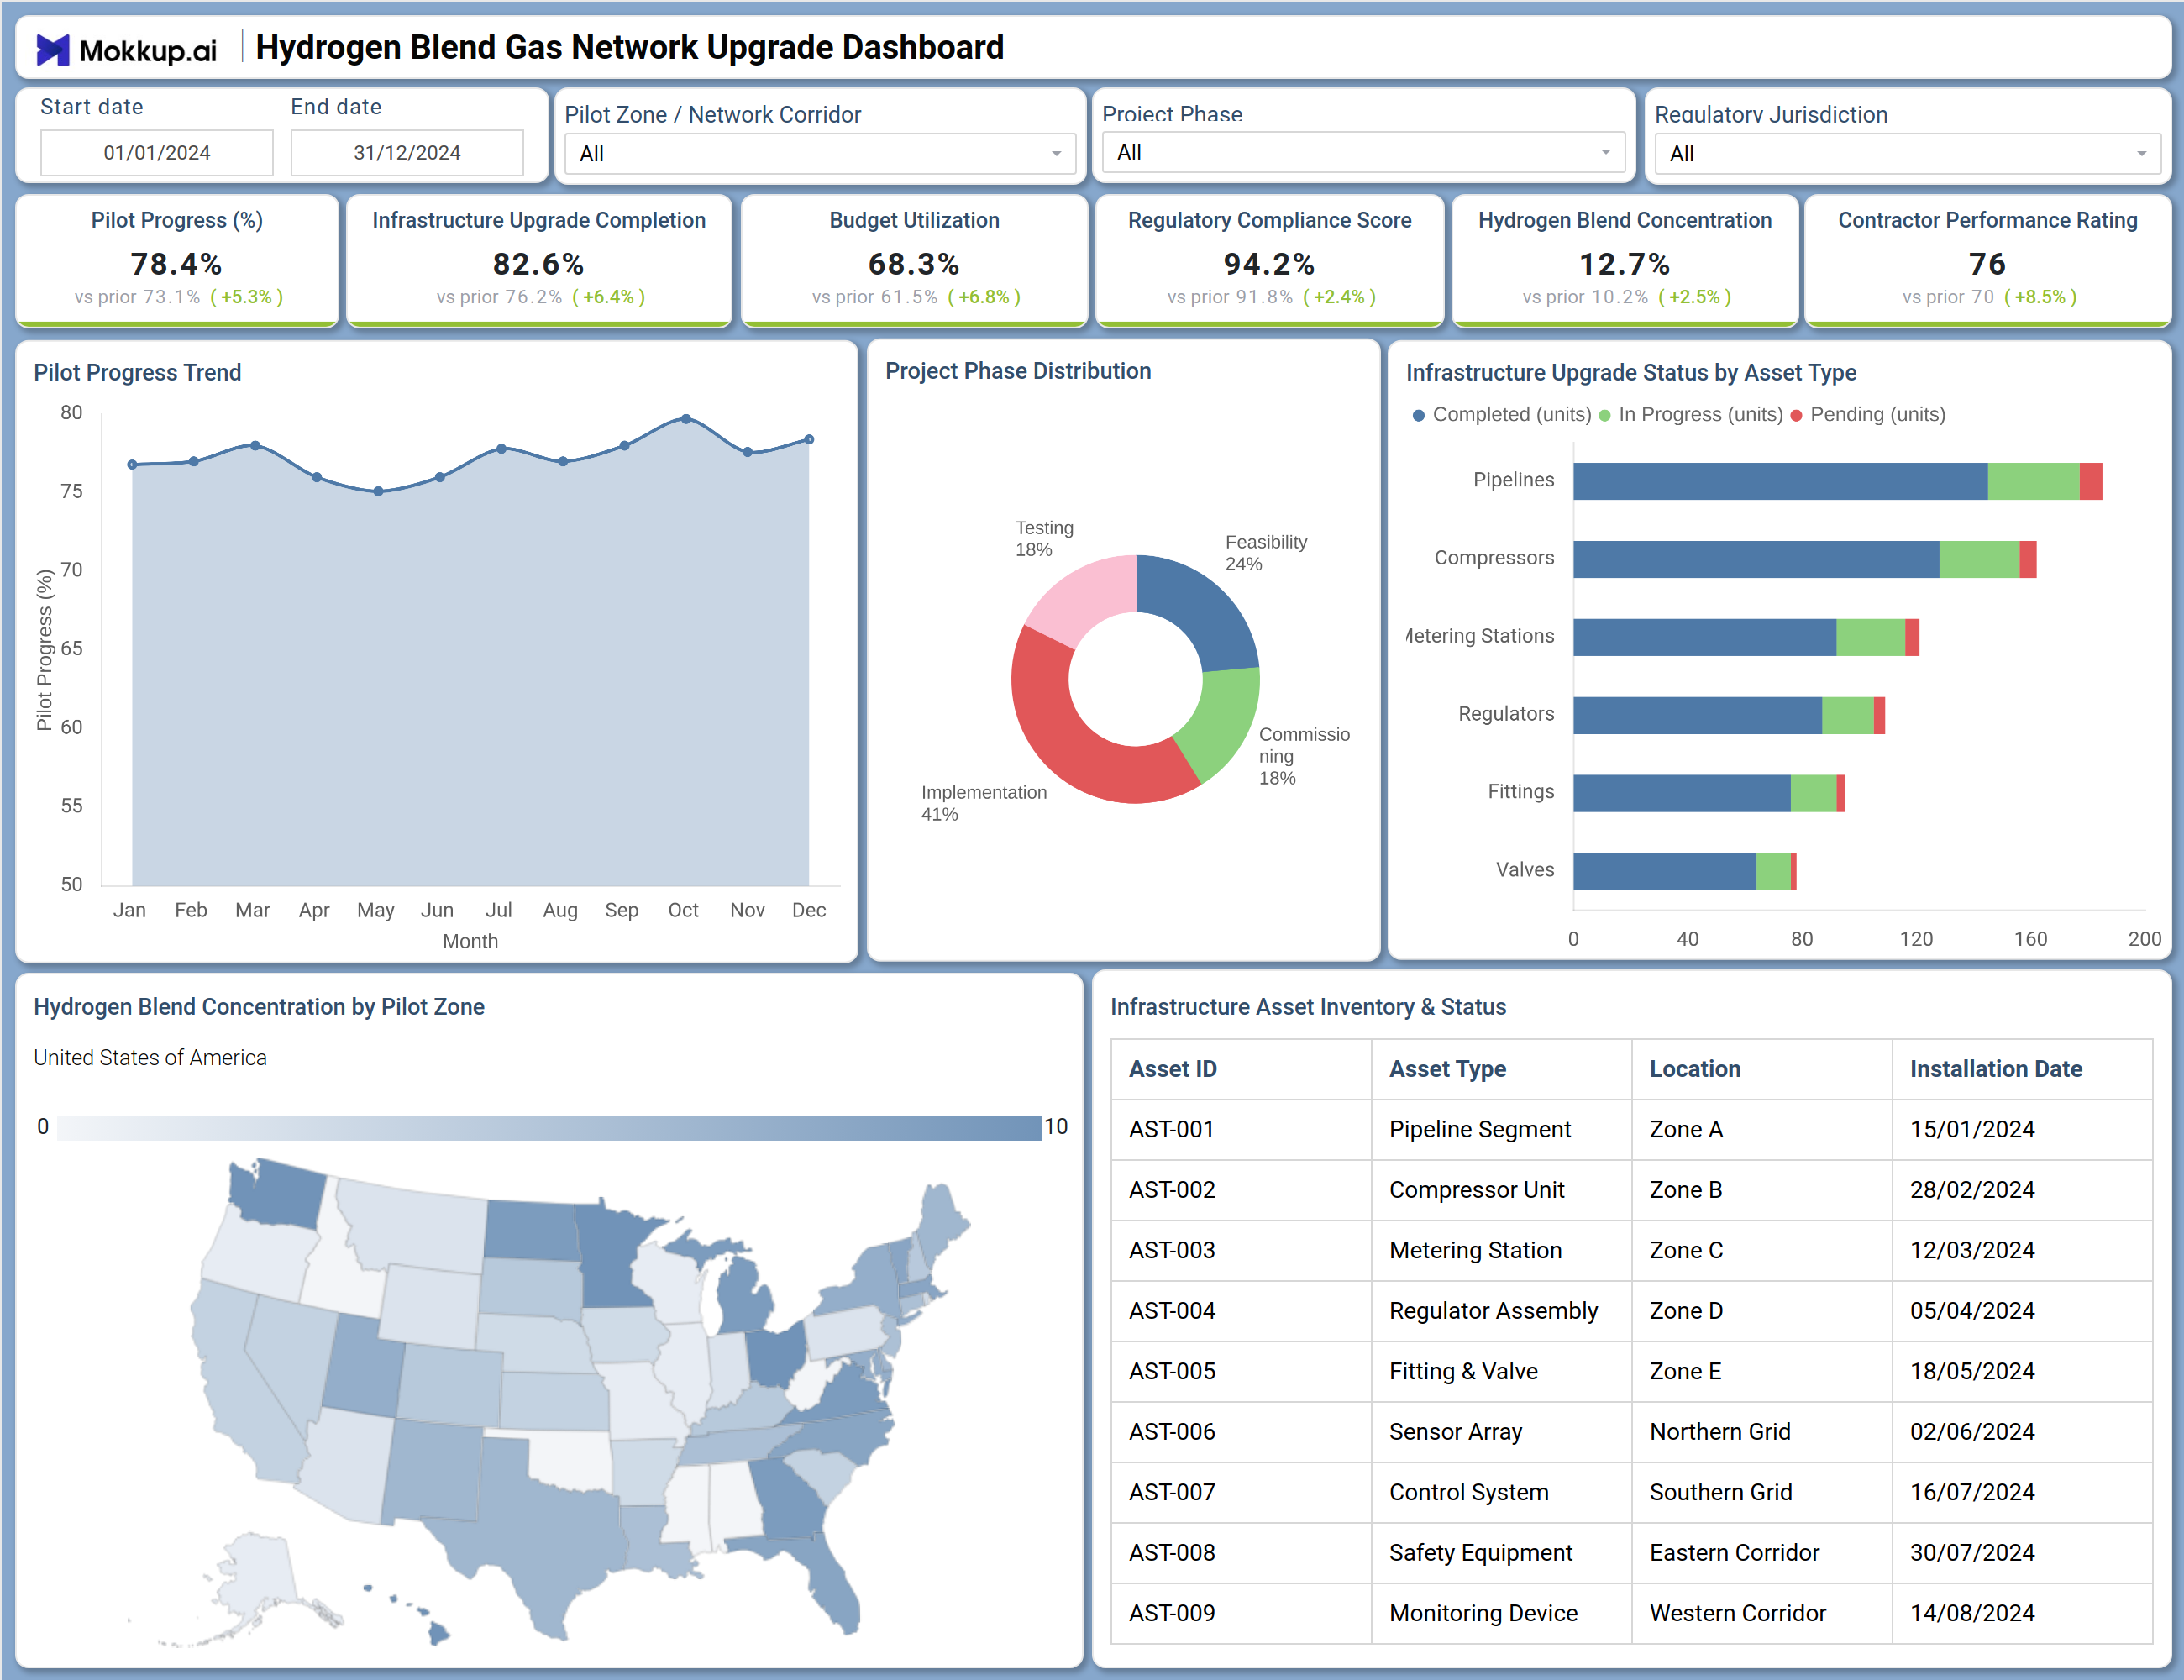
This dashboard delivers a comprehensive view of hydrogen blending infrastructure upgrades and pilot project progress across gas network corridors. The Overview screen prominently displays three critical high-level metrics: Regulator Compliance Score at 94.2%, Hydrogen Blend Concentration at 12.7%, and Contractor Performance Rating at 76 — providing immediate insight into regulatory standing, blending progress, and vendor performance. The Pilot Progress Trend tracks overall pilot completion at 83.7% (vs prior 78.4%), showing advancement toward project goals. Project Phase Distribution provides a visual breakdown of activities across Feasibility (24%), Implementation (41%), Testing (18%), Commissioning (18%), and Monitoring (11%) — enabling portfolio-level resource allocation. Infrastructure Upgrade Completion tracks physical network modifications at 82.6% (vs prior 76.2%), measuring tangible progress toward hydrogen readiness.
How to Analyze Data in a Hydrogen Blend Gas Network Upgrade Dashboard
Here is how you can analyze data from this dashboard:
- Regulatory Compliance Monitoring: Monitor Regulator Compliance Score (%) to ensure all hydrogen blending activities meet safety and regulatory requirements.
- Blend Concentration Tracking: Track Hydrogen Blend Concentration (%) by pilot zone to measure progress toward target blend percentages and identify lagging zones.
- Contractor Performance Evaluation: Review Contractor Performance Rating to evaluate vendor effectiveness and address underperformance.
- Pilot Progress Analysis: Analyze Pilot Progress Trend to assess overall program advancement and validate timelines.
- Project Phase Tracking: Examine Project Phase Distribution to ensure balanced progress and identify bottlenecks.
- Infrastructure Completion Monitoring: Evaluate Infrastructure Upgrade Completion (%) to track network modifications and prioritize remaining work.
- Geographic Performance Insights: Use geographic visualization of Hydrogen Blend Concentration by Pilot Zone to identify regional variations and share best practices.
- Asset Deployment Validation: Drill into Infrastructure Asset Inventory & Status to verify installation timelines and deployment accuracy.
- Vendor Impact Correlation: Cross-reference contractor performance with project phase progress to identify links between vendor efficiency and milestone achievement.
Benefits of a Hydrogen Blend Gas Network Upgrade Dashboard
The following are the benefits of using this dashboard:
- Centralized Upgrade Visibility: Provides real-time visibility into hydrogen blending infrastructure upgrades and pilot progress.
- Proactive Compliance Management: Enables continuous monitoring of regulatory compliance scores.
- Efficient Project Management: Optimizes portfolio tracking with phase visibility and bottleneck detection.
- Improved Contractor Oversight: Enhances vendor management through performance tracking and comparisons.
- Target Achievement Tracking: Supports hydrogen blend concentration goals across pilot zones.
- Enhanced Asset Management: Maintains a complete view of hydrogen-ready infrastructure components.
- Better Stakeholder Communication: Facilitates clear reporting of progress, milestones, and outcomes.
- Audit & Regulatory Readiness: Demonstrates compliance and due diligence with structured, auditable data.
KPIs to Track in a Hydrogen Blend Gas Network Upgrade Dashboard
- Regulator Compliance Score (%): Overall compliance with hydrogen blending safety and regulatory requirements.
- Hydrogen Blend Concentration (%): Current hydrogen percentage in blended gas across pilot zones.
- Contractor Performance Rating: Overall rating of contractor effectiveness (scale of 0–100).
- Pilot Progress Trend (%): Overall completion percentage for hydrogen blending pilot projects.
- Project Phase Distribution: Percentage breakdown of projects by phase (Feasibility, Implementation, Testing, Commissioning, Monitoring).
- Infrastructure Upgrade Completion (%): Percentage of required network upgrades completed.
- Hydrogen Blend Concentration by Zone: Blend percentages across different geographic pilot zones.
- Infrastructure Asset Inventory: Count and status of hydrogen-ready assets by type and location.
- Asset Installation Timeline: Installation dates for critical hydrogen blending infrastructure.
Frequently Asked Questions
Q1. Who is the intended audience for this dashboard?
This dashboard is designed for hydrogen program directors, gas distribution engineers, project managers, regulatory compliance officers, and utility leadership responsible for planning and executing hydrogen blending initiatives in natural gas networks.
Q2. Is this dashboard suitable for organizations new to hydrogen blending?
Yes. The dashboard provides comprehensive visibility across all project phases from feasibility through monitoring, making it valuable for both organizations just beginning hydrogen blending pilots and those with advanced programs.
Q3. How does this dashboard support regulatory compliance for hydrogen blending?
The Regulator Compliance Score provides a continuous, at-a-glance assessment of compliance with applicable hydrogen blending regulations, while asset inventory and project phase tracking support audit readiness and regulatory reporting requirements.
Q4. What types of infrastructure assets are tracked in this dashboard?
The dashboard tracks a comprehensive range of hydrogen-ready assets including Pipeline Segments, Compressor Units, Metering Stations, Regulator Assemblies, Fittings & Valves, Sensor Arrays, Control Systems, Safety Equipment, and Monitoring Devices.
Q5. Can this dashboard track multiple hydrogen blending pilot zones simultaneously?
Absolutely. The dashboard includes filters for Pilot Zone/Network Corridor and provides geographic visualization of hydrogen blend concentration across different zones, enabling comparative analysis and portfolio-level program management.