What is a Hydrogen Blend Gas Energy Balance & Efficiency Dashboard?
A Hydrogen Blend Gas Energy Balance & Efficiency Dashboard is a monitoring and analytics solution designed to track the operational efficiency, energy distribution, hydrogen blending performance, and carbon reduction impact of hydrogen-enriched natural gas networks. The dashboard consolidates key operational, environmental, and energy efficiency metrics into a centralized platform for utility operators, energy providers, and infrastructure managers.
This hydrogen blend gas energy balance dashboard helps organizations monitor hydrogen blend ratios, energy delivery efficiency, energy loss rates, and network reliability across pipeline zones and facility types. It supports the transition toward cleaner fuel systems by providing visibility into energy balance performance and carbon reduction outcomes. The dashboard also enables organizations to analyze energy flow distribution, compressor energy consumption, gas supply stability, and operational efficiency trends. With integrated visual analytics and KPI monitoring, companies can improve distribution efficiency, optimize energy utilization, reduce operational losses, and support sustainability goals within hydrogen-blended gas infrastructure.
How to Create a Hydrogen Blend Gas Energy Balance & Efficiency Dashboard
You don’t need to build your report from scratch; just start with a ready-to-use dashboard template from Mokkup. Add in your data and export it however you like. Here’s how to do it:
1. Create or Log in to Your Mokkup Account
Start by signing up on Mokkup.ai using your email. If you already have an account, just log in, and you’ll be good to go.
2. Choose and Customize Your Dashboard Template
Find the Hydrogen Blend Gas Energy Balance & Efficiency Dashboard template in the Templates section. Use the drag-and-drop editor to adjust KPIs, edit filters, or add elements based on your data.
3. Export to Your BI Tool
Once your dashboard wireframe is ready, use the BI Tool Export feature to send it directly to Power BI or Tableau for further analysis and enhancements. You can also download the dashboard as a PDF, PNG, or JPEG, embed it on a platform, or invite your team to collaborate.
Note: This is a Pro template. You’ll need a Pro subscription on Mokkup to use and customize this dashboard wireframe. Upgrade anytime to unlock full access.
Hydrogen Blend Gas Energy Balance & Efficiency Dashboard Example
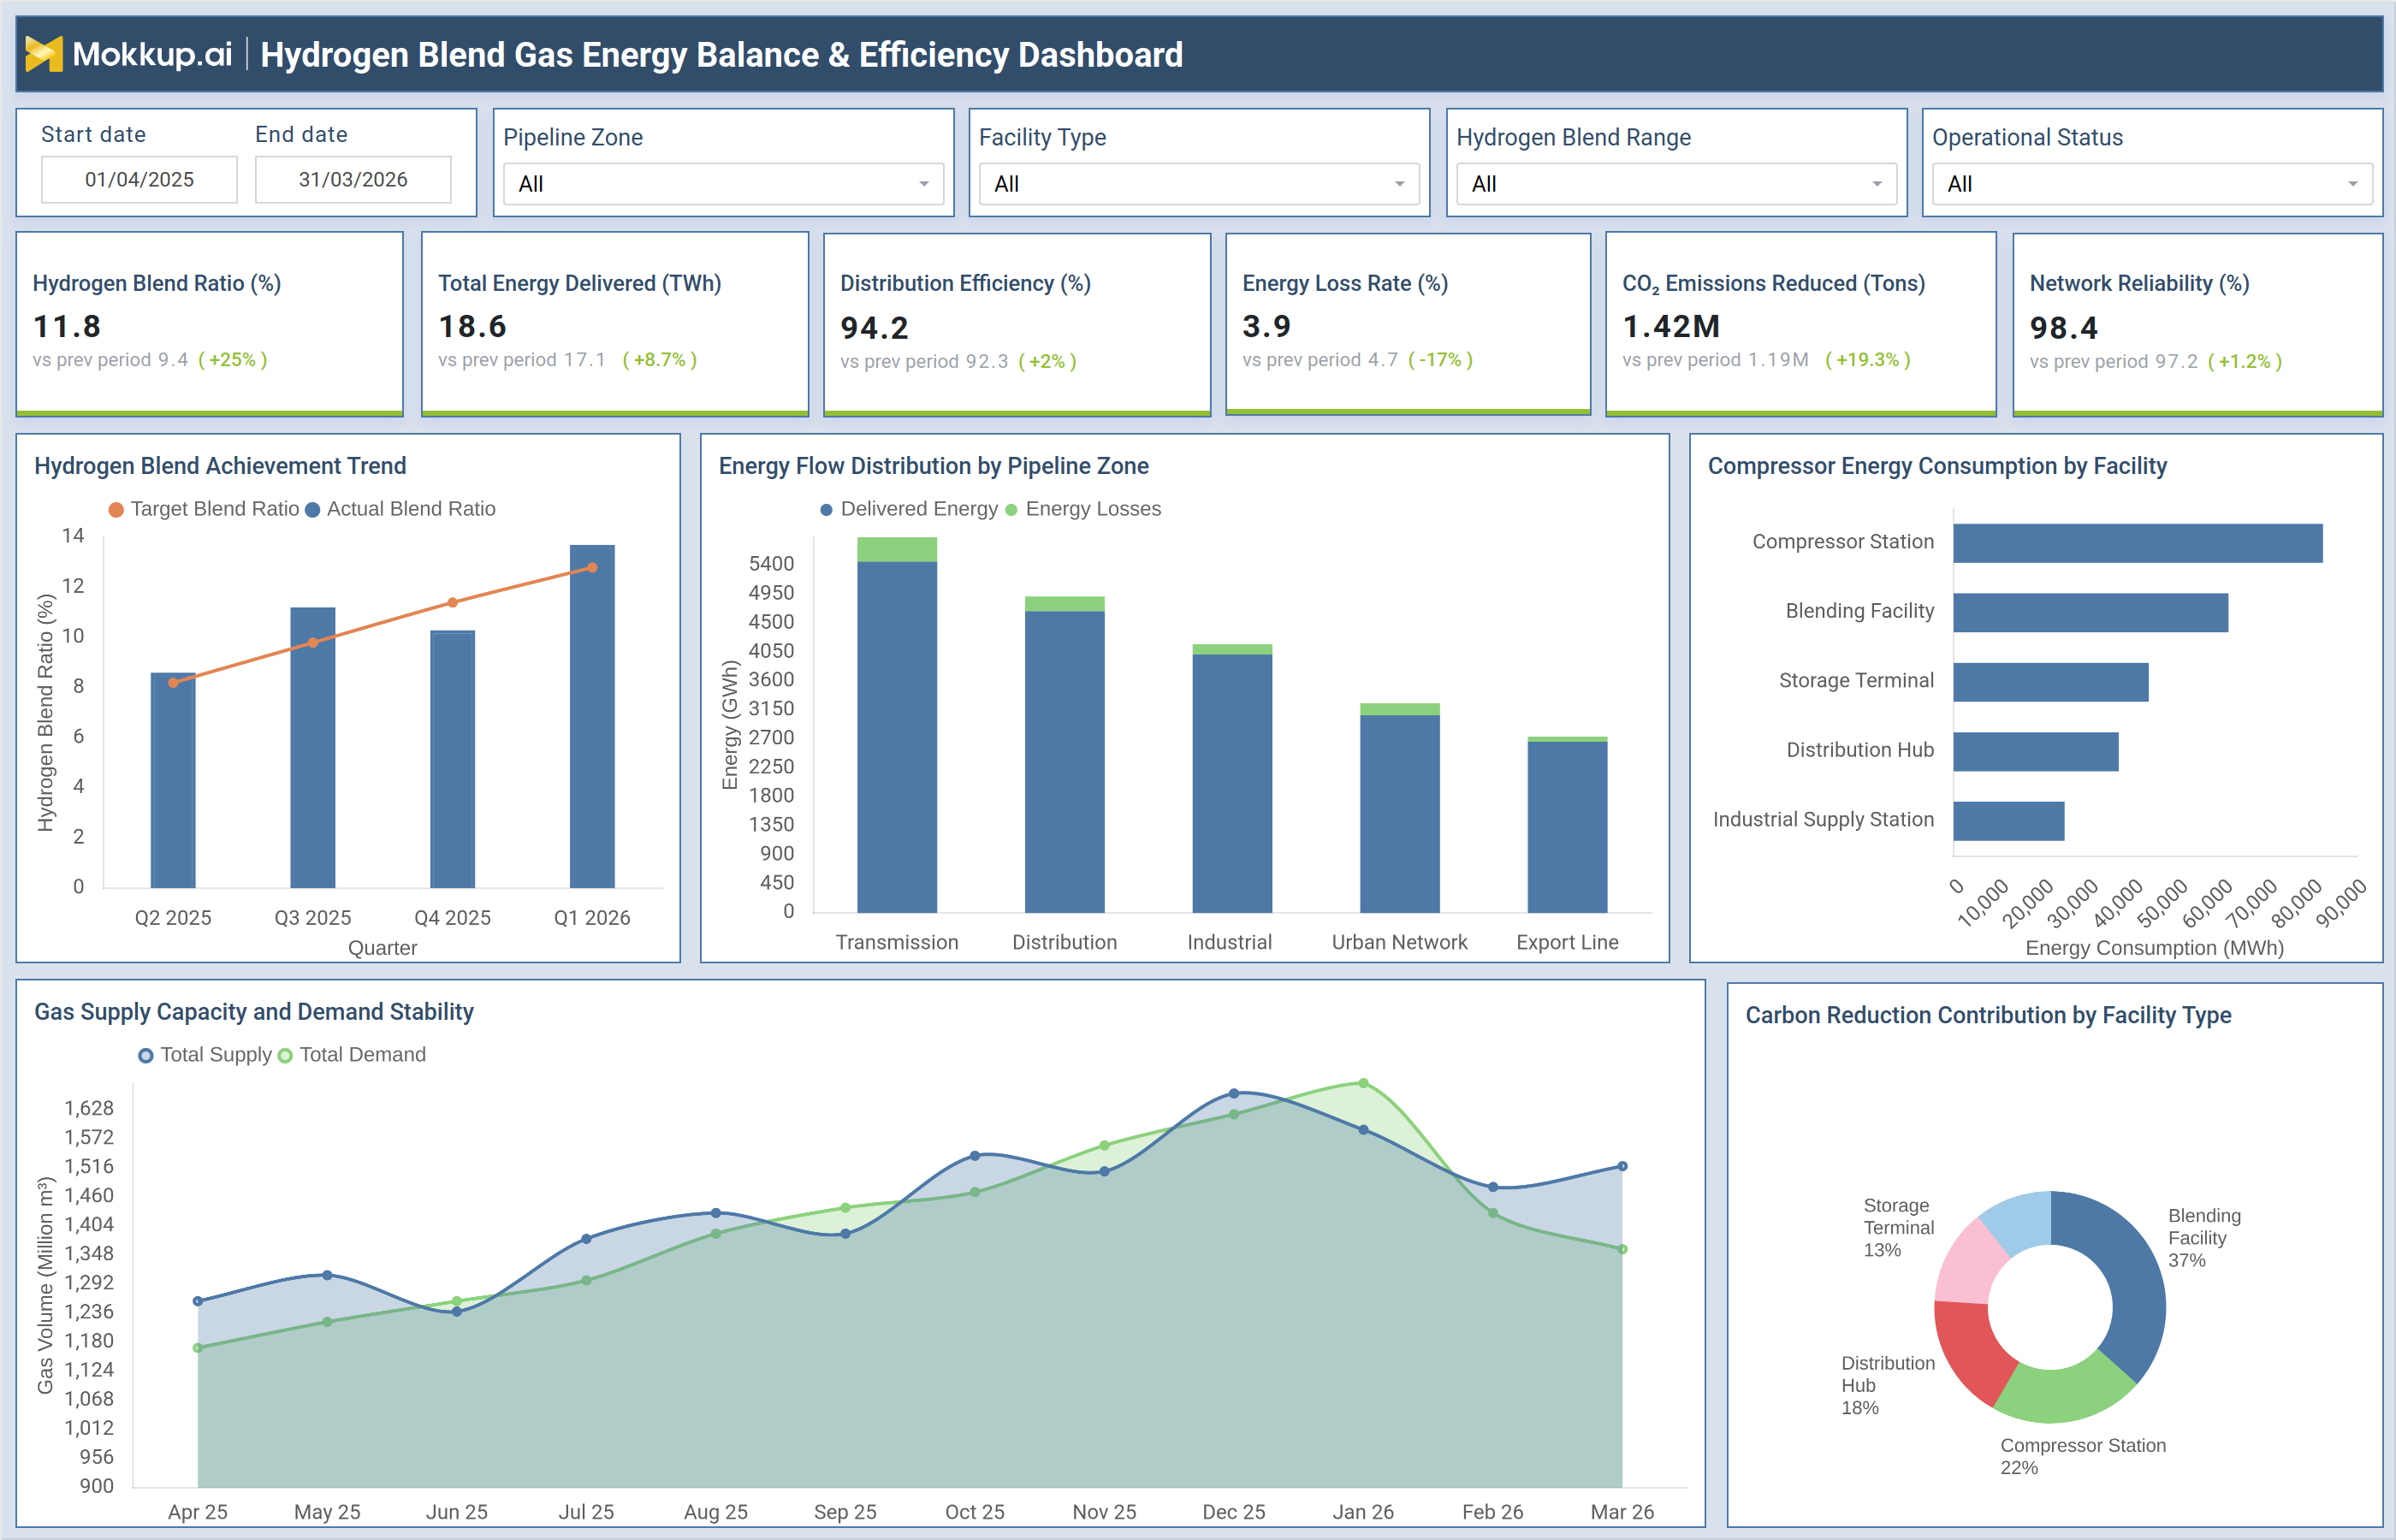
This Hydrogen Blend Gas Efficiency Analytics dashboard provides a complete operational overview of hydrogen-blended gas distribution systems. The dashboard displays critical KPIs such as Hydrogen Blend Ratio, Total Energy Delivered, Distribution Efficiency, Energy Loss Rate, CO₂ Emissions Reduced, and Network Reliability. These metrics help operators monitor infrastructure performance and energy efficiency across the distribution network. The Hydrogen Blend Achievement Trend chart compares target blend ratios against actual hydrogen blending performance over multiple quarters. This helps organizations measure progress toward clean energy adoption targets.
The Energy Flow Distribution visual tracks delivered energy and energy losses across transmission, distribution, industrial, and urban pipeline zones to identify operational inefficiencies. Additional analytics include compressor energy consumption monitoring by facility type and gas supply versus demand stability tracking. The Carbon Reduction Contribution chart highlights emission reduction impact across blending facilities, compressor stations, storage terminals, and distribution hubs. This hydrogen-blended natural gas performance dashboard enables utility providers to improve operational reliability, optimize energy flow, and monitor sustainability performance using analytics.
How to Analyze Data in Hydrogen Blend Gas Energy Balance & Efficiency Dashboard
Here is how you can analyze data from this dashboard:
- Monitor Hydrogen Blend Ratio trends to evaluate clean energy adoption progress.
- Compare actual blend ratio against target blend ratio to identify operational deviations.
- Analyze Total Energy Delivered to measure network throughput performance.
- Review Distribution Efficiency percentages to identify energy transfer effectiveness.
- Track Energy Loss Rate to identify transmission inefficiencies and leakage issues.
- Monitor CO₂ Emissions Reduced to evaluate environmental sustainability performance.
- Analyze Network Reliability trends to ensure stable gas distribution operations.
- Review Energy Flow Distribution by pipeline zone to identify high-loss operational areas.
- Monitor Compressor Energy Consumption across facilities to improve energy optimization.
- Compare gas supply and demand stability trends to evaluate network balancing efficiency.
- Analyze carbon reduction contribution by facility type to identify high-impact infrastructure.
- Track operational performance across facility types and regions for benchmarking.
Benefits of Hydrogen Blend Gas Energy Balance & Efficiency Dashboard
The following are the benefits of using such a Hydrogen blend fuel balance analytics dashboard:
- Improves visibility into hydrogen blend performance and energy distribution efficiency.
- Helps organizations reduce energy losses across gas transmission and distribution networks.
- Supports sustainability and carbon reduction initiatives through monitoring.
- Enhances operational reliability and network performance tracking.
- Enables better hydrogen blend optimization and energy balancing decisions.
- Helps operators identify high-energy-consuming facilities and optimize operations.
- Improves supply-demand balancing across pipeline zones.
- Supports regulatory reporting and environmental compliance monitoring.
- Enables proactive maintenance and operational risk reduction.
- Helps management improve energy efficiency using centralized analytics.
- Supports strategic planning for hydrogen infrastructure expansion.
- Increases operational transparency across gas utility operations.
KPIs to Track in Hydrogen Blend Gas Energy Balance & Efficiency Dashboard
The following key KPIs can be tracked by using this Hydrogen gas energy efficiency monitoring dashboard:
- Hydrogen Blend Ratio (%): Measures percentage of hydrogen blended into the gas network
- Total Energy Delivered (TWh): Tracks total energy supplied through the distribution network
- Distribution Efficiency (%): Measures efficiency of gas transmission and distribution operations
- Energy Loss Rate (%): Tracks percentage of energy lost during distribution processes
- CO₂ Emissions Reduced (Tons): Measures carbon emission reduction achieved through hydrogen blending
- Network Reliability (%): Tracks operational reliability and network uptime performance
Frequently Asked Questions
1. What is a Hydrogen Blend Gas Energy Balance & Efficiency Dashboard?
It is an analytics dashboard used to monitor hydrogen blending performance, energy distribution efficiency, network reliability, and carbon reduction metrics across hydrogen-blended gas infrastructure.
2. Why is hydrogen blend ratio monitoring important?
Hydrogen blend ratio monitoring helps organizations ensure compliance with clean energy targets while maintaining operational safety and distribution efficiency.
3. What does distribution efficiency measure?
Distribution efficiency in this Hydrogen blended gas operational efficiency dashboard measures how effectively energy is transmitted through the gas network with minimal operational losses.