
What is a Hydroelectric Power Plant Reservoir Management Dashboard?
A Hydroelectric Power Plant Reservoir Management Dashboard is a centralized visual tool designed to monitor and manage the key operational metrics of hydroelectric reservoirs and dams. It consolidates critical data points, including reservoir levels, storage trends, inflow and outflow rates, gate operations, flood control compliance, and power generation efficiency, into a single, easy-to-understand interface. By incorporating hydroelectric dam performance tracking, reservoir level monitoring, and water release management, the dashboard supports informed decision-making for reservoir operators, water resource managers, and energy production planners. It helps ensure operational efficiency, regulatory compliance, and sustainable water resource management—all essential for effective hydroelectric power generation optimization and reservoir management reporting.
How to Create a Hydroelectric Power Plant Reservoir Management Dashboard
You don’t need to start from scratch—simply use a pre-designed dashboard template from Mokkup. Input your data and export it in your preferred format. Here’s how:
1. Create or Log in to Your Mokkup Account
Start by signing up on Mokkup.ai using your email. If you already have an account, just log in, and you’ll be good to go.
2. Choose and Customize Your Dashboard Template
Find the Hydroelectric Power Plant Reservoir Management Dashboard template in the Templates section. Use the drag-and-drop editor to adjust KPIs, edit filters, or add elements based on your data.
3. Export to Your BI Tool
Once your dashboard wireframe is ready, use the BI Tool Export feature to send it directly to Power BI or Tableau for further analysis and enhancements. You can also download the dashboard as a PDF, PNG, or JPEG, embed it on a platform, or invite your team to collaborate.
Note: This is a Pro template. You’ll need a Pro subscription on Mokkup to use and customize this dashboard wireframe. Upgrade anytime to unlock full access.
Hydroelectric Power Plant Reservoir Management Dashboard Example
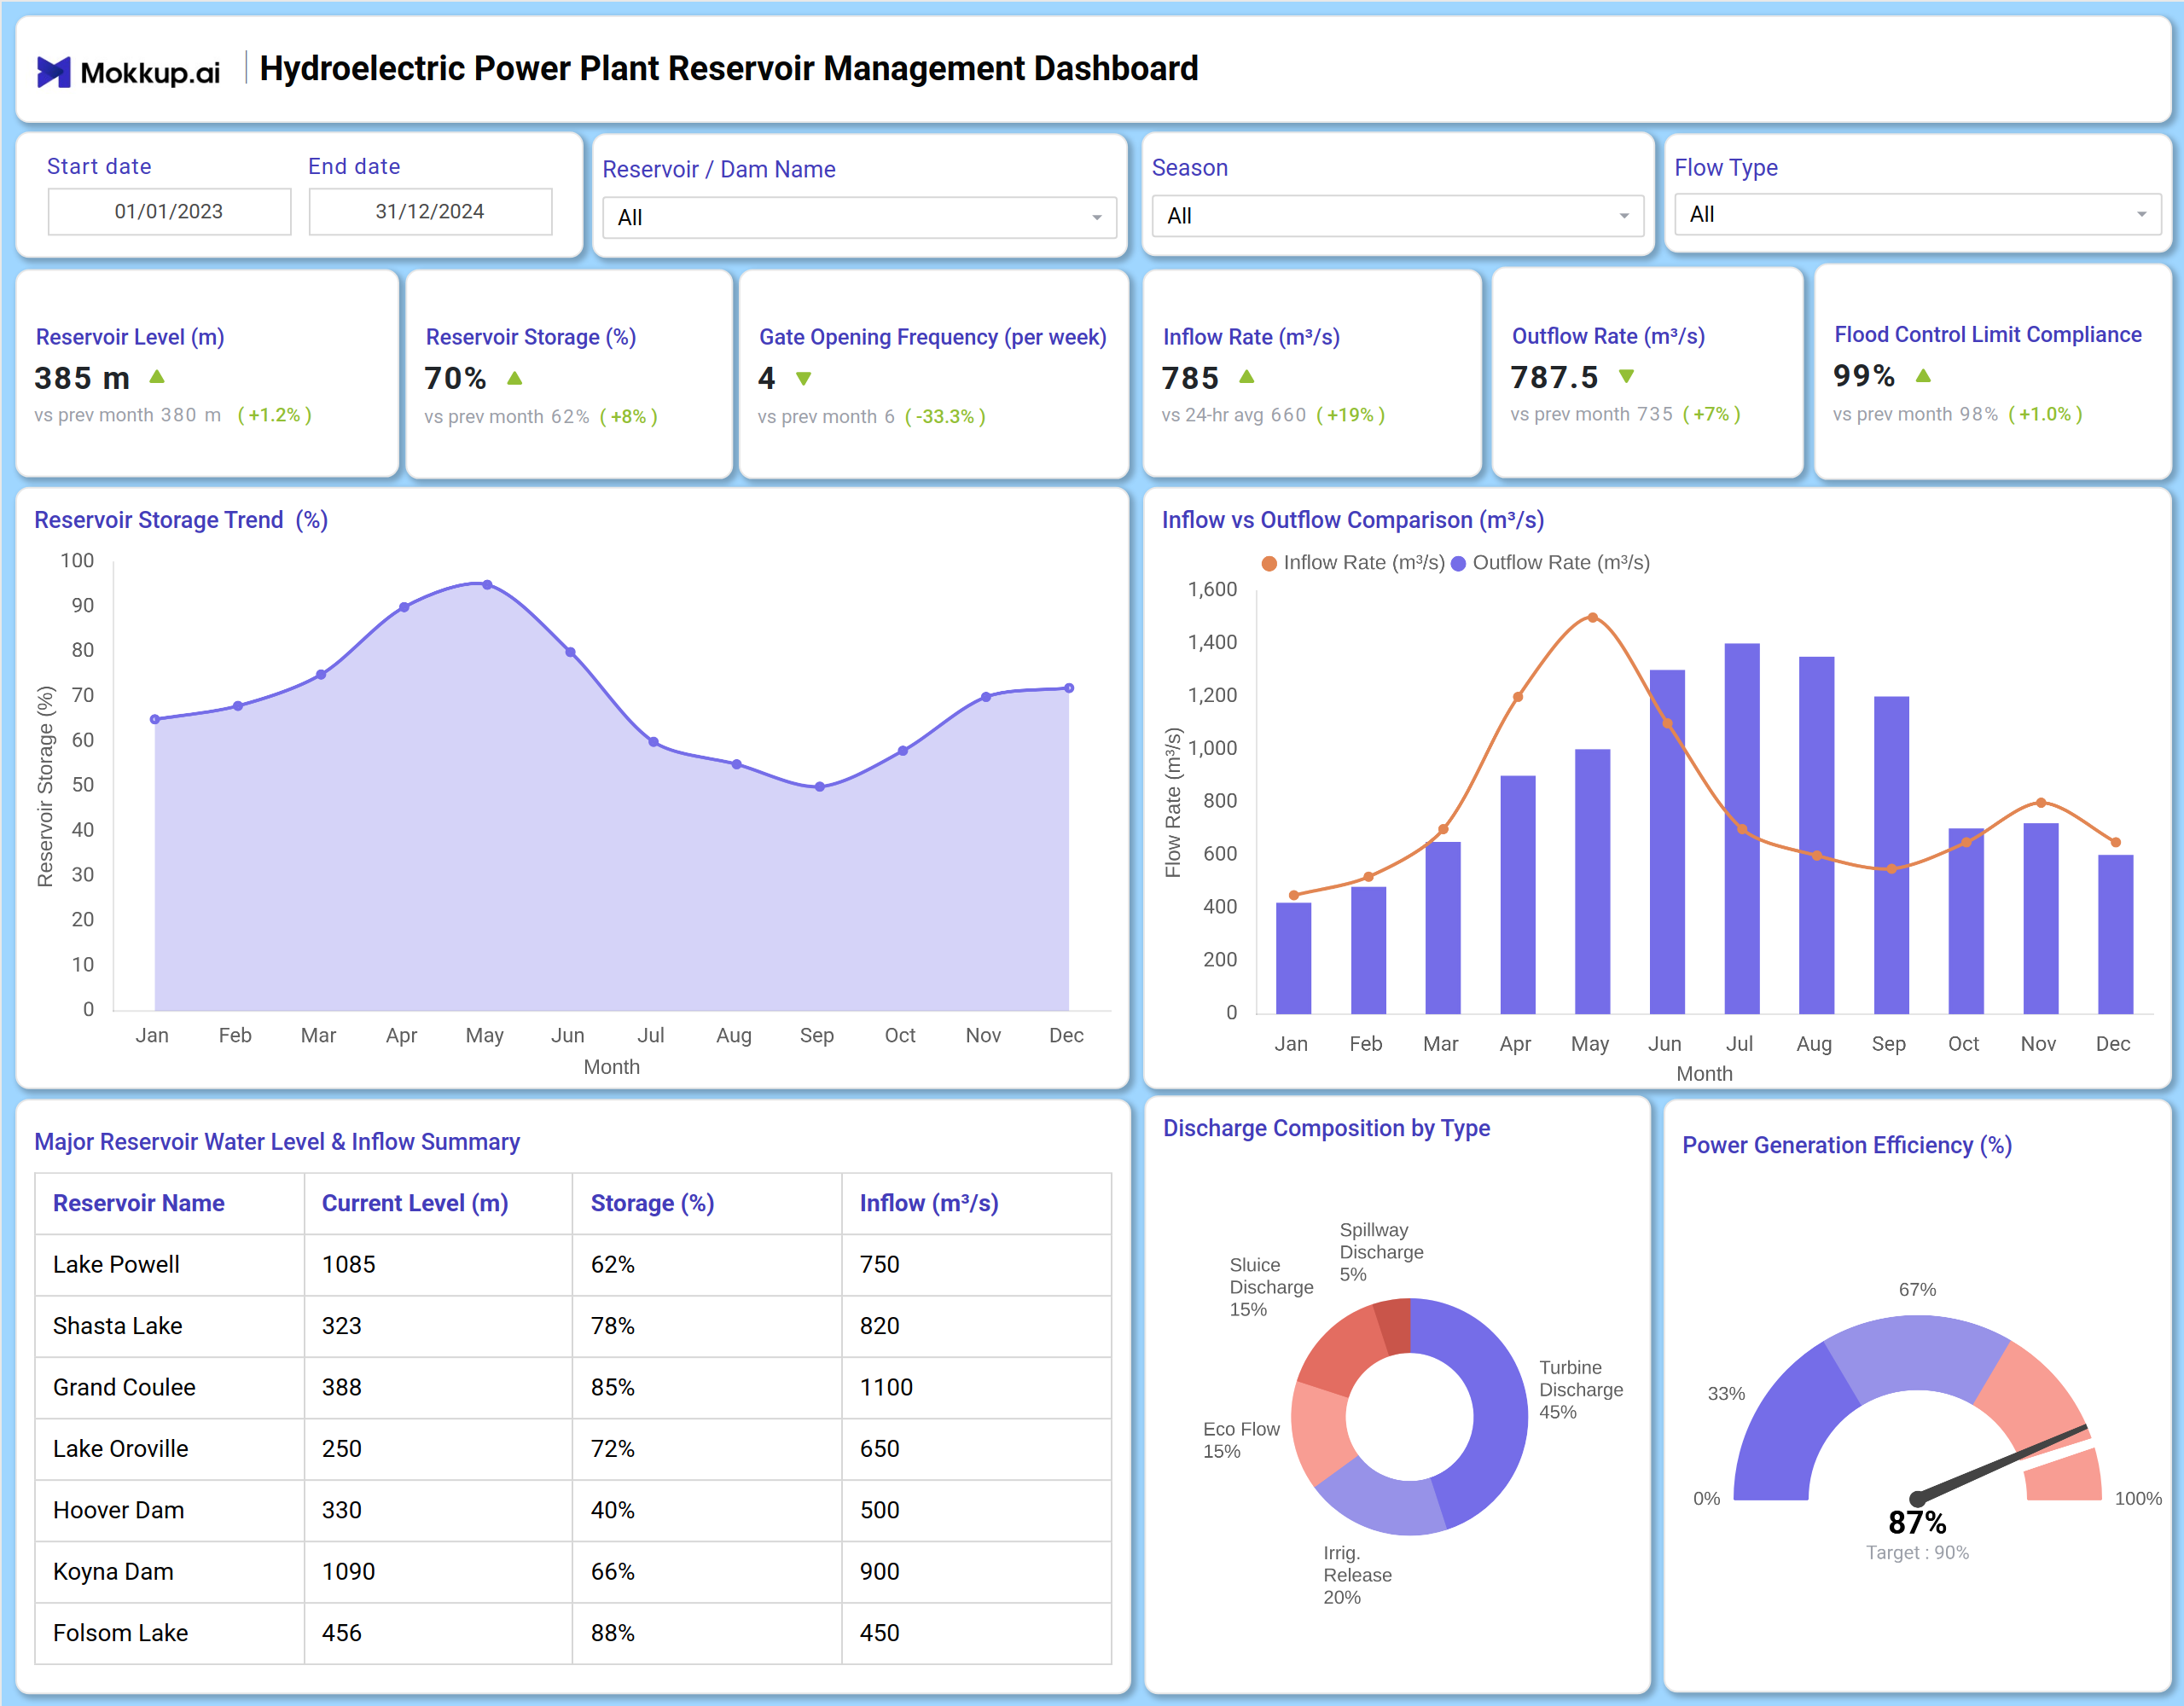
A Hydroelectric Power Plant Reservoir Management Dashboard provides a unified view of reservoir operations across two main screens: Reservoir Level & Storage, and Discharge & Power Generation. The first screen displays essential metrics, including reservoir level in meters, storage percentage, and trends over time. Operators can track inflow and outflow rates, monitor gate opening frequency, and review flood control limit compliance. Visual charts illustrate monthly trends in reservoir storage and water level summaries for major dams.
The second screen focuses on discharge composition, breaking down releases by spillway, eco-flow, and other types, and evaluates power generation efficiency against set targets. A summary table compares key reservoirs by current level, storage percentage, and inflow, supporting reservoir management reporting and water resource management for hydro plants. Together, these screens offer a holistic view for optimizing operations and ensuring compliance.
How to Analyze Data in a Hydroelectric Power Plant Reservoir Management Dashboard
Here is how you can analyze data from this dashboard:
- Monitor Reservoir Level (m) to assess current water elevation and compare it to previous periods.
- Track Reservoir Storage (%) to understand available water volume relative to total capacity.
- Analyze Inflow Rate (m³/s) to evaluate the volume of water entering the reservoir.
- Review Outflow Rate (m³/s) to manage water release volumes and downstream impacts.
- Check Gate Opening Frequency to optimize operational control and minimize wear.
- Evaluate Flood Control Limit Compliance to ensure adherence to safety and regulatory standards.
- Assess Power Generation Efficiency (%) to measure how effectively water flow is converted into energy.
- Compare primary reservoir water levels and inflows to identify regional trends or anomalies.
- Examine Discharge Composition to balance energy production, environmental flows, and spillage.
Benefits of a Hydroelectric Power Plant Reservoir Management Dashboard
The following are the benefits of using this dashboard:
- Provides a centralized view of reservoir operations for improved situational awareness.
- Supports the tracking of hydroelectric dam performance and operational planning.
- Enhances water release management for environmental and safety compliance.
- Enhances energy production planning through optimized hydroelectric power generation.
- Facilitates reservoir management reporting with organized, visual data.
- Helps maintain regulatory and flood control standards with compliance tracking.
- Reduces manual effort by consolidating multiple data sources into one dashboard.
- Aids in stakeholder communication with clear, exportable reports.
KPIs to Track in a Hydroelectric Power Plant Reservoir Management Dashboard
The following key KPIs can be tracked by using this dashboard:
- Reservoir Level (m): The current elevation of the water surface in the reservoir.
- Reservoir Storage (%): The percentage of total reservoir capacity currently filled with water.
- Inflow Rate (m³/s): The rate at which water is flowing into the reservoir.
- Outflow Rate (m³/s): The rate at which water is being released from the reservoir.
- Gate Opening Frequency (per week): How often reservoir gates are operated weekly.
- Flood Control Limit Compliance (%): Adherence to regulated reservoir levels for flood prevention.
- Power Generation Efficiency (%): The effectiveness of converting water flow into electrical energy.
- Discharge Composition by Type: Breakdown of water release by purpose (e.g., spillway, eco-flow).
- Major Reservoir Water Level & Inflow: Comparative data for key reservoirs in the system.
Frequently Asked Questions
1. What is the purpose of a hydroelectric reservoir management dashboard?
It helps monitor reservoir levels, track water inflow and outflow, manage gate operations, and evaluate power generation efficiency.
2. Can the dashboard support flood control management?
Yes. It tracks flood control compliance and water release data to help operators maintain safe reservoir levels.
3. How does the dashboard improve reservoir management?
By providing clear insights into storage trends, discharge activities, and energy efficiency, it supports better operational decisions.
4. Does it track environmental flow releases?
Yes. The discharge composition section includes eco-flow and other release types for environmental compliance.
5. Who uses this dashboard?
Reservoir operators, hydroelectric plant managers, water resource planners, and environmental compliance teams.