What is a Hydro Power Plant Generation & Turbine Efficiency Dashboard?
A hydro power plant generation dashboard is a centralized operational analytics system used to monitor electricity generation, turbine efficiency, water utilization, and plant reliability in hydroelectric facilities. It consolidates real-time and historical data related to power output, reservoir head, turbine availability, outages, and maintenance into a single, structured view for operations teams. This dashboard supports continuous operational monitoring by providing visibility into how effectively water resources are converted into electrical energy. A turbine efficiency monitoring dashboard focuses on performance indicators, including turbine efficiency, vibration levels, cavitation risk, and mean time between failures (MTBF). These insights help plant operators and maintenance teams detect early performance degradation and reduce the risk of forced outages.
By combining plant-level generation metrics with turbine-level condition monitoring, the hydro power generation performance dashboard serves as a comprehensive operations dashboard for hydroelectric plants, enabling utilities to enhance dispatch accuracy, optimize turbine performance, and maintain stable plant availability across various operating conditions.
How to Create a Hydro Power Plant Generation & Turbine Efficiency Dashboard
You don’t need to build your report from scratch, just start with a ready-to-use dashboard template from Mokkup. Add in your data and export it however you like. Here’s how to do it:
1. Create or Log in to Your Mokkup Account
Start by signing up on Mokkup.ai using your email. If you already have an account, just log in, and you’ll be good to go.
2. Choose and Customize Your Dashboard Template
Find the Hydro Power Plant Generation & Turbine Efficiency Dashboard template in the Templates section. Use the drag-and-drop editor to adjust KPIs, edit filters, or add elements based on your data.
3. Export to Your BI Tool
Once your dashboard wireframe is ready, use the BI Tool Export feature to send it directly to Power BI or Tableau for further analysis and enhancements. You can also download the dashboard as a PDF, PNG, or JPEG, embed it on a platform, or invite your team to collaborate.
Note: This is a Pro template. You’ll need a Pro subscription on Mokkup to use and customize this dashboard wireframe. Upgrade anytime to unlock full access.
Hydro Power Plant Generation & Turbine Efficiency Dashboard Example
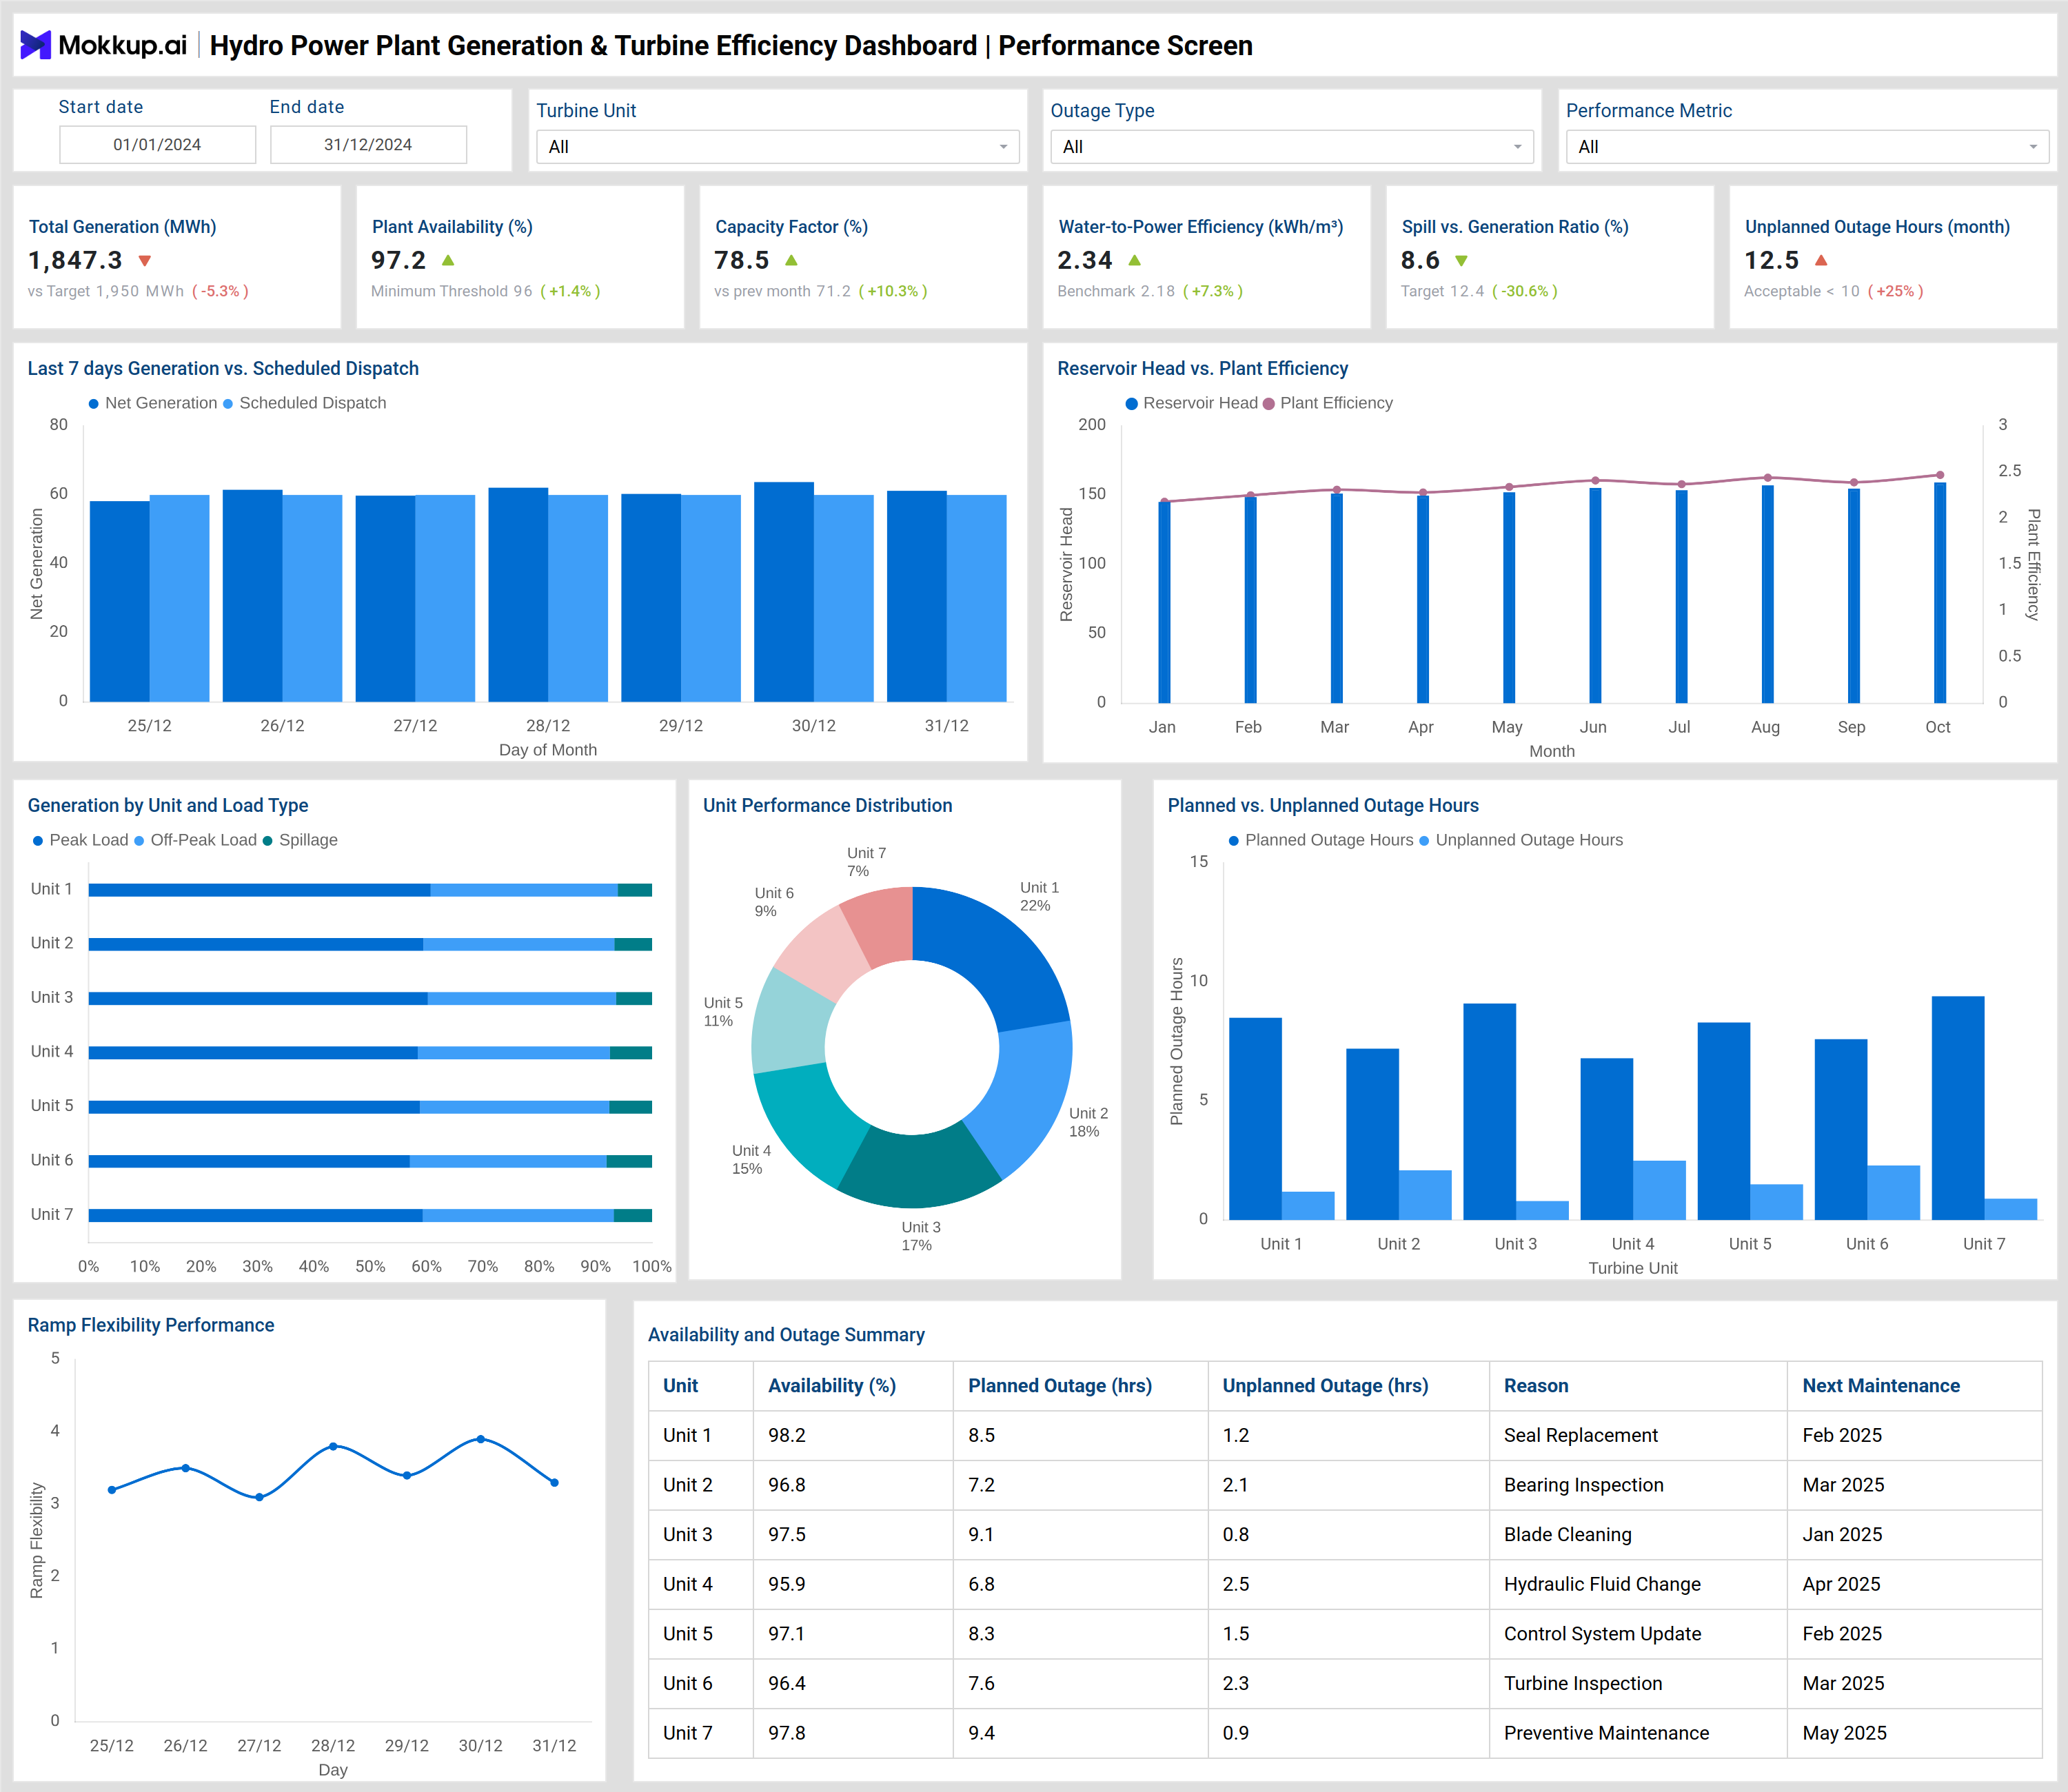
You can build a Hydro Power Plant Generation & Turbine Efficiency Dashboard using the analytical modules shown in the reference images. A typical dashboard is structured into two main analytical layers: plant performance monitoring and turbine condition monitoring. The plant performance section provides a high-level view of operational efficiency and generation output. It displays metrics such as total generation (MWh), plant availability, capacity factor, water-to-power efficiency, spill-to-generation ratio, and unplanned outage hours. These indicators help operators evaluate how closely actual generation aligns with dispatch plans and water availability.
Visual components, such as daily generation versus scheduled dispatch charts, highlight deviations between planned and actual output. Trends in reservoir head versus plant efficiency show how changes in water levels affect efficiency over time. Generation by turbine unit and load type provides clarity on peak, off-peak, and spillage-related generation, while planned versus unplanned outage charts help identify reliability gaps across turbine units. The turbine performance analysis dashboard focuses on equipment health and efficiency at the unit level. It includes average turbine efficiency, hydraulic efficiency, vibration exceedance events, cavitation alerts, predictive maintenance coverage, and forced derate incidents. Visuals, such as efficiency versus load charts, vibration trend analysis, cavitation risk distribution, and maintenance event breakdowns, provide deeper insights into operational performance.
A detailed turbine performance table summarizes efficiency, vibration levels, cavitation risk scores, MTBF hours, maintenance status, and predictive monitoring coverage for each turbine. Together, these modules form a comprehensive turbine performance analysis dashboard that supports informed operational and maintenance decisions.
How to Analyze Data in a Hydro Power Plant Generation & Turbine Efficiency Dashboard
Here is how you can analyze data from this dashboard:
- Review total power generation and compare it with the scheduled dispatch to identify production gaps.
- Monitor plant availability and capacity factor to assess overall operational stability.
- Analyze water-to-power efficiency to evaluate how effectively reservoir resources are utilized.
- Track spill versus generation ratio to identify potential energy losses due to excess water release.
- Compare turbine efficiency across load levels to detect underperforming units.
- Monitor vibration trends and cavitation alerts to identify potential mechanical issues early.
- Analyze planned versus unplanned outage hours to improve maintenance scheduling.
- Review MTBF trends to prioritize turbines for predictive or preventive maintenance.
Benefits of a Hydro Power Plant Generation & Turbine Efficiency Dashboard
The following are the benefits of using this dashboard:
- Improves real-time visibility into hydro plant generation and turbine performance.
- Enhances turbine efficiency through continuous performance monitoring.
- Reduces unplanned outages by identifying early warning signs.
- Supports predictive and condition-based maintenance strategies.
- Optimizes water usage and improves energy conversion efficiency
- Strengthens dispatch planning and grid coordination.
- Improves asset reliability and extends turbine life.
- Reduces operational and maintenance-related costs.
KPIs to Track in a Hydro Power Plant Generation & Turbine Efficiency Dashboard
The following key KPIs can be tracked by using this dashboard:
- Total Power Generation (MWh): Measures the total electrical energy produced by the hydro power plant during a defined period.
- Plant Availability (%): Indicates the percentage of time the plant is operational and available for power generation.
- Capacity Factor (%): Compares actual power generation against the plant’s maximum possible output over time.
- Water-to-Power Efficiency (kWh/m³): Shows how efficiently water volume is converted into electrical energy.
- Spill vs Generation Ratio (%): Measures the proportion of water released without generating power compared to total water usage.
- Average Turbine Efficiency (%): Represents the average effectiveness of turbines in converting hydraulic energy into mechanical power.
- Turbine Vibration Levels (mm/s): Tracks mechanical vibration intensity to detect imbalance or wear in turbine components.
- Cavitation Risk Score: Assesses the likelihood of cavitation damage occurring within turbine runners and blades.
- Mean Time Between Failures (MTBF – hours): Indicates the average operating time between turbine or equipment failures.
- Planned vs Unplanned Outage Hours: Compares scheduled maintenance downtime against unexpected operational interruptions.
Frequently Asked Questions
1. Why is a hydro power plant generation dashboard important?
It provides real-time visibility into power output, efficiency, and operational reliability, enabling utilities to optimize generation and minimize losses.
2. What data does a turbine efficiency monitoring dashboard track?
It tracks turbine efficiency, vibration levels, cavitation risk, MTBF, maintenance status, and derate incidents.
3. Who uses this dashboard in a hydroelectric plant?
Plant operators, maintenance engineers, reliability teams, operations managers, and utility leadership.
4. Does the dashboard support predictive maintenance?
Yes. Analyzing vibration trends, cavitation risk, and MTBF enables condition-based and predictive maintenance planning.
5. Can this dashboard scale across multiple turbines and plants?
Yes. Filters for turbine unit, plant location, outage type, and time period allow multi-unit and multi-plant analysis.