What is a HVAC Installation Operations Performance Dashboard?
An HVAC installation operations performance dashboard is a centralized analytics tool that tracks key metrics related to installation efficiency, productivity, and quality control for commercial and residential HVAC projects. It consolidates data from project management, crew performance, financials, and compliance into a single view, helping contractors and operations managers optimize workflows, reduce costs, and improve service delivery. This HVAC service performance analytics dashboard provides insights into installation timelines, crew productivity, gross margins, and first-time commissioning rates, allowing businesses to identify bottlenecks, track KPIs, and make data-driven decisions. By monitoring on-time installation rates, change order impacts, and inspection pass rates, HVAC companies can enhance operational efficiency, ensure compliance, and maximize profitability.
How to Create a HVAC Installation Operations Performance Dashboard
You don't need to build your report from scratch, just start with a ready-to-use dashboard template from Mokkup. Add in your data and export it however you like. Here's how to do it:
1. Create or Log in to Your Mokkup Account
Start by signing up on Mokkup.ai using your email. If you already have an account, just log in, and you'll be good to go.
2. Choose and Customize Your Dashboard Template
Find the HVAC Installation Operations Performance Dashboard template in the Templates section. Use the drag and drop editor to adjust KPIs, edit filters, or add elements based on your data.
3. Export to Your BI Tool
Once your dashboard wireframe is ready, use the BI Tool Export feature to send it directly to Power BI or Tableau for further analysis and enhancements. You can also download the dashboard as a PDF, PNG, or JPEG, embed it on a platform, or invite your team to collaborate.
Note: This is a Pro template. You'll need a Pro subscription on Mokkup to use and customize this dashboard wireframe. Upgrade anytime to unlock full access.
HVAC Installation Operations Performance Dashboard Example
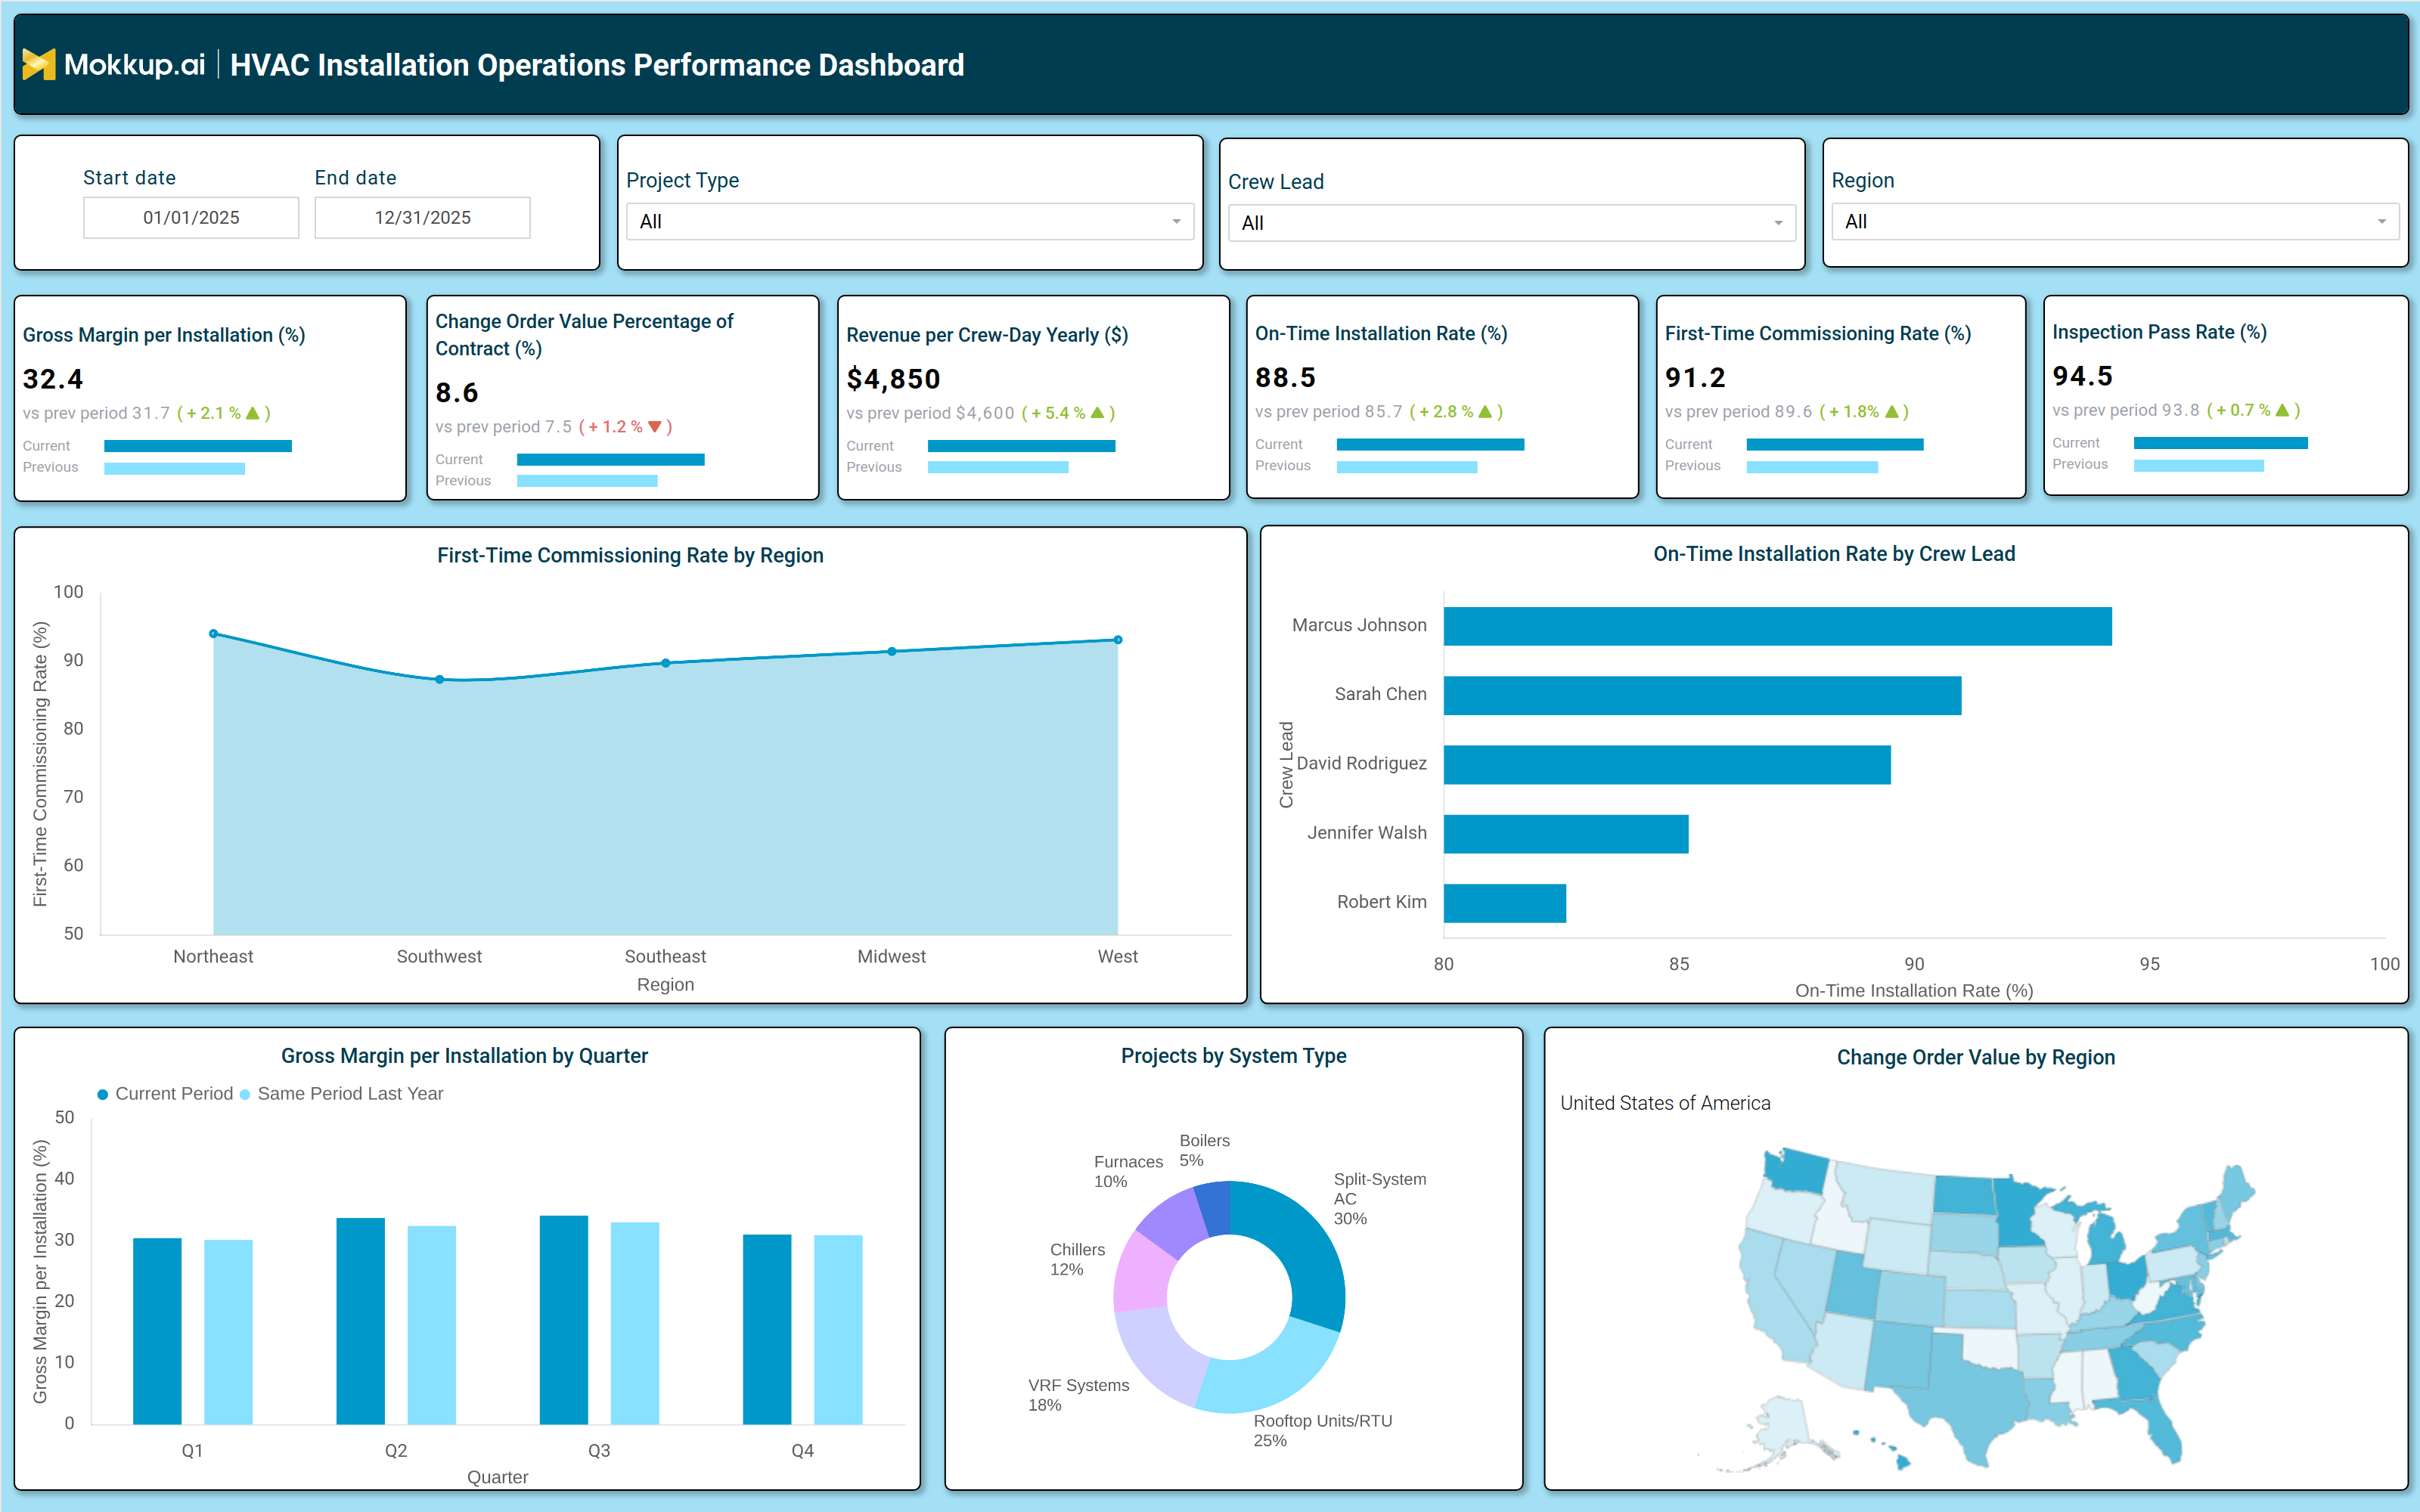
A typical HVAC installation performance tracking dashboard includes interactive filters for date range, project type, crew leads, and region, allowing users to drill down into specific performance metrics. Key KPI tiles display gross margin per installation, change order value percentage, revenue per crewday, on-time installation rate, first time commissioning rate, and inspection pass rate, with year-over-year comparisons to highlight trends. Trend charts show gross margin performance by quarter, while regional breakdowns compare first-time commissioning rates across different locations. A crew performance bar chart ranks on-time installation rates by crew lead, helping identify top performers and areas needing improvement. Additionally, a pie chart categorizes projects by system type (e.g., split-system AC, VRF systems, rooftop units), and a geographic heatmap visualizes change order values by region.
Together, these components form a comprehensive HVAC quality control dashboard, enabling contractors to monitor efficiency, control costs, and ensure high-quality installations.
How to Analyze Data in an HVAC Installation Operations Performance Dashboard
Here is how you can analyze data from this dashboard:
- Review Gross Margin per Installation: Assess profitability trends and monitor cost control effectiveness across installation projects.
- Track Change Order Value Percentage: Identify project scope changes and understand their impact on revenue and overall project costs.
- Monitor Revenue per Crew-Day: Evaluate labor efficiency and workforce productivity by analyzing revenue generated per crew day.
- Compare On-Time Installation Rates Against Targets: Measure project delivery performance to ensure installations are completed within planned timelines.
- Analyze First-Time Commissioning Rates: Assess installation quality by tracking successful first-time commissioning and minimizing rework requirements.
- Check Inspection Pass Rates: Monitor compliance with safety regulations and quality standards through inspection performance metrics.
- Break Down Performance by Region: Compare regional performance to identify high-performing areas and locations needing operational improvements.
- Evaluate Crew Productivity Across Teams: Analyze on-time installation rates by team to benchmark productivity and optimize workforce management.
- Assess Project Distribution by System Type: Understand project allocation across different system types to improve resource planning and operational efficiency.
- Use Trend Analysis for Performance Monitoring: Track historical and current performance trends to identify improvements, declines, and emerging operational patterns.
Benefits of a HVAC Installation Operations Performance Dashboard
The following are the benefits of using this on-time installation rate dashboard:
- Improves Operational Efficiency: Tracks installation timelines and crew productivity to enhance project execution and operational performance.
- Enhances Profitability: Supports better financial management through gross margin analysis and effective cost control measures.
- Reduces Rework: Monitors first-time commissioning success and inspection pass rates to improve installation quality and minimize corrective work.
- Optimizes Workforce Allocation: Provides crew performance insights to allocate resources more effectively and improve team productivity.
- Supports Data-Driven Decision-Making: Delivers actionable analytics for smarter project planning, scheduling, and resource management.
- Ensures Regulatory and Safety Compliance: Tracks compliance metrics to maintain adherence to safety standards and industry regulations.
- Identifies Regional Performance Trends: Highlights regional strengths and operational gaps to support targeted performance improvements.
- Streamlines Project Management: Centralizes project and performance tracking to improve visibility, coordination, and operational control.
KPIs to Track in a HVAC Installation Operations Performance Dashboard
The following key KPIs can be tracked by using this dashboard:
- Gross Margin per Installation (%) – Measures profitability by comparing revenue against installation costs.
- Change Order Value Percentage of Contract (%) – Tracks additional revenue from project scope adjustments.
- Revenue per CrewDay Yearly ($) – Evaluates labor efficiency by calculating revenue generated per crew per day.
- On Time Installation Rate (%) – Monitors adherence to project timelines.
- First Time Commissioning Rate (%) – Assesses installation quality by tracking successful first-time system startups.
- Inspection Pass Rate (%) – Measures compliance with safety and regulatory standards.
Frequently Asked Questions
1. What is a crew productivity dashboard used for?
It helps HVAC contractors and operations managers monitor installation efficiency, crew productivity, and project profitability in one centralized platform.
2. What data sources feed into this HVAC operations tracking dashboard?
Data comes from project management software, financial systems, crew performance logs, and inspection reports.
3. Who should use an HVAC Installation Operations Performance Dashboard?
HVAC contractors, operations managers, project supervisors, and business owners benefit from tracking performance metrics.