
What is a Geriatric Rehabilitation Mobility Progress Dashboard?
A Geriatric Rehabilitation Mobility Progress Dashboard is a centralized tool designed for rehabilitation teams, including physiatrists, physical therapists, and clinical managers, to monitor and analyze the progress of elderly patients undergoing mobility rehabilitation. It provides a clear overview of key performance indicators, including mobility improvement, recovery time, fall risk reduction, and patient satisfaction. Unlike scattered reports, this dashboard consolidates Geriatric Rehabilitation Mobility Progress Data, helping clinics track therapy effectiveness, patient compliance, and functional outcomes in one place.
How to Create a Geriatric Rehabilitation Mobility Progress Dashboard?
You don’t need to build your report from scratch—just start with a ready-to-use dashboard template from Mokkup. Add in your data and export it however you like. Here’s how to do it:
1. Create or Log in to Your Mokkup Account
Start by signing up on Mokkup.ai using your email. If you already have an account, just log in, and you’ll be good to go.
2. Choose and Customize Your Dashboard Template
Find the Geriatric Rehabilitation Mobility Progress Dashboard Template in the Templates section. Use the drag-and-drop editor to adjust KPIs, edit filters, or add elements based on your data.
3. Export to Your BI Tool
Once your dashboard wireframe is ready, use the BI Tool Export feature to send it directly to Power BI or Tableau for further analysis and enhancements. You can also download the dashboard as a PDF, PNG, or JPEG, embed it on a platform, or invite your team to collaborate.
Note: This is a Pro template. You’ll need a Pro subscription on Mokkup to use and customize this dashboard wireframe. Upgrade anytime to unlock full access.
Geriatric Rehabilitation Mobility Progress Dashboard Example
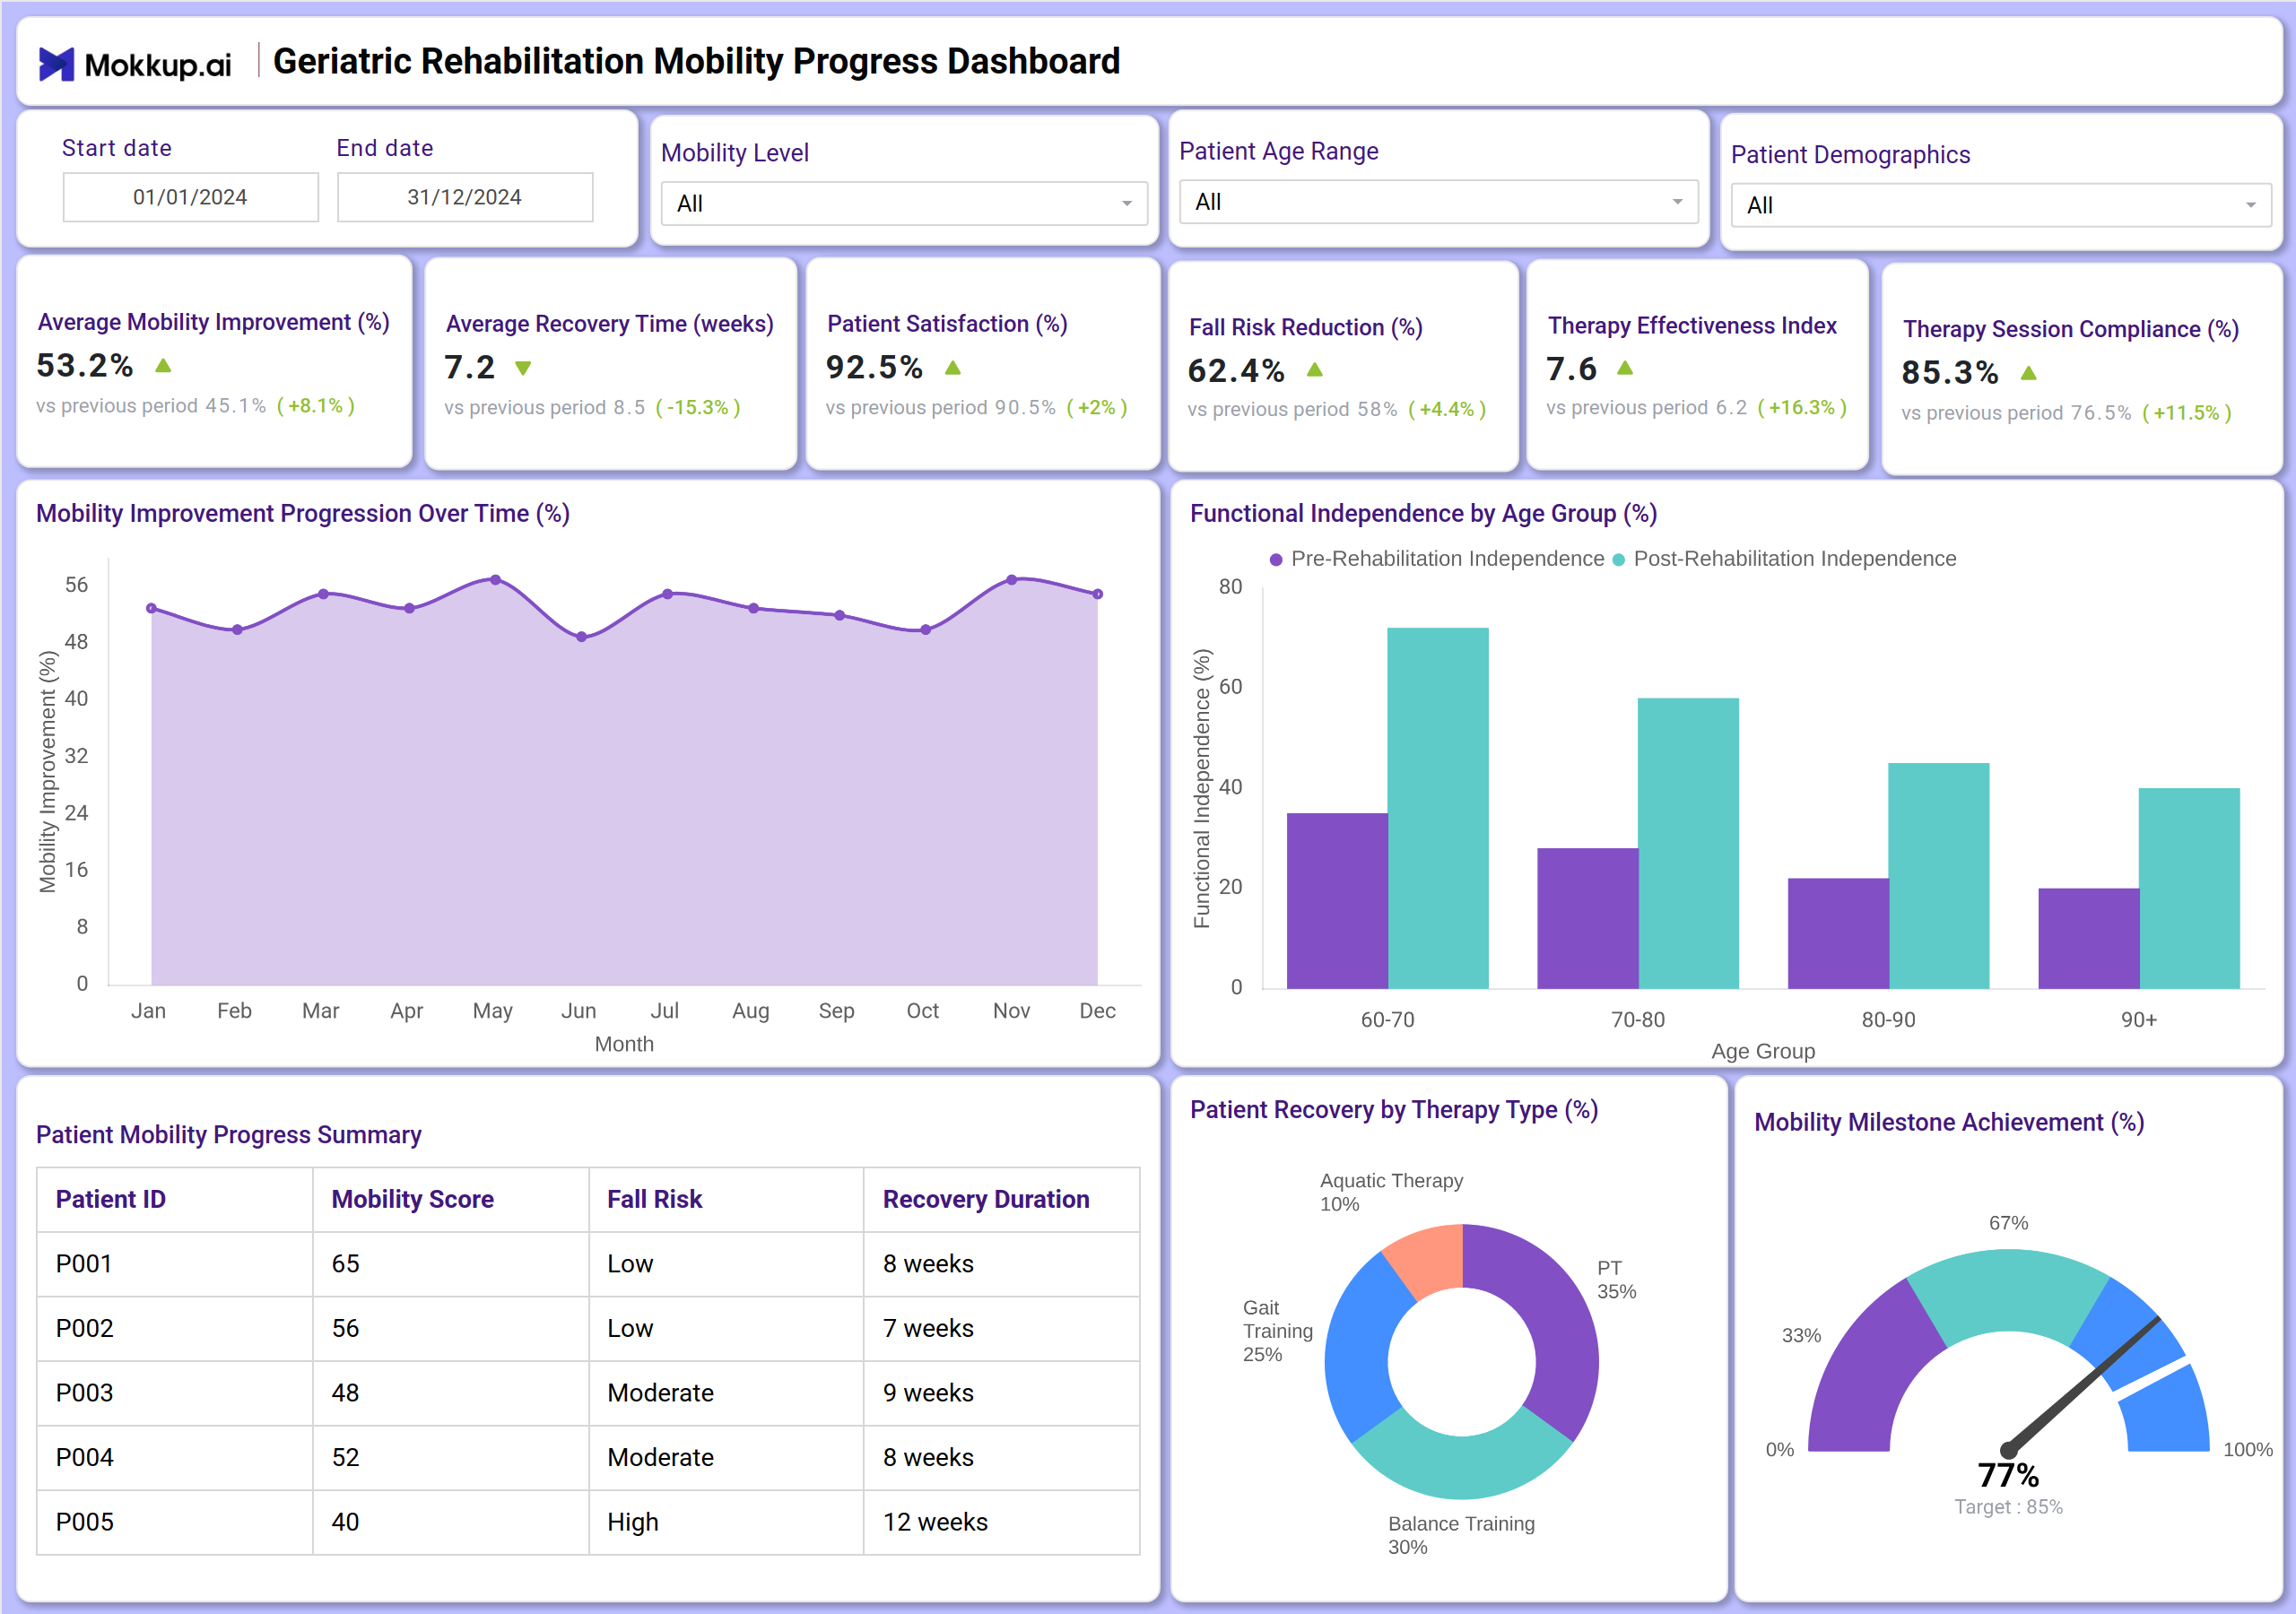
You can create a Geriatric Rehabilitation Mobility Progress Dashboard with a mix of KPI tiles and visualizations. At the top, KPI cards track key metrics, including Average Mobility Improvement, Average Recovery Time, and Patient Satisfaction. Below that, charts illustrate the progression of mobility improvement over time and functional independence by age group. A patient mobility progress summary table provides individual patient details, while donut charts illustrate patient recovery by therapy type and achievement of mobility milestones. Together, this dashboard serves as a comprehensive tool for tracking mobility progress in geriatric care, ensuring that clinical teams receive a holistic view of rehabilitation outcomes.
How to Analyze Data in Geriatric Rehabilitation Mobility Progress Dashboards
Here’s how rehabilitation clinics can make the most of the data available on the Geriatric Rehabilitation Mobility Progress Dashboard:
- Track Mobility Trends: Use the progression chart to monitor overall mobility improvement percentages across different months.
- Monitor Recovery Efficiency: Analyze the average recovery time in weeks to assess the speed of patient rehabilitation.
- Gauge Patient Experience: Review patient satisfaction scores to understand the perceived quality of care.
- Assess Safety Improvements: Track the fall risk reduction percentage to evaluate the effectiveness of interventions in reducing patient falls.
- Measure Therapy Effectiveness: Use the Therapy Effectiveness Index as a composite score to gauge the overall success of rehabilitation programs.
- Evaluate Adherence: Check therapy session compliance rates to determine how consistently patients attend their sessions.
- Compare Age Group Outcomes: Use the functional independence chart to see how different age groups respond to rehabilitation, both before and after therapy.
- Review Individual Patient Progress: Use the patient summary table to drill down into individual Mobility Scores, Fall Risk, and Recovery Duration.
Benefits of Geriatric Rehabilitation Mobility Progress Dashboards
Here are the benefits of this geriatric mobility progress tracking dashboard
- Improved Patient Outcomes: Tracks key metrics, such as mobility improvement and fall risk reduction, to ensure therapy is effective.
- Enhanced Operational Insight: Monitors recovery times and therapy compliance for better program management and resource allocation.
- Data-Driven Therapy Adjustments: Provides evidence from the Therapy Effectiveness Index and milestone achievements to tailor rehabilitation plans.
- Patient-Centric Care: Focuses on patient satisfaction and functional independence, aligning clinical goals with the patient's quality of life.
- Progress Transparency: Offers a clear summary for clinicians and patients, making it an essential dashboard for tracking geriatric mobility progress.
- Compliance & Reporting: Works as a geriatric rehab reporting and compliance dashboard for audits, reporting to stakeholders, and demonstrating program value.
Together, these elements provide clinical teams with a comprehensive view of rehabilitation efficacy, enabling them to align therapeutic interventions more effectively with positive patient outcomes. That’s why many rehabilitation professionals call it the best dashboard for geriatric rehab mobility when aiming to enhance patient care and demonstrate program success.
KPIs to Track in Geriatric Rehabilitation Mobility Progress Dashboards
- Average Mobility Improvement (%): The average percentage increase in mobility scores across the patient population, indicating the effectiveness of rehabilitation interventions.
- Average Recovery Time (weeks): The typical number of weeks patients take to achieve their primary mobility goals, highlighting program efficiency.
- Patient Satisfaction (%): The percentage of patients reporting a positive experience with their rehabilitation care, reflecting service quality.
- Fall Risk Reduction (%): The percentage decrease in patients categorized as having a high risk of falling, demonstrating improved patient safety.
- Therapy Effectiveness Index: A composite score that quantifies the overall success and impact of the therapy programs provided.
- Therapy Session Compliance (%): The percentage of scheduled therapy sessions that patients attend, indicating patient engagement and adherence to their plan.
- Functional Independence by Age Group: A comparison of independence levels before and after rehabilitation, segmented by patient age brackets.
- Mobility Milestone Achievement (%): The percentage of patients who have successfully reached key predefined mobility milestones.
Frequently Asked Questions
1. Who should use a Geriatric Rehabilitation Mobility Progress Dashboard?
Physiatrists, physical therapists, occupational therapists, clinical managers, and rehabilitation directors are responsible for monitoring patient progress and program effectiveness.
2. Can this dashboard help improve therapy programs?
Yes. By analyzing therapy effectiveness, recovery times, and milestone achievements, clinicians can identify best practices and areas for improvement in rehabilitation protocols.
3. How does it support patient care quality?
It combines clinical KPIs, such as mobility scores and fall risk, with patient-reported satisfaction, providing a holistic view of care quality and functional outcomes.
4. Is this dashboard useful for compliance?
Yes, because a geriatric rehab reporting and compliance dashboard supports governance, demonstrates value to funders, and aids in audit preparation through structured outcome tracking.