
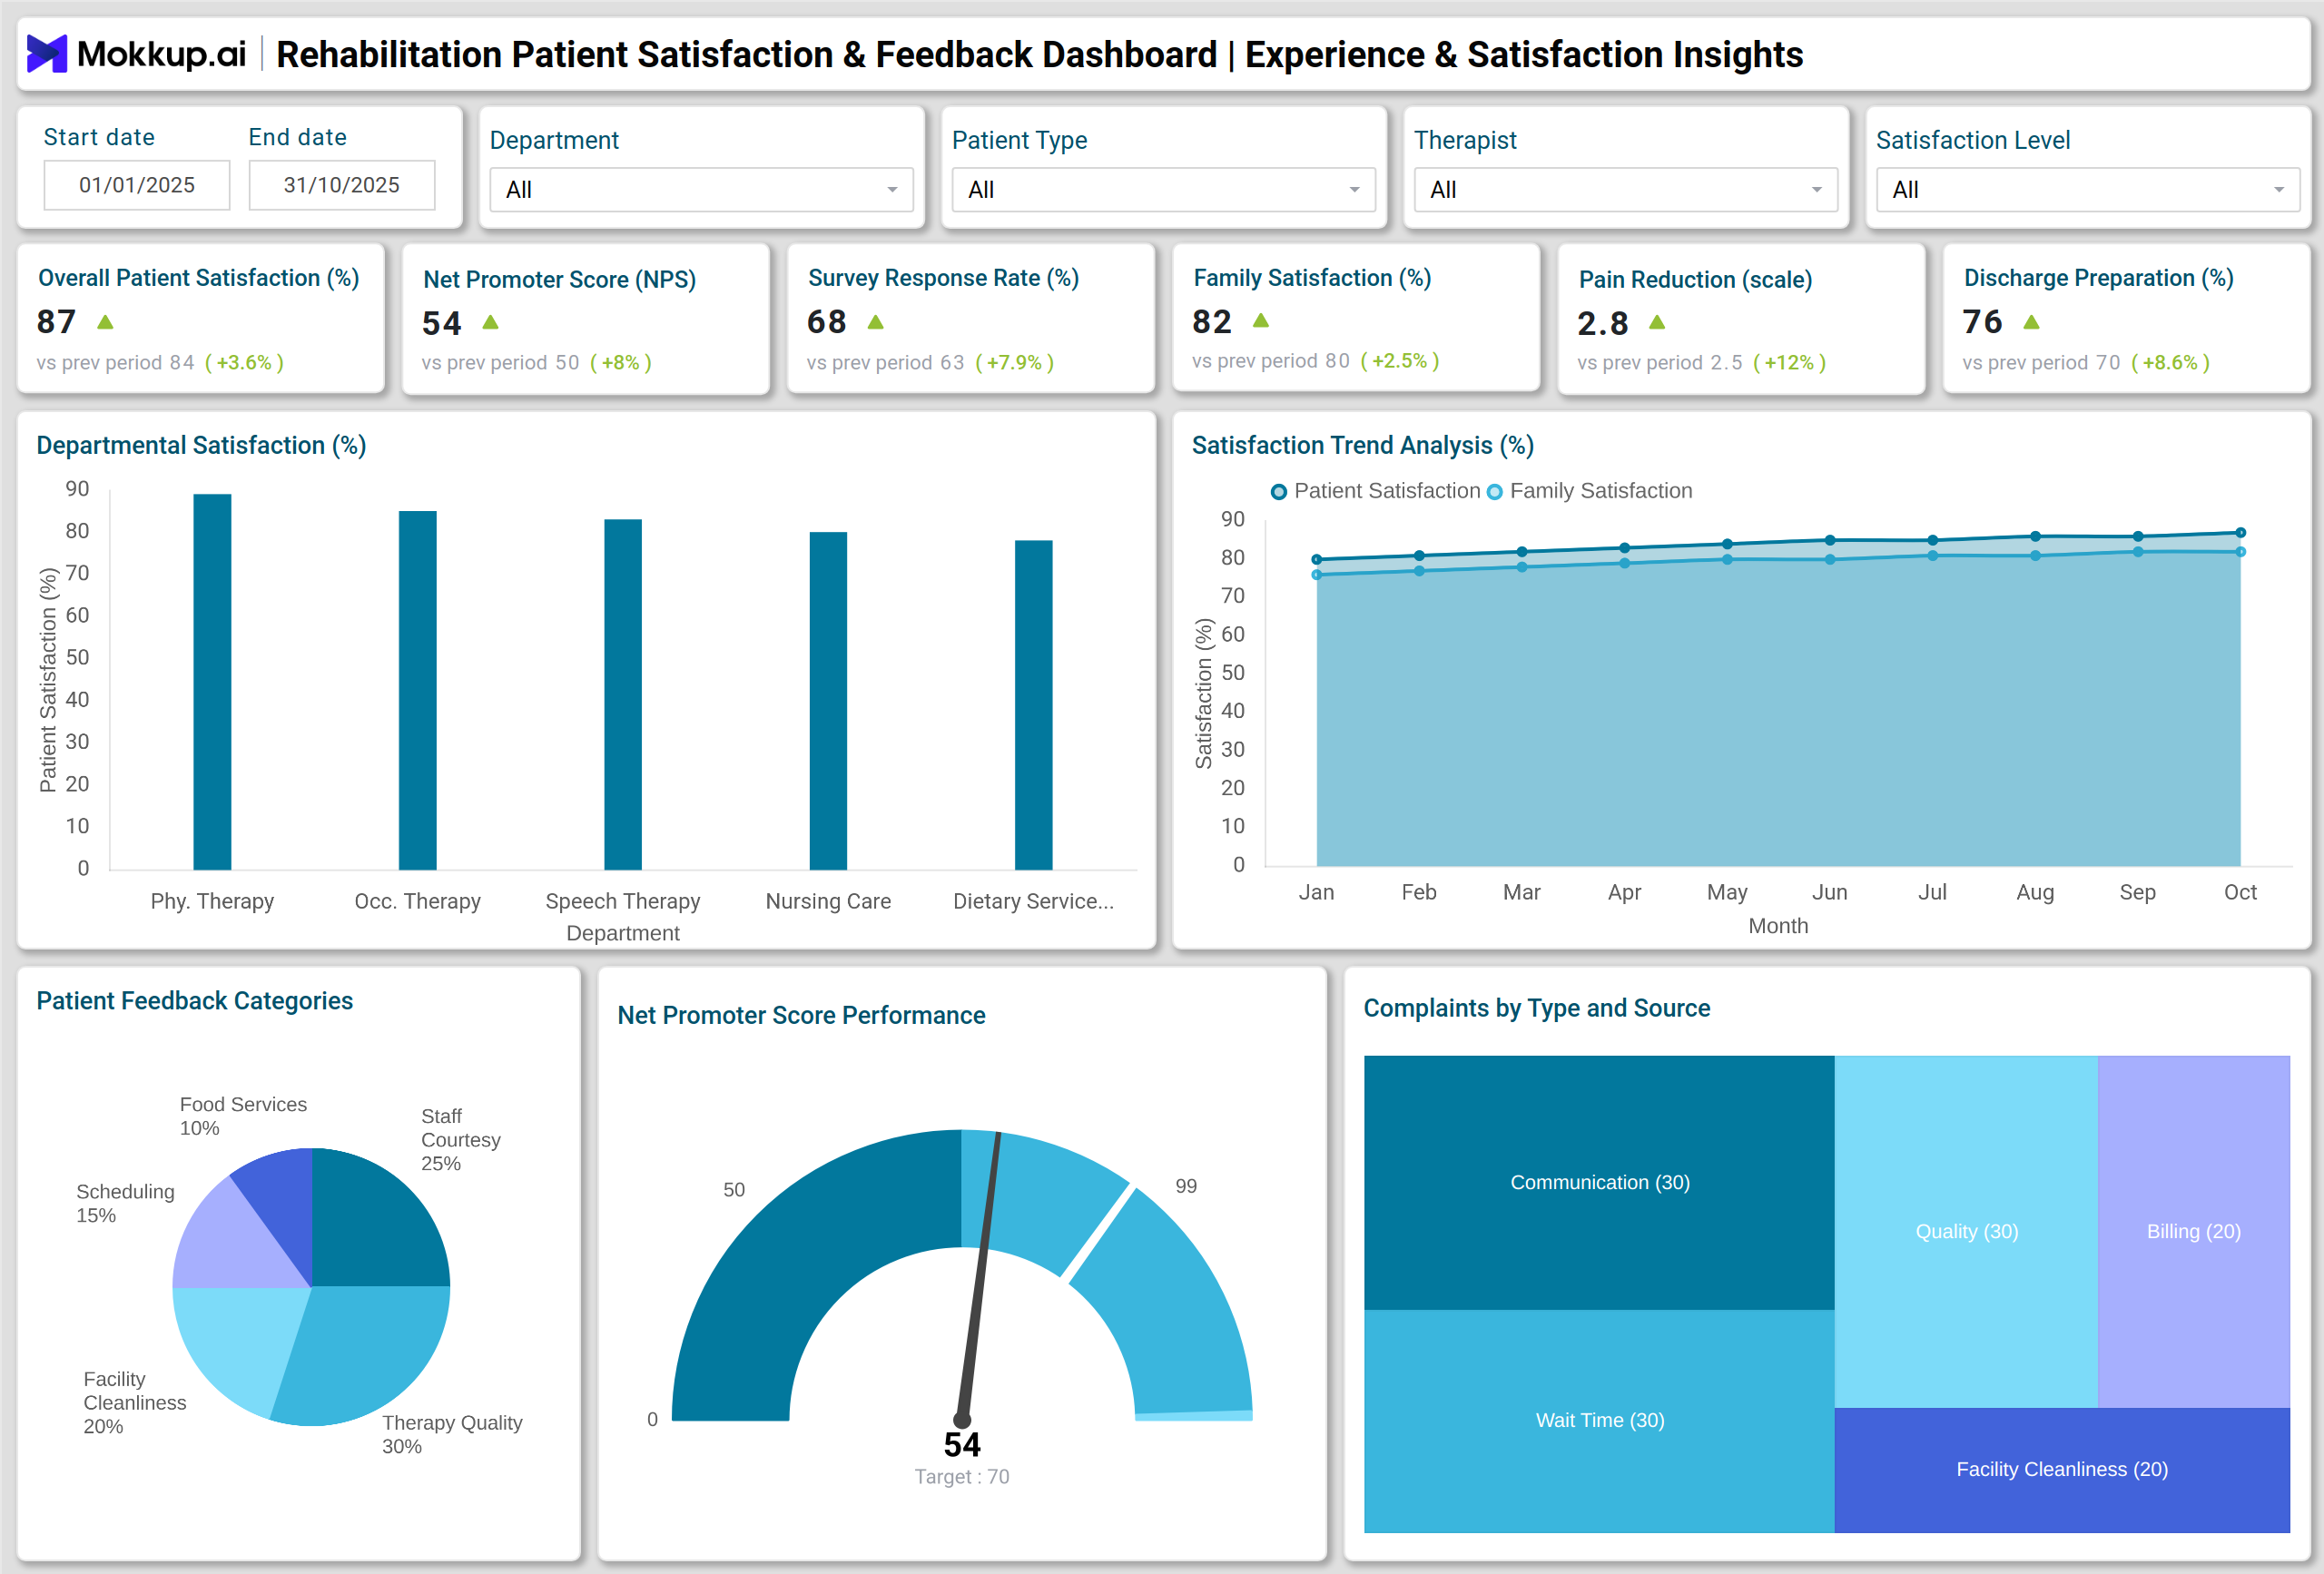
What is a Rehabilitation Patient Satisfaction & Feedback Dashboard?
A Rehabilitation Patient Satisfaction & Feedback Dashboard template is a data visualization tool designed to measure, track, and analyze patient and caregiver experiences within rehabilitation and long-term care centers. It provides healthcare administrators with actionable insights into patient satisfaction levels, therapy effectiveness, staff responsiveness, and service quality. By integrating patient feedback analytics for rehabilitation centers, the dashboard wireframe transforms survey data and input into measurable metrics. This helps identify strengths and areas for improvement in the rehabilitation process, from admission to discharge. For long-term care providers, this type of healthcare quality dashboard for long-term care ensures transparency and accountability in patient care standards.
Through data monitoring, care teams can correlate patient-reported outcomes such as pain reduction and therapy adherence with satisfaction scores. Ultimately, the rehabilitation patient satisfaction dashboard wireframe enables data-driven decisions that enhance both clinical and emotional aspects of patient recovery.
How to Create a Rehabilitation Patient Satisfaction & Feedback Dashboard
You don’t need to build your report from scratch—just start with a ready-to-use dashboard template from Mokkup. Add in your data and export it however you like. Here’s how to do it:
1. Create or Log in to Your Mokkup Account
Start by signing up on Mokkup.ai using your email. If you already have an account, just log in, and you’ll be good to go.
2. Choose and Customize Your Dashboard Template
Find the Rehabilitation Patient Satisfaction & Feedback Dashboard template in the Templates section. Use the drag-and-drop editor to adjust KPIs, edit filters, or add elements based on your data.
3. Export to Your BI Tool
Once your dashboard wireframe is ready, use the BI Tool Export feature to send it directly to Power BI or Tableau for further analysis and enhancements. You can also download the dashboard as a PDF, PNG, or JPEG, embed it on a platform, or invite your team to collaborate.
Note: This is a Pro template. You’ll need a Pro subscription on Mokkup to use and customize this dashboard wireframe. Upgrade anytime to unlock full access.
Rehabilitation Patient Satisfaction & Feedback Dashboard Example
A well-designed rehab center patient experience dashboard displays both quantitative metrics and qualitative insights across multiple dimensions of patient care. For example, the dashboard may include a Stacked Column Chart comparing monthly satisfaction rates across departments such as Physical Therapy, Occupational Therapy, and Speech Therapy. This helps detect trends in performance and service consistency over time. A Pie Chart showing the distribution of survey responses, whether collected through in-person interviews, email, or phone, reveals preferred communication channels among patients and families. Similarly, Bar Charts comparing patient and caregiver satisfaction across services help identify perception differences in quality of care.
Visuals, such as line charts, track progress in therapy and correlate it with pain reduction outcomes, while Heatmaps highlight complaint frequency by department and issue type. The Waterfall Chart illustrates how service factors, such as staff responsiveness and scheduling ease, contribute to improvements in overall satisfaction. By integrating all these data points, the rehabilitation performance tracking dashboard provides a comprehensive and centralized view of experience and service quality within rehabilitation centers.
How to Analyze Data in Rehabilitation Patient Satisfaction & Feedback Dashboards
Rehabilitation centers can utilize satisfaction and feedback dashboards to continuously monitor patient experiences, identify service gaps, and enhance therapy outcomes through data-driven decision-making:
- Identify Satisfaction Trends: Monitor overall patient satisfaction scores over time to assess the impact of operational or clinical changes.
- Correlate Therapy Outcomes: Analyze links between pain reduction percentages and therapy adherence rates to evaluate treatment effectiveness.
- Assess Staff and Service Impact: Use the Waterfall Chart to understand how responsiveness, scheduling, and cleanliness contribute to satisfaction.
- Monitor Complaints and Resolutions: Track complaint rates and resolution time by department to ensure patient concerns are addressed efficiently.
- Compare Patient vs. Family Feedback: Use dual bar charts to assess differences in perceptions between patients and caregivers.
- Evaluate Communication Channels: Review response distribution by channel to optimize future feedback collection methods.
- Spot Departmental Issues: Use heatmaps to detect recurring problem areas that require operational or staffing improvements.
Benefits of Rehabilitation Patient Satisfaction & Feedback Dashboards
These dashboards enable healthcare facilities to enhance patient experiences, streamline operations, and foster continuous improvement in service quality:
- Data-Driven Decision-Making: Empowers healthcare administrators to base improvements on real-time performance data, enabling informed decisions.
- Enhanced Care Quality: Helps identify service gaps that directly influence patient satisfaction and recovery outcomes.
- Increased Transparency: Offers a clear overview of service delivery for patients, families, and management teams.
- Operational Efficiency: Reduces complaint resolution times by pinpointing recurring issues and optimizing workflows to enhance efficiency.
- Improved Patient Retention: Enhances satisfaction and trust, leading to higher retention and referral rates in rehabilitation care.
- Family Engagement: Provides valuable insights into caregiver satisfaction, promoting stronger family-provider collaboration.
KPIs to Track in Rehabilitation Patient Satisfaction & Feedback Dashboards
Key performance indicators enable rehabilitation facilities to monitor patient satisfaction, track recovery effectiveness, and enhance the overall patient experience:
- Overall Patient Satisfaction Score (%): Measures the overall perception of care quality and experience.
- Net Promoter Score (NPS): Tracks patient loyalty and willingness to recommend the facility.
- Survey Response Rate (%): Indicates the effectiveness of feedback collection efforts.
- Family/Caregiver Satisfaction (%): Measures family engagement and perceived quality of care.
- Pain Reduction (Patient-reported Change, %): Reflects the effectiveness of therapy interventions.
- Discharge Preparation / Understanding of Follow-up (Top-box %): Assesses patient readiness and comprehension post-discharge.
- Rate of Patient Complaints (%): Identifies the proportion of patients reporting dissatisfaction.
These patient satisfaction metrics for rehab facilities provide clear visibility into care quality, operational efficiency, and therapy outcomes.
Frequently Asked Questions
Q1. Why is patient satisfaction important in rehabilitation care?
Patient satisfaction has a direct influence on recovery outcomes, adherence to therapy, and overall trust in healthcare providers. Monitoring satisfaction helps maintain care quality standards.
Q2. How can rehabilitation centers use dashboards to improve services?
By analyzing real-time metrics and feedback, administrators can identify bottlenecks, track progress, and make targeted improvements in staff performance, scheduling, and care delivery.
Q3. Can family feedback be included in these dashboards?
Yes. Family and caregiver satisfaction metrics provide additional insight into communication effectiveness, environment quality, and emotional support levels.
Q4. How often should data be reviewed?
Monthly or quarterly reviews are ideal for tracking trends and implementing timely improvements in patient experience and service delivery.