What is a Geothermal Well Monitoring & Reliability Dashboard?
A geothermal well monitoring dashboard is a centralized digital platform that monitors the operational health, sensor reliability, and performance stability of geothermal wells. It aggregates real-time and historical data from distributed sensor networks to provide continuous visibility into well conditions, including pressure, temperature, flow, acoustic signals, and chemical indicators. By consolidating sensor uptime, communication latency, anomaly alerts, and failure incidents, the dashboard serves as a geothermal well reliability dashboard that helps utilities maintain safe, uninterrupted geothermal production.
It enables operations teams, reliability engineers, and IT monitoring teams to detect performance degradation early and reduce unplanned well shutdowns. As a geothermal healthy performance monitoring system, the dashboard integrates IT and operational data streams to support predictive maintenance, anomaly detection, and asset health monitoring. When deployed across multiple wells and regions, it becomes a full geothermal asset reliability monitoring dashboard, supporting data-driven decision-making and digitally enabled utility operations.
How to Create a Geothermal Well Monitoring & Reliability Dashboard
You don’t need to build your report from scratch, just start with a ready-to-use dashboard template from Mokkup. Add in your data and export it however you like. Here’s how to do it:
1. Create or Log in to Your Mokkup Account
Start by signing up on Mokkup.ai using your email. If you already have an account, just log in, and you’ll be good to go.
2. Choose and Customize Your Dashboard Template
Find the Geothermal Well Monitoring & Reliability Dashboard template in the Templates section. Use the drag-and-drop editor to adjust KPIs, edit filters, or add elements based on your data.
3. Export to Your BI Tool
Once your dashboard wireframe is ready, use the BI Tool Export feature to send it directly to Power BI or Tableau for further analysis and enhancements. You can also download the dashboard as a PDF, PNG, or JPEG, embed it on a platform, or invite your team to collaborate.
Note: This is a Pro template. You’ll need a Pro subscription on Mokkup to use and customize this dashboard wireframe. Upgrade anytime to unlock full access.
Geothermal Well Monitoring & Reliability Dashboard Example
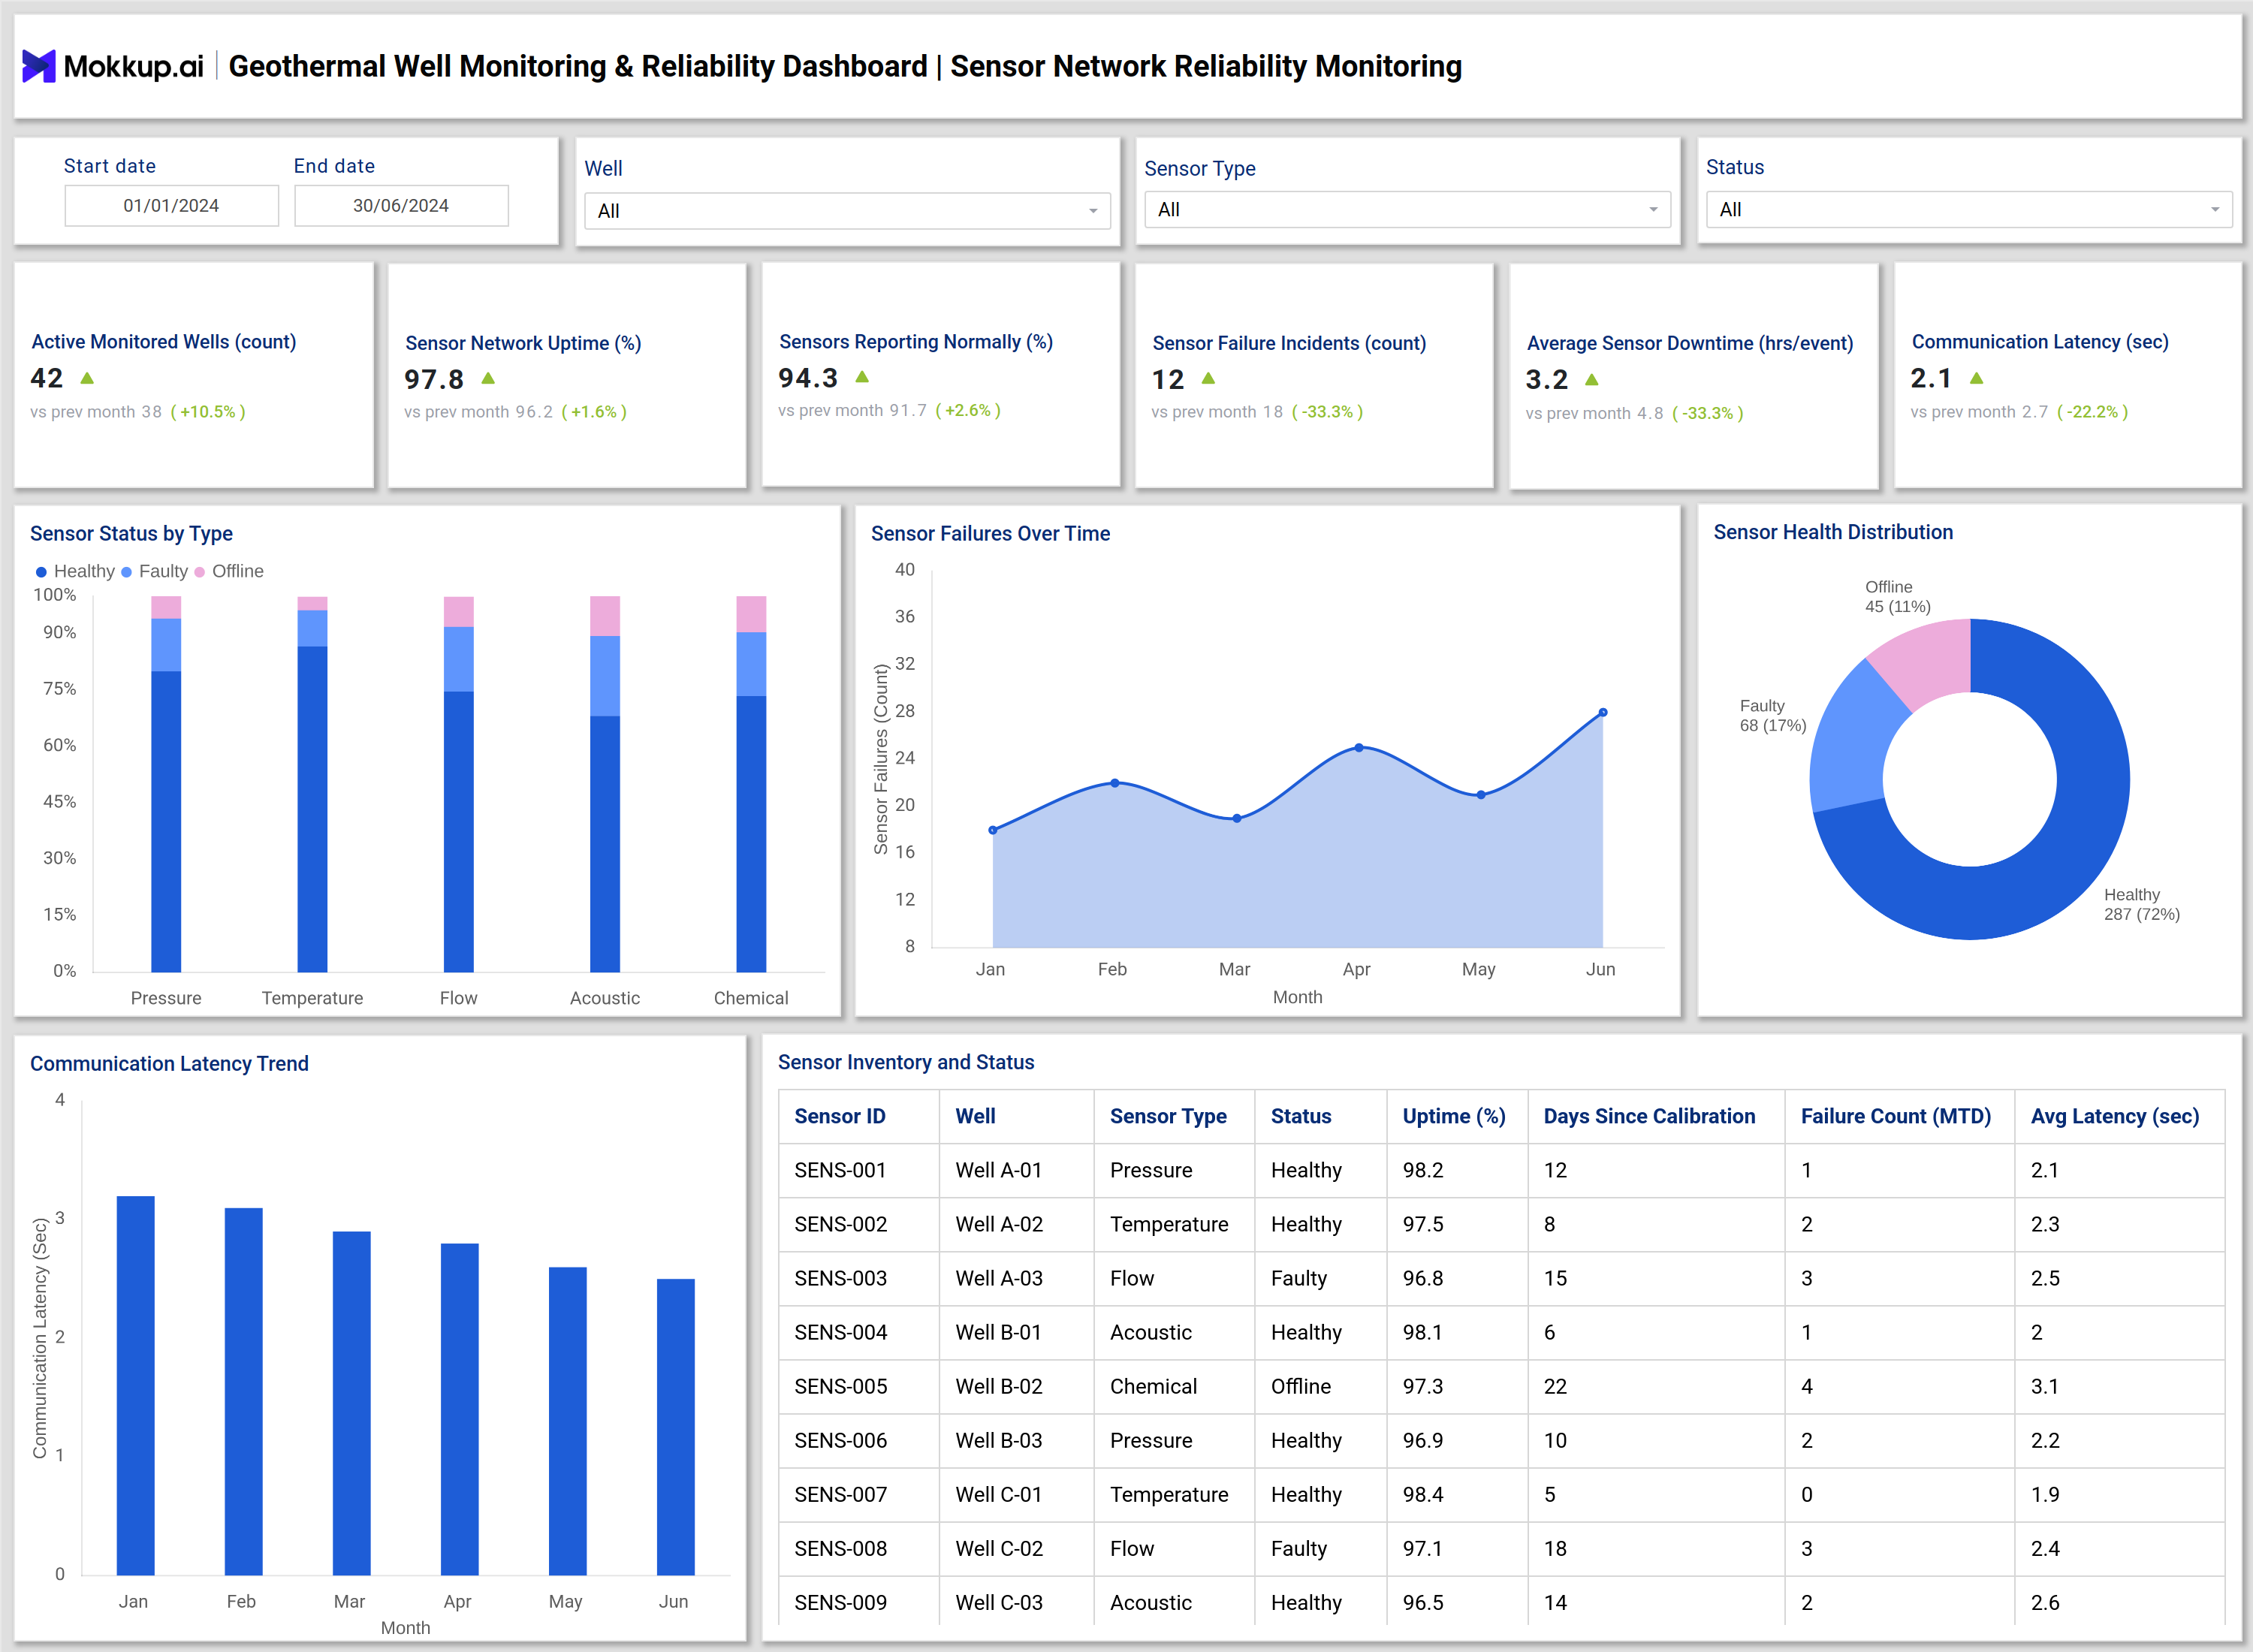
You can build a Geothermal Well Monitoring & Reliability Dashboard by combining real-time sensor network monitoring with advanced anomaly detection and reliability analytics across geothermal assets. The dashboard is typically organized into two core views: Sensor Network Reliability Monitoring and Reliability & Anomaly Monitoring. The Sensor Network Reliability Monitoring view focuses on the digital health of well instrumentation and communication infrastructure. It tracks active monitored wells, sensor network uptime, sensors reporting usually, sensor failure incidents, average sensor downtime, and communication latency. Visuals such as sensor status by type and sensor health distribution provide quick insight into the reliability of instrumentation across pressure, temperature, flow, acoustic, and chemical sensors. Trend charts highlight sensor failure patterns and latency behavior, while detailed sensor inventory tables support maintenance planning and calibration tracking.
The Reliability & Anomaly Monitoring view provides operational oversight of geothermal well performance and risk. It monitors wells operating within normal ranges, anomaly alerts triggered, false favorable alert rates, mean time to detect anomalies, mean time to respond, and unplanned well shutdowns. Time-based trend charts show improvements in detection accuracy and response efficiency, while alert severity distribution and incident logs provide actionable context for each anomaly. Together, these components form a comprehensive geothermal well performance monitoring system that supports reliable, digitally enabled geothermal operations.
How to Analyze Data in Geothermal Well Monitoring & Reliability Dashboard
Here is how you can analyze data from this dashboard:
- Review sensor network uptime to assess the overall reliability of the monitoring infrastructure.
- Monitor the percentage of sensors reporting usually to identify data gaps.
- Analyze sensor failure incidents and downtime trends to prioritize maintenance.
- Track communication latency to ensure real-time data transmission performance.
- Review sensor status by type to detect instrumentation-specific issues.
- Monitor wells operating within normal ranges to identify early performance deviations.
- Analyze anomaly alert trends to evaluate detection effectiveness.
- Review false favorable alert rates to improve alert accuracy.
- Compare the mean time to detect and the mean time to respond to assess operational responsiveness.
- Track unplanned well shutdowns to reduce production risk and downtime.
Benefits of Geothermal Well Monitoring & Reliability Dashboard
The following are the benefits of using this dashboard:
- Improves real-time visibility into geothermal well performance and health.
- Enhances sensor network reliability and data quality.
- Reduces unplanned well shutdowns through early anomaly detection.
- Supports predictive maintenance and reliability engineering initiatives.
- Improves response time to operational incidents.
- Enables centralized monitoring of geographically distributed wells.
- Strengthens IT and OT integration for digital utility operations.
- Supports data-driven asset reliability management
KPIs to Track in Geothermal Well Monitoring & Reliability Dashboard
The following key KPIs can be tracked by using this dashboard:
- Active Monitored Wells (count): Shows the total number of geothermal wells actively monitored by the system.
- Sensor Network Uptime (%): Measures the percentage of time the sensor network remains operational and available.
- Sensors Reporting Normally (%): Indicates the percentage of sensors transmitting valid, accurate data.
- Sensor Failure Incidents (count): Tracks the number of sensor malfunctions detected during the period.
- Average Sensor Downtime (hours/event): Calculates the average time a sensor remains offline per failure incident.
- Communication Latency (seconds): The time delay between the transmission of sensor data and its receipt by the system.
- Wells Within Normal Operating Range (%): Shows the percentage of wells operating within defined performance thresholds.
- Anomaly Alerts Triggered (count): Counts the number of abnormal operating condition alerts generated.
- False Positive Alert Rate (%): Measures the percentage of anomaly alerts that do not correspond to real issues.
- Mean Time to Detect Anomaly (minutes): The average time to identify abnormal healthy behavior.
- Mean Time to Respond (minutes): Measures the average time required to initiate corrective action after detection.
- Unplanned Well Shutdowns (count): Tracks the number of unexpected geothermal well shutdown events.
Frequently Asked Questions
1. Why is a geothermal well monitoring dashboard important?
It provides continuous visibility into well health, sensor reliability, and operational risk, helping utilities maintain stable geothermal production.
2. What type of data does the dashboard monitor?
It monitors sensor uptime, communication latency, well performance parameters, anomaly alerts, and response metrics.
3. Who uses a geothermal well reliability dashboard?
Operations teams, reliability engineers, IT monitoring teams, and asset managers.
4. How does the dashboard reduce unplanned downtime?
By detecting anomalies early and reducing response time to well performance issues.
5. Can the dashboard support multi-region geothermal operations?
Yes. Filters by well, region, sensor type, and alert severity support large-scale geothermal asset monitoring.