
What is a Geothermal Steam Utilization & Conversion Dashboard?
A Geothermal Steam Utilization & Conversion Dashboard is a centralized analytics platform used to monitor how effectively geothermal steam is converted into electrical power. It tracks steam flow, turbine efficiency, conversion efficiency, losses across stages, and plant availability to support operational decision-making in geothermal power plants. This dashboard functions as a geothermal steam-to-power conversion monitoring system by connecting steam production metrics with turbine and generator performance.
It enables operators to evaluate whether steam resources are being used efficiently and identify losses occurring before, during, and after the conversion process. By consolidating performance data across turbine units and auxiliary systems, the dashboard helps utilities optimize output while minimizing waste. As a geothermal steam utilization efficiency dashboard, it supports plant engineers and operations teams in maintaining stable generation, improving conversion ratios, and ensuring reliable power delivery from geothermal assets.
How to Create a Geothermal Steam Utilization & Conversion Dashboard
You don’t need to build your report from scratch, just start with a ready-to-use dashboard template from Mokkup. Add in your data and export it however you like. Here’s how to do it:
1. Create or Log in to Your Mokkup Account
Start by signing up on Mokkup.ai using your email. If you already have an account, just log in, and you’ll be good to go.
2. Choose and Customize Your Dashboard Template
Find the Geothermal Steam Utilization & Conversion Dashboard template in the Templates section. Use the drag-and-drop editor to adjust KPIs, edit filters, or add elements based on your data.
3. Export to Your BI Tool
Once your dashboard wireframe is ready, use the BI Tool Export feature to send it directly to Power BI or Tableau for further analysis and enhancements. You can also download the dashboard as a PDF, PNG, or JPEG, embed it on a platform, or invite your team to collaborate.
Note: This is a Pro template. You’ll need a Pro subscription on Mokkup to use and customize this dashboard wireframe. Upgrade anytime to unlock full access.
Geothermal Steam Utilization & Conversion Dashboard Example
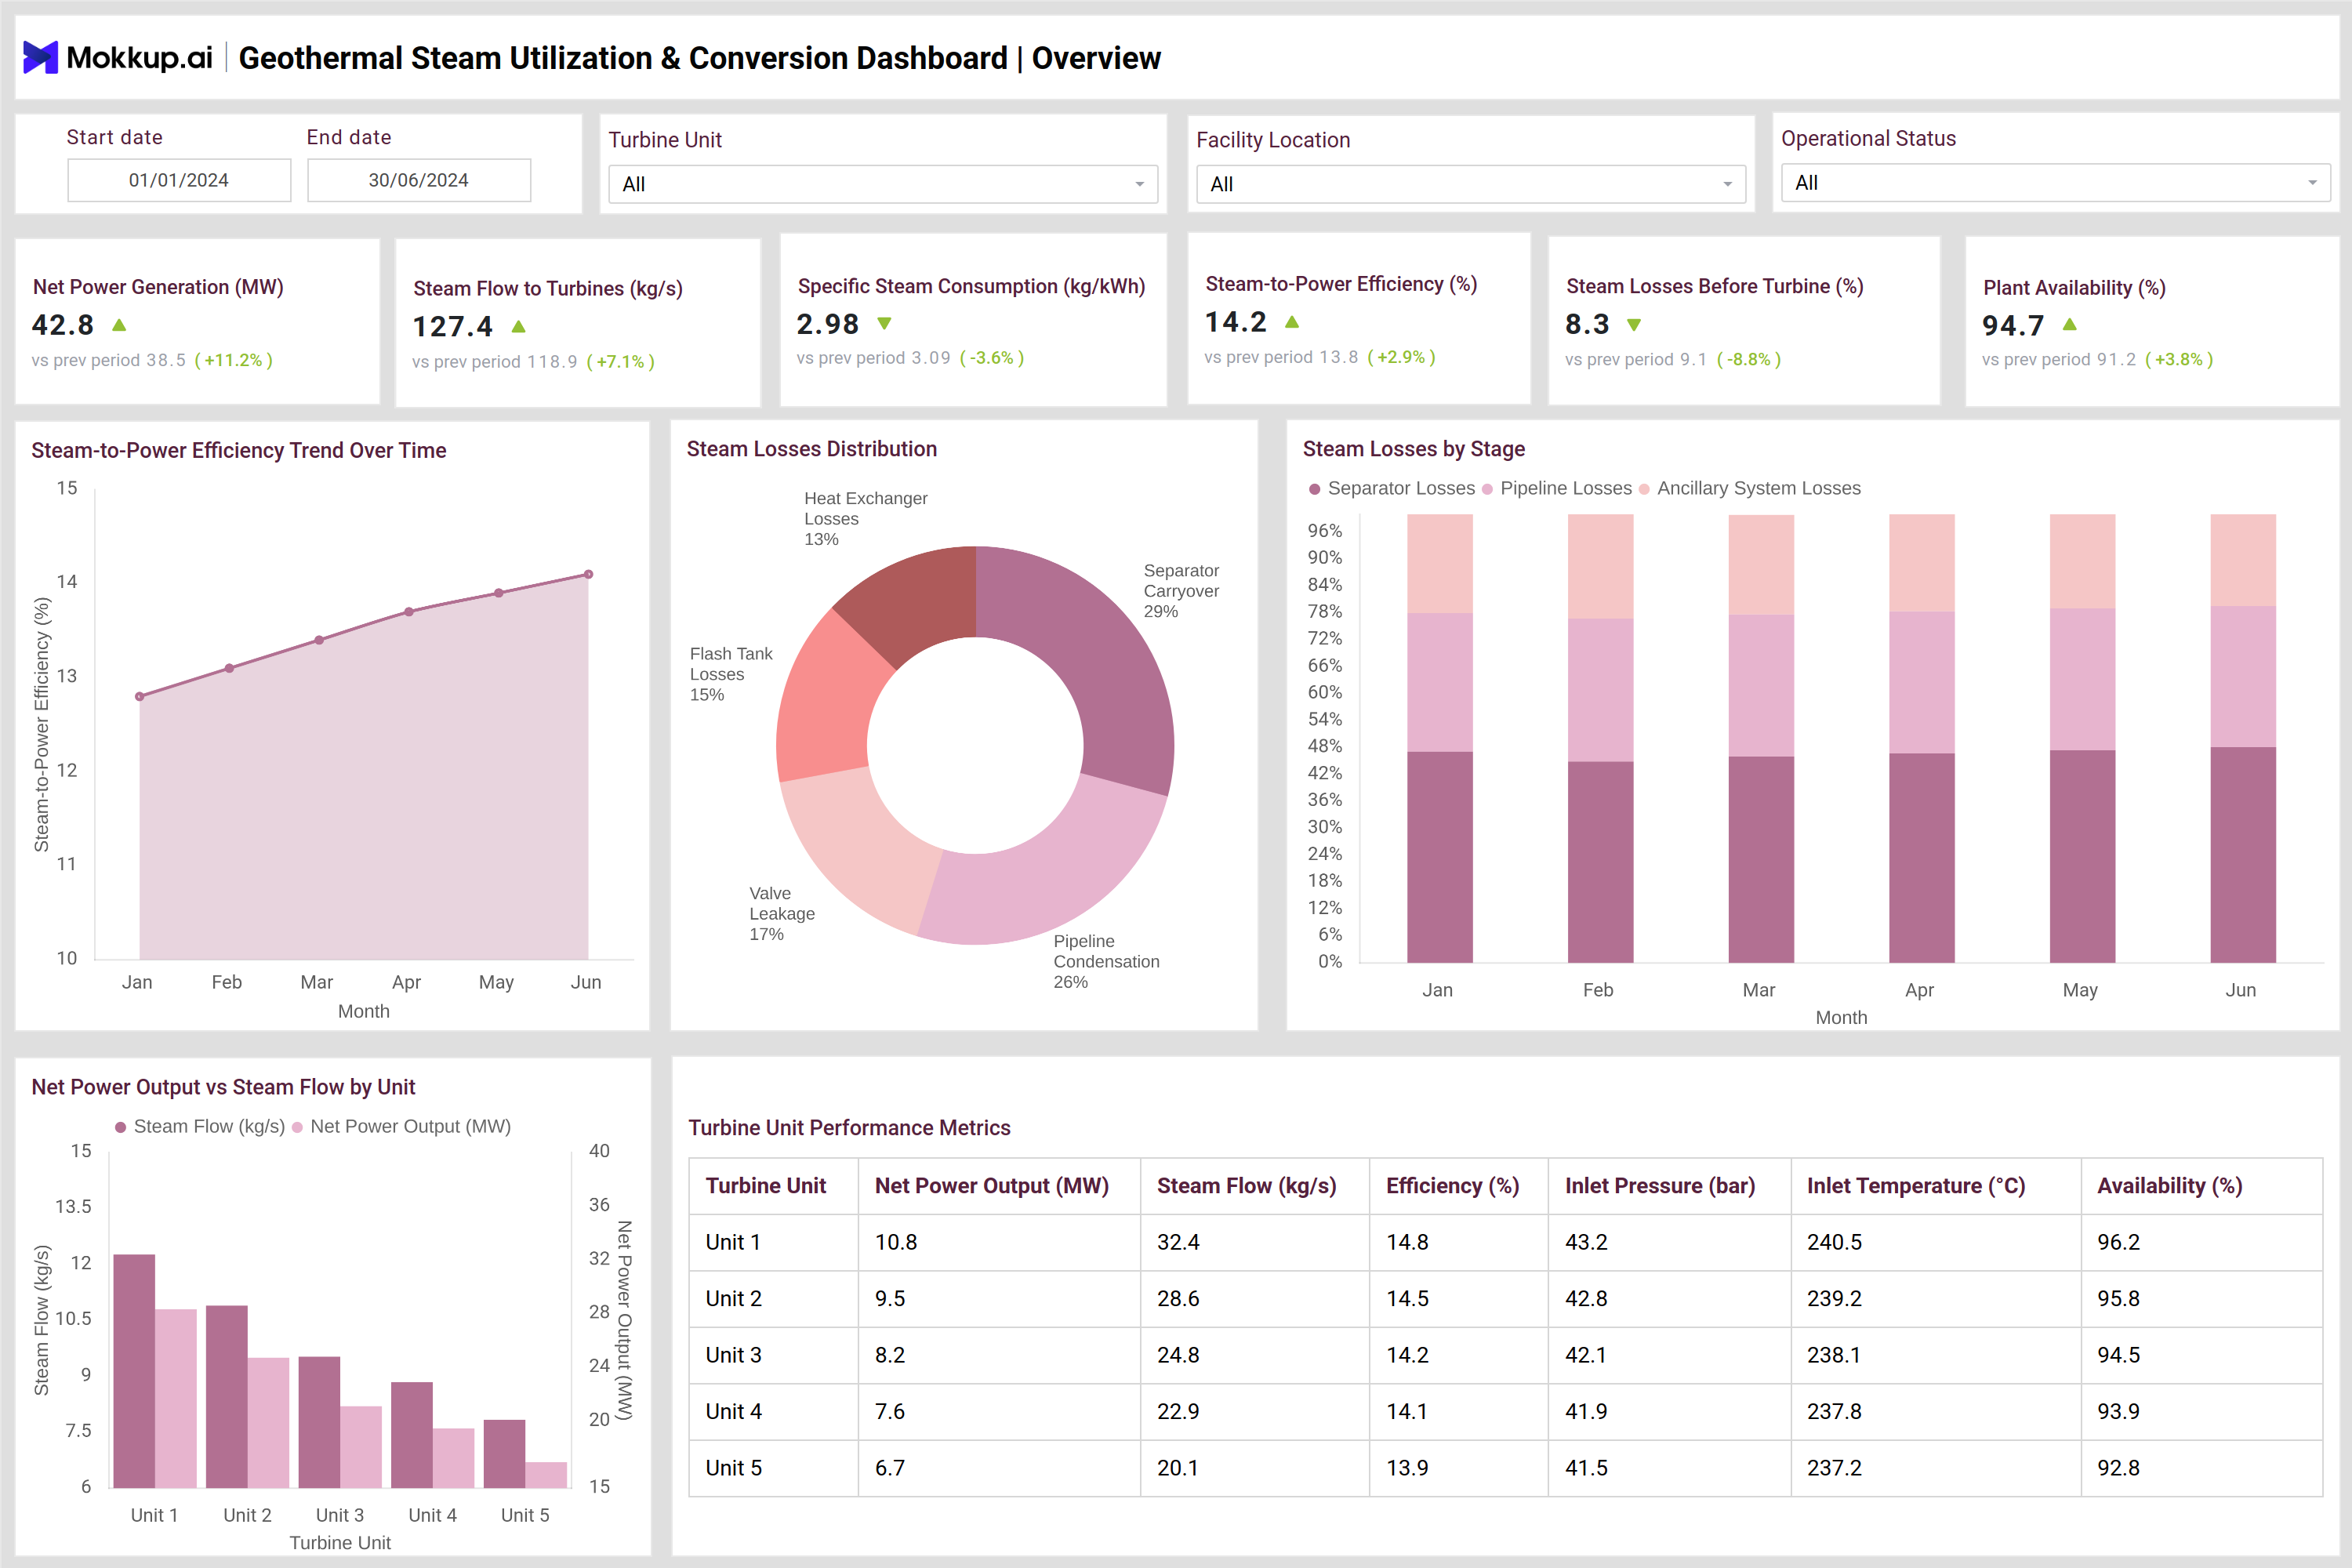
You can build a Geothermal Steam Utilization & Conversion Dashboard using two primary analytical views: Steam Utilization Overview and Turbine Efficiency & Losses. The Overview section focuses on high-level plant performance. It tracks net power generation, steam flow to turbines, specific steam consumption, steam-to-power efficiency, steam losses before turbines, and overall plant availability. These indicators provide a clear picture of how steam input translates into usable electrical output. Trend charts display changes in steam-to-power efficiency over time, helping operators detect gradual performance improvements or emerging inefficiencies.Steam loss distribution visuals break down losses across separators, pipelines, valves, flash tanks, and heat exchangers. Stage-wise loss analysis further highlights where steam energy is lost before reaching turbines.
Efficiency-versus-load analysis highlights optimal operating ranges, while condenser vacuum versus output analysis shows how condenser performance impacts power generation. Energy loss distribution charts identify major loss contributors such as turbine losses, condenser losses, auxiliary loads, and electrical losses. Auxiliary power breakdown visualizes internal energy consumption across pumps, fans, lubrication systems, and control equipment. The optimization opportunities table compares current performance with best-practice benchmarks, helping operators prioritize efficiency improvement initiatives. Together, these views form a comprehensive geothermal steam energy conversion analytics platform and geothermal steam operations monitoring dashboard.
How to Analyze Data in Geothermal Steam Utilization & Conversion Dashboard
Here is how you can analyze data from this dashboard:
- Review net power generation and steam flow trends to assess overall conversion effectiveness.
- Compare specific steam consumption values to identify efficiency improvements or degradation.
- Monitor steam-to-power efficiency trends to track long-term conversion performance.
- Analyze steam losses before turbines to identify upstream inefficiencies.
- Compare turbine unit output versus steam flow to identify underperforming units.
- Review turbine and generator efficiency metrics to assess mechanical and electrical performance.
- Analyze heat rate trends to understand energy input versus output effectiveness.
- Evaluate condenser vacuum performance and its impact on net power output.
- Review energy loss distribution to identify dominant loss contributors.
- Use auxiliary power breakdown to reduce internal energy consumption.
Benefits of Geothermal Steam Utilization & Conversion Dashboard
The following are the benefits of using this dashboard:
- Improves visibility into steam utilization and power conversion performance.
- Helps reduce steam and energy losses across conversion stages.
- Supports optimization of turbine and generator efficiency.
- Enables early detection of declining conversion efficiency.
- Improves plant availability and operational stability.
- Supports data-driven efficiency improvement initiatives.
- Enhances the reliability of geothermal power generation.
- Provides centralized operational insights for utilities.
KPIs to Track in Geothermal Steam Utilization & Conversion Dashboard
The following key KPIs can be tracked by using this dashboard:
- Net Power Generation (MW): Measures the total electrical power produced from geothermal steam after conversion losses.
- Steam Flow to Turbines (kg/s): Tracks the amount of geothermal steam supplied to turbines for power generation.
- Specific Steam Consumption (kg/kWh): Indicates how much steam is required to generate one unit of electricity.
- Steam-to-Power Efficiency (%): Measures how efficiently steam energy is converted into electrical power.
- Steam Losses Before Turbine (%): Quantifies steam energy lost before reaching the turbine inlet.
- Plant Availability (%): Shows the percentage of time the geothermal plant remains operational and available.
- Turbine Efficiency (%): Evaluates how effectively turbines convert steam energy into mechanical power.
- Generator Efficiency (%): Measures the efficiency of converting mechanical turbine energy into electricity.
- Overall Conversion Efficiency (%): Represents combined efficiency across steam utilization, turbine, and generator stages.
- Heat Rate (kJ/kWh): Indicates the amount of thermal energy required to produce one kilowatt-hour of electricity.
- Energy Loss Distribution (%): Breaks down where energy losses occur across turbines, condensers, and auxiliaries.
- Auxiliary Power Consumption (%): Measures the share of generated power consumed by internal plant systems.
Frequently Asked Questions
1. Why is a geothermal steam utilization dashboard important?
It helps utilities measure how effectively steam resources are converted into electricity and identify efficiency losses.
2. Who uses this dashboard in a power plant?
Operations engineers, performance analysts, maintenance teams, and plant managers.
3. How does the dashboard improve conversion efficiency?
By highlighting steam losses, turbine inefficiencies, and auxiliary power consumption.
4. Can this dashboard support optimization planning?
Yes. Benchmark comparisons and improvement potential analysis guide efficiency initiatives
5. Does the dashboard support multi-unit power plants?
Yes. Unit-level filters and performance comparisons allow detailed analysis across turbines.