What is a Geothermal Plant Regulatory & Compliance Dashboard?
A Geothermal Plant Regulatory & Compliance Dashboard Template is a centralized digital platform that monitors, tracks, and manages regulatory obligations across geothermal power plant operations. It consolidates environmental compliance data, permit adherence metrics, monitoring station performance, fluid management records, and corrective action status into a single operational view.
This dashboard wireframe supports regulatory teams, plant managers, and environmental engineers by providing real-time visibility into compliance performance against statutory limits and permit conditions. By integrating environmental monitoring results, permit utilization trends, and audit outcomes, the geothermal regulatory compliance dashboard enables continuous oversight of compliance. It helps organizations meet ecological regulations on water quality, chemical discharges, reinjection practices, and groundwater protection. The dashboard wireframe also serves as a geothermal regulatory reporting system, maintaining structured records for inspections, audits, and regulatory submissions, thereby reducing compliance risk and manual reporting effort.
How to Create a Geothermal Plant Regulatory & Compliance Dashboard
You don’t need to build your report from scratch; just start with a ready-to-use Geothermal Plant Regulatory & Compliance dashboard template from Mokkup. Add in your data and export it however you like. Here’s how to do it:
1. Create or Log in to Your Mokkup Account
Start by signing up on Mokkup.ai using your email. If you already have an account, just log in, and you’ll be good to go.
2. Choose and Customize Your Dashboard Template
Find the Geothermal Plant Regulatory & Compliance Dashboard template in the Templates section. Use the drag-and-drop editor to adjust KPIs, edit filters, or add elements based on your data.
3. Export to Your BI Tool
Once your dashboard wireframe is ready, use the BI Tool Export feature to send it directly to Power BI or Tableau for further analysis and enhancements. You can also download the dashboard as a PDF, PNG, or JPEG, embed it on a platform, or invite your team to collaborate.
Note: This is a Pro template. You’ll need a Pro subscription on Mokkup to use and customize this dashboard wireframe. Upgrade anytime to unlock full access.
Geothermal Plant Regulatory & Compliance Dashboard Example
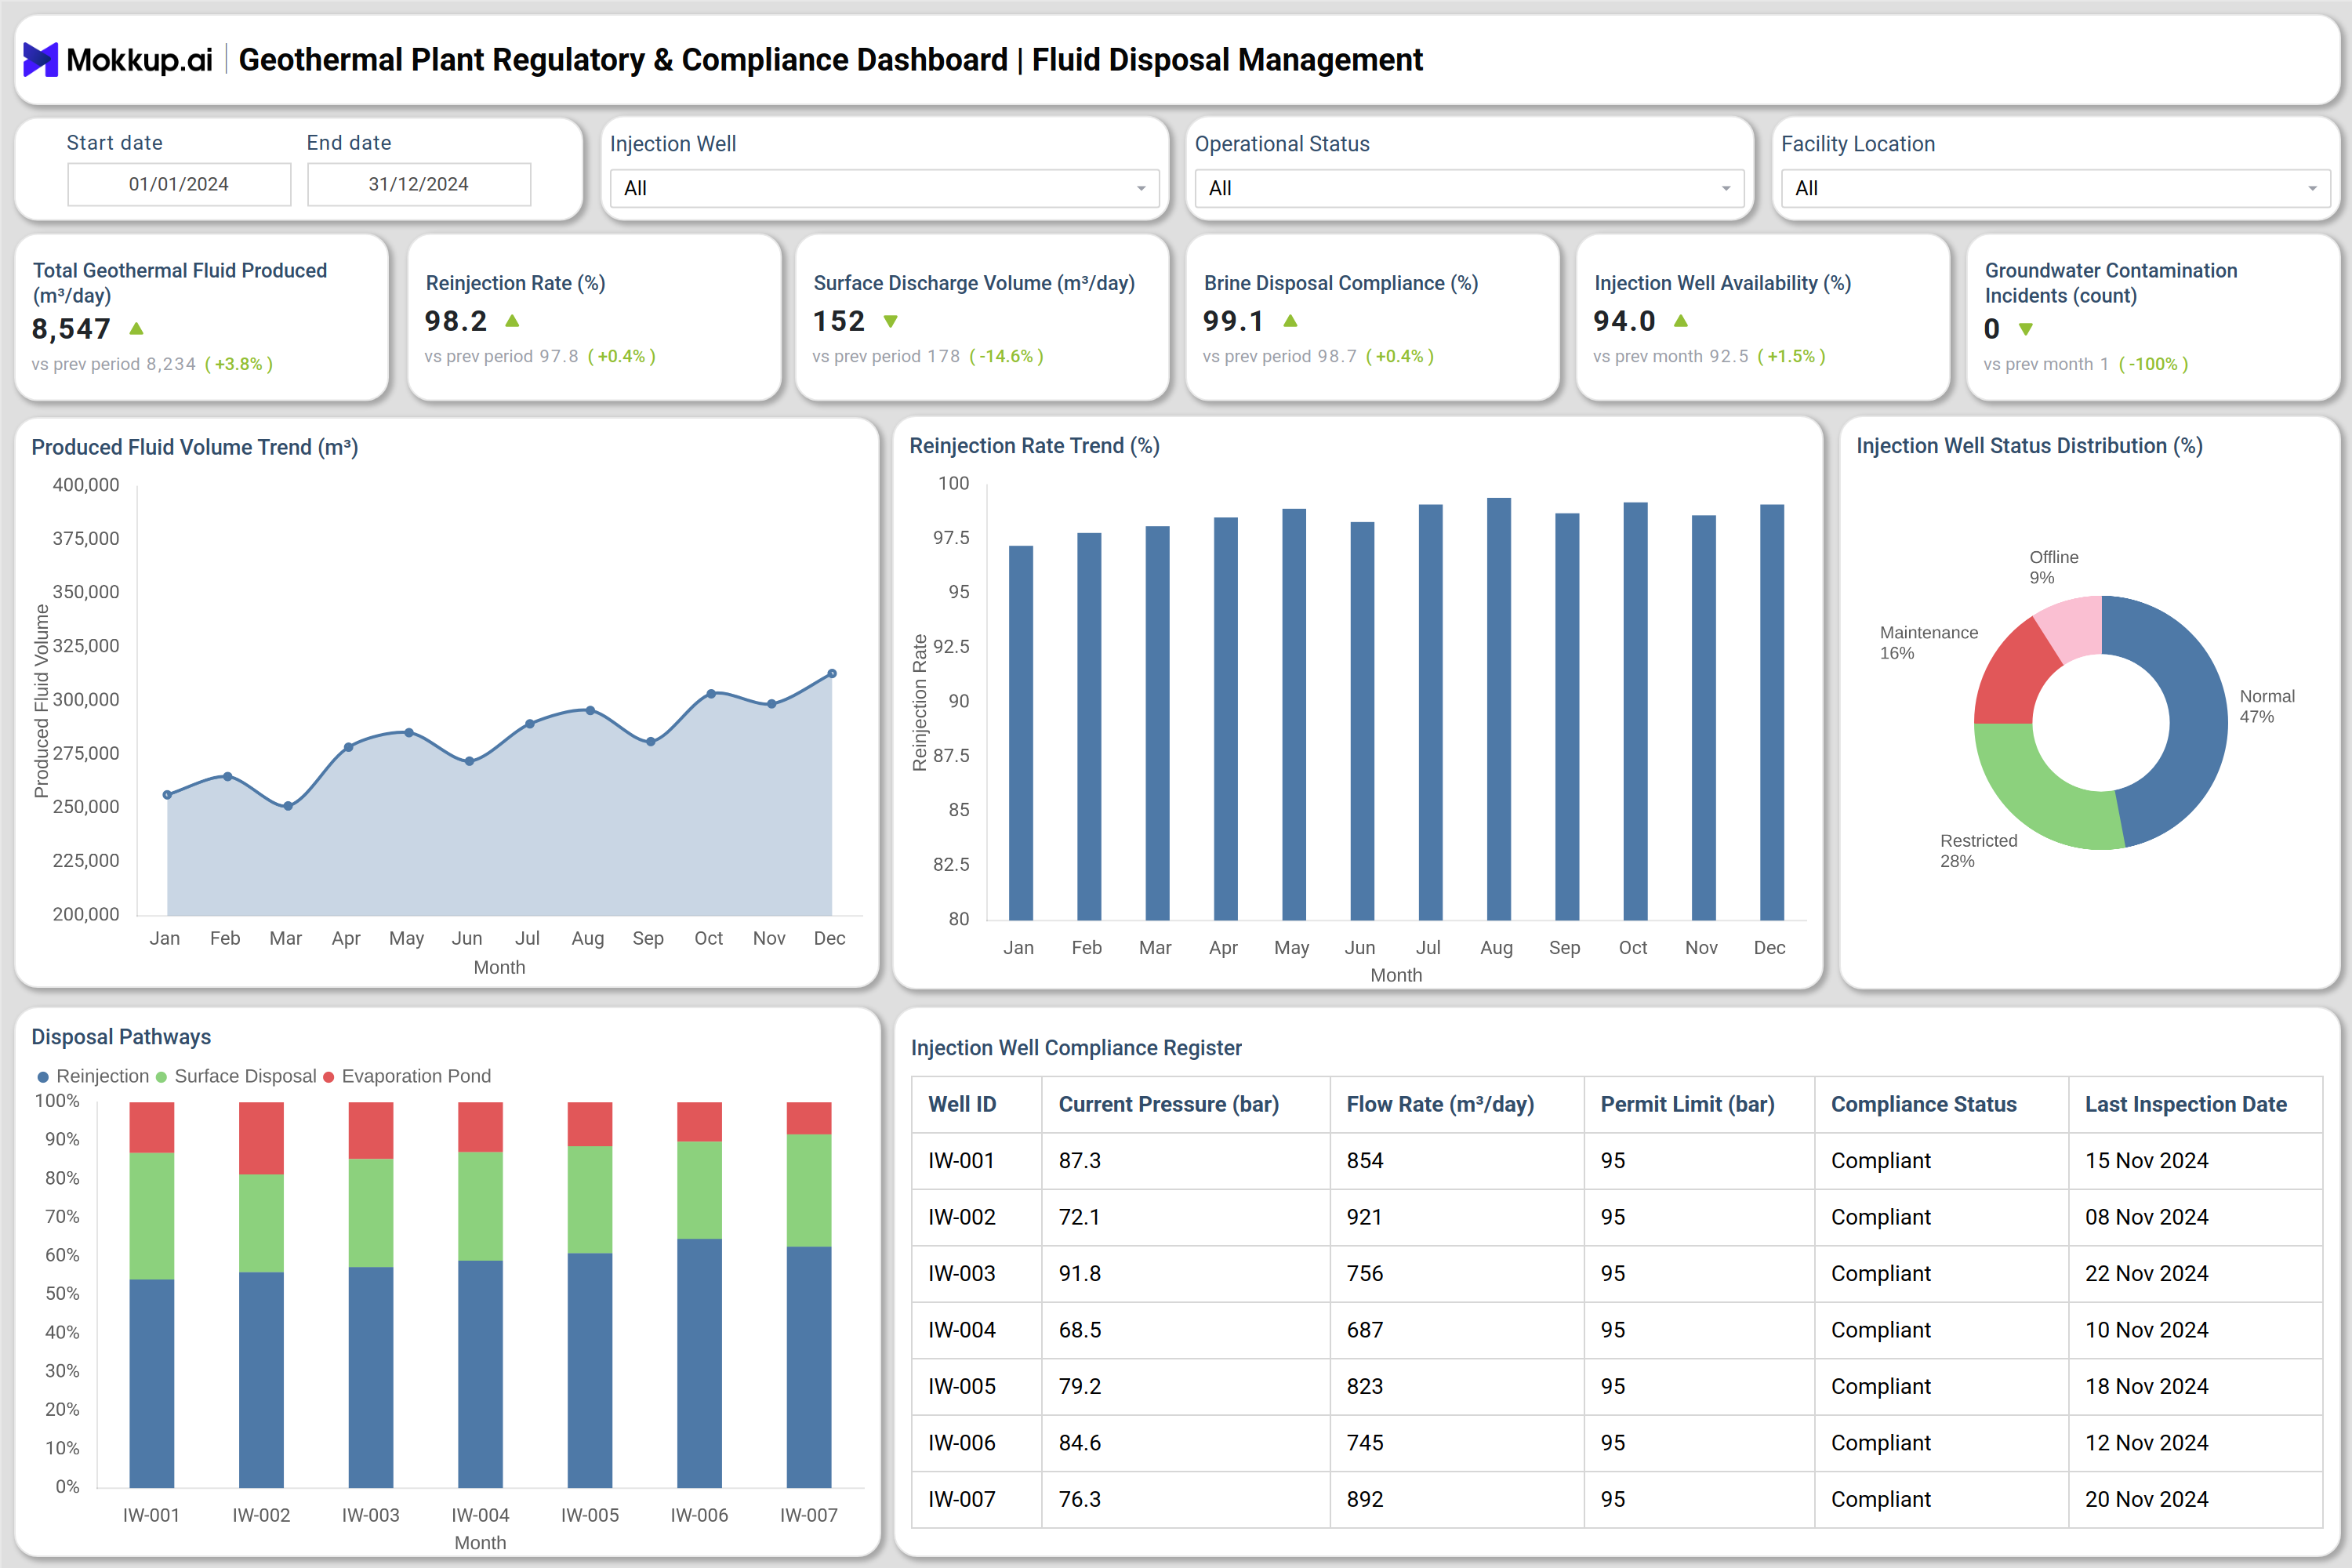
You can build a geothermal plant regulatory & compliance dashboard using the modules shown in the reference images to cover environmental permits, monitoring results, and fluid management compliance in one integrated system. The dashboard typically begins with high-level KPIs such as environmental compliance rate, permit exceedances, water quality samples within limits, monitoring station uptime, chemical discharge exceedances, and corrective actions closed on time. These indicators provide an immediate snapshot of overall regulatory health. The permits and environmental compliance section visualizes permit utilization versus limits, monthly compliance distribution, and exceedances by environmental parameters such as arsenic, boron, chloride, silica, turbidity, and dissolved oxygen.
Supporting charts highlight whether measurements remain within limits, approach thresholds, or exceed regulatory values. Detailed corrective action logs track identified issues, due dates, and closure timelines, enabling effective geothermal permit compliance tracking. The fluid management module extends compliance monitoring to geothermal fluid production and reinjection activities. It displays produced fluid volumes, reinjection rates, surface discharge volumes, brine disposal compliance, and injection well availability. Visual trend analysis and injection well compliance registers ensure alignment with reinjection permits and groundwater protection requirements. Together, these modules form a complete geothermal compliance management dashboard supporting environmental and operational governance.
How to Analyze Geothermal Plant Regulatory & Compliance Dashboard
Here is how you can analyze data from this dashboard:
- Monitor Overall Compliance Rate: Review the environmental compliance percentage to assess alignment with regulatory requirements across monitoring parameters.
- Track Permit Exceedances: Analyze exceedance counts and trends to identify recurring compliance risks or process deviations.
- Review Water Quality Results: Compare samples within limits versus near-limit or exceedance categories to anticipate regulatory breaches.
- Assess Monitoring Station Uptime: Ensure continuous data availability by tracking station uptime and identifying maintenance gaps.
- Evaluate Corrective Action Closure: Monitor corrective actions to ensure they are closed on time and prevent audit findings and regulatory penalties.
- Analyze Permit Utilization Trends: Compare actual utilization against permit limits to maintain operational headroom.
- Review Fluid Management Compliance: Track reinjection rates, surface discharge volumes, and brine disposal compliance.
- Validate Injection Well Status: Check injection well availability and compliance registers for inspection readiness.
Benefits of Geothermal Plant Regulatory & Compliance Dashboard
The following are the benefits of using this dashboard:
- Centralized Compliance Oversight: Centralizes geothermal regulatory and compliance monitoring in a single platform.
- Environmental Permit Visibility: Improves visibility into permit adherence, limits, and exceedances.
- Reduced Compliance Risk: Identifies regulatory deviations early to minimize penalties and operational risk.
- Streamlined Reporting & Audits: Simplifies regulatory reporting and accelerates audit preparation.
- Improved Data Accuracy & Traceability: Enhances the reliability and traceability of environmental monitoring data.
- Groundwater & Reinjection Compliance: Supports compliance with groundwater protection and reinjection permits.
- Corrective Action Management: Improves tracking, accountability, and closure timelines for compliance actions.
- Data-Driven Regulatory Decisions: Enable informed compliance and regulatory decisions across plant operations.
KPIs to Track in Geothermal Plant Regulatory & Compliance Dashboard
The following key KPIs can be tracked by using this dashboard:
- Environmental Compliance Rate (%): Measures the percentage of environmental parameters operating within regulatory limits.
- Permit Exceedances (count): Tracks the number of instances where permit thresholds are exceeded.
- Water Quality Samples Within Limits (%): Indicates compliance of sampled water quality data with regulatory standards.
- Monitoring Station Uptime (%): Reflects the reliability and availability of the environmental monitoring infrastructure.
- Chemical Discharge Exceedances (count): Measures incidents of chemical discharge beyond allowable limits.
- Environmental Audits Passed (count): Tracks successful regulatory and environmental audit outcomes.
- Corrective Actions Closed On Time (%): Evaluates the effectiveness of compliance issue resolution processes.
- Permit Utilization (%): Shows how much of the permitted limit is currently being used.
- Reinjection Rate (%): Measures compliance with geothermal fluid reinjection requirements.
- Surface Discharge Volume (m³/day): Tracks volume of fluid discharged at the surface for compliance control.
Frequently Asked Questions
Q1. Why is a geothermal plant regulatory & compliance dashboard important?
It enables continuous monitoring of environmental and permit compliance, reducing regulatory risk and audit exposure.
Q2. What regulations does the dashboard support?
It supports water quality, chemical discharge, reinjection, groundwater protection, and environmental permit regulations.
Q3. Can this dashboard help with regulatory audits?
Yes, it maintains structured compliance records, audit histories, and corrective action logs for inspections.
Q4. Who uses this dashboard in a geothermal plant?
Environmental managers, compliance officers, plant operations teams, and regulatory reporting personnel.
Q5. Does it support real-time environmental monitoring?
Yes, it integrates monitoring station data to provide near real-time compliance visibility.