What is a Geothermal Multi-Plant Benchmarking & Forecast Dashboard
A geothermal multi-plant benchmarking and forecasting dashboard is an enterprise analytics solution designed for electric power utilities operating multiple geothermal assets. It consolidates operational, financial, maintenance, and forecasting data across facilities into a single analytical view. The dashboard enables plant-level and portfolio-level comparison using standardized KPIs such as output per well, cost per MWh, plant efficiency, downtime hours, and forecast accuracy.
This solution functions as a geothermal asset performance monitoring and forecast dashboard, allowing executives to evaluate how each facility performs relative to others. It also supports predictive planning by combining historical generation data with forecasting models to anticipate production trends, maintenance impact, and efficiency shifts. As a geothermal plant efficiency comparison dashboard for utilities, it helps decision-makers identify underperforming plants, optimize capacity utilization, and allocate capital effectively across the geothermal portfolio.
How to Create a Geothermal Multi-Plant Benchmarking & Forecast Dashboard
You don't need to build your report from scratch, just start with a ready-to-use dashboard template from Mokkup. Add in your data and export it however you like. Here's how to do it:
1. Create or Log in to Your Mokkup Account
Start by signing up on Mokkup.ai using your email. If you already have an account, just log in, and you'll be good to go.
2. Choose and Customize Your Dashboard Template
Find the Geothermal Multi-Plant Benchmarking & Forecast Dashboard template in the Templates section. Use the drag-and-drop editor to adjust KPIs, edit filters, or add elements based on your data.
3. Export to Your BI Tool
Once your dashboard wireframe is ready, use the BI Tool Export feature to send it directly to Power BI or Tableau for further analysis and enhancements. You can also download the dashboard as a PDF, PNG, or JPEG, embed it on a platform, or invite your team to collaborate.
Note: This is a Pro template. You'll need a Pro subscription on Mokkup to use and customize this dashboard wireframe. Upgrade anytime to unlock full access.
Geothermal Multi-Plant Benchmarking & Forecast Dashboard Example
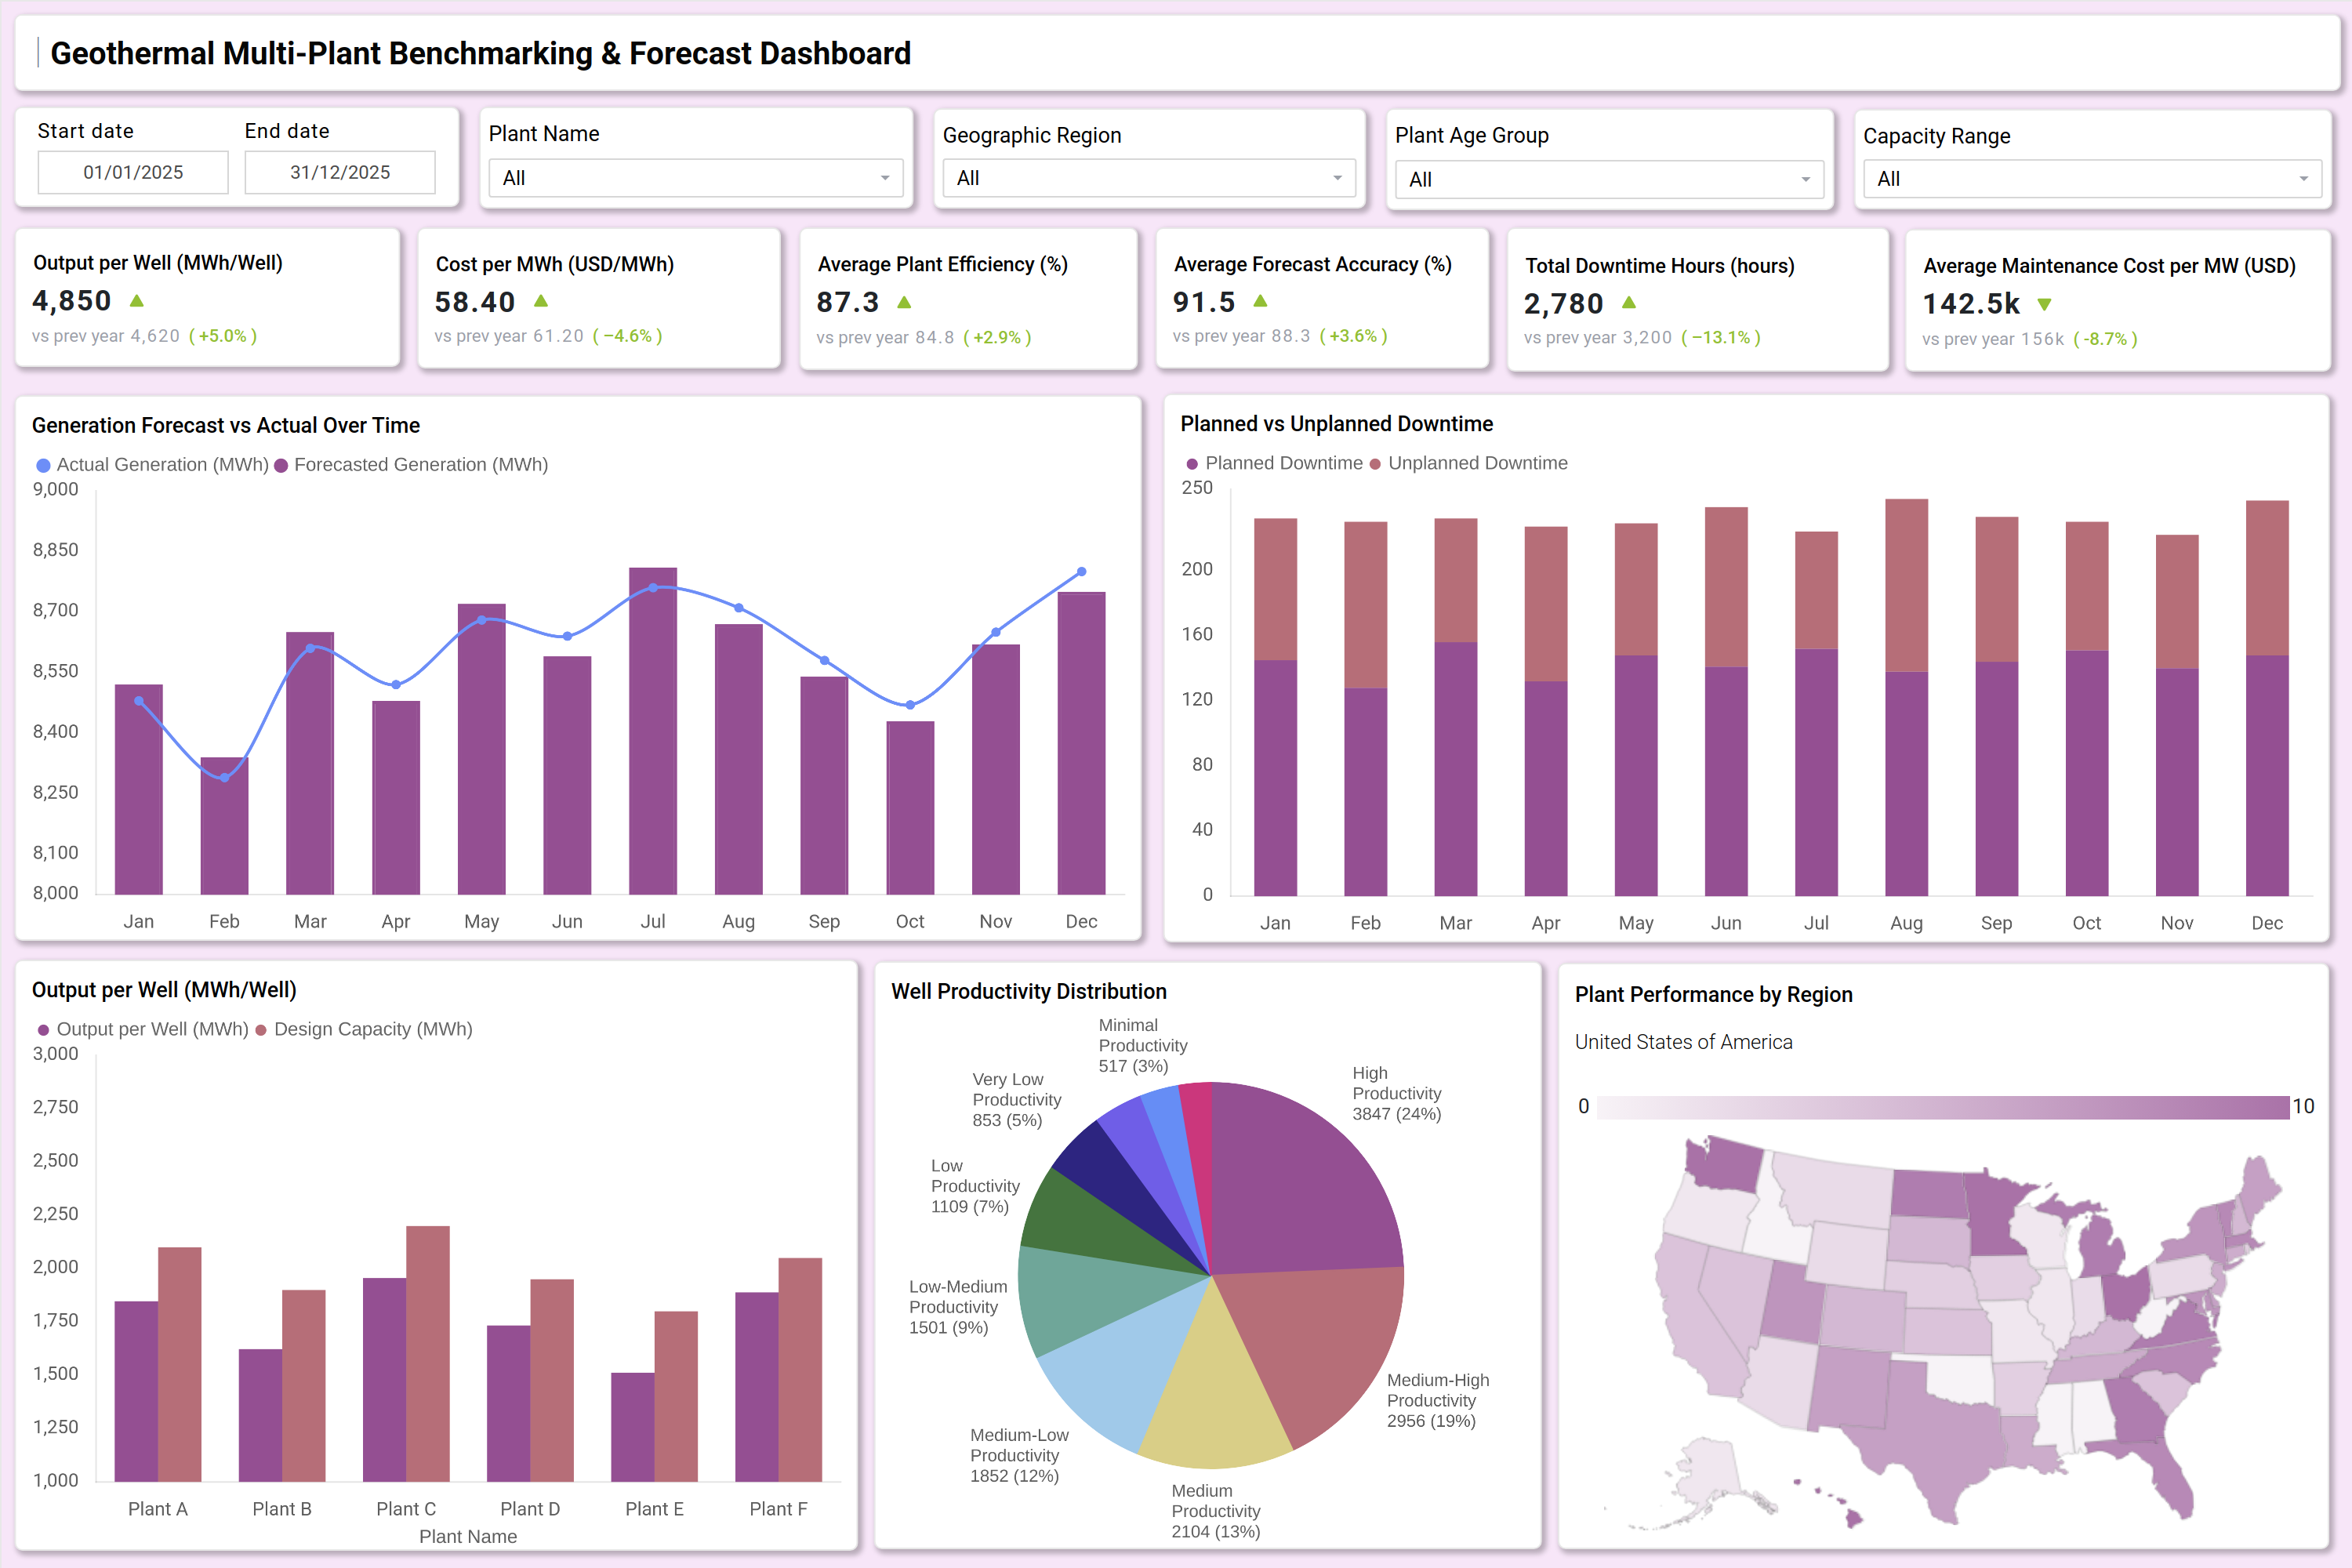
A typical geothermal power generation multi-facility performance dashboard includes portfolio-level KPIs at the top and plant-level analysis visuals below. Trend analysis compares actual versus forecasted generation across months. This enables utilities to validate forecasting accuracy and detect seasonal generation variations. A planned versus unplanned downtime chart separates controllable maintenance from unexpected operational disruptions.
Plant-level comparisons display output per well against design capacity, allowing quick identification of capacity gaps. A productivity distribution chart segments wells into low, medium, and high productivity groups, supporting targeted intervention strategies. Regional performance maps highlight geographic efficiency variations across multiple states or operating zones. As a geothermal plant comparison and forecasting analytics dashboard, this system allows utilities to filter by plant name, region, age group, or capacity range to perform deep operational benchmarking. The result is a structured geothermal energy multi-plant executive reporting dashboard that supports data-driven decisions at the enterprise level.
How to Analyze Data in a Geothermal Multi-Plant Benchmarking & Forecast Dashboard
Here is how you can analyze data from this dashboard:
- Compare output per well across plants: Identify productivity variations and detect underutilized wells that may require optimization.
- Review cost per MWh vs plant efficiency: Assess operational cost control by evaluating how efficiently each plant converts resources into output.
- Analyze forecasted vs actual generation trends: Measure forecasting accuracy and uncover seasonal deviations affecting performance.
- Separate planned vs unplanned downtime: Evaluate maintenance effectiveness by distinguishing routine maintenance from unexpected breakdowns.
- Evaluate plant capacity vs actual generation: Identify utilization gaps and determine whether plants are operating at optimal capacity.
- Monitor regional performance: Detect geographic inefficiencies and compare performance across different locations.
- Review maintenance cost per MW vs downtime hours: Understand reliability patterns by linking maintenance spending with operational disruptions.
- Segment productivity distribution: Prioritize well interventions by identifying high-performing and underperforming assets.
- Compare plant age groups: Assess how aging infrastructure impacts efficiency and performance over time.
- Track year-over-year KPI movement: Validate continuous improvement efforts by analyzing long-term performance trends.
Benefits of a Geothermal Multi-Plant Benchmarking & Forecast Dashboard
The following are the benefits of using this dashboard:
- Enables standardized performance comparison across geothermal facilities: Provides a consistent framework to compare performance across all plants and wells.
- Improves forecasting accuracy for energy production planning: Enhances planning by using reliable data and trends to predict future energy output.
- Reduces operational costs by identifying high cost-per-MWh plants: Highlights inefficient plants, enabling targeted cost optimization efforts.
- Supports predictive maintenance through downtime pattern analysis: Uses historical downtime data to anticipate failures and plan proactive maintenance.
- Enhances executive visibility across the geothermal portfolio: Offers centralized insights for leadership to monitor overall performance and make strategic decisions.
- Optimizes capacity utilization across wells and plants: Ensures assets are used efficiently by identifying underutilized capacity.
- Improves capital allocation using plant-level benchmarking data: Helps prioritize investments based on performance comparisons and ROI potential.
- Strengthens enterprise reporting with centralized performance metrics: Consolidates KPIs into a unified view for consistent and accurate reporting.
- Identifies productivity imbalance across wells and regions: Detects variations in output to guide operational improvements and resource allocation.
- Supports regulatory and compliance reporting with KPI tracking: Simplifies compliance by providing structured, trackable performance metrics.
KPIs to Track in a Geothermal Multi-Plant Benchmarking & Forecast Dashboard
The following key KPIs can be tracked by using this dashboard:
- Output per Well (MWh/Well): Measures well productivity and resource extraction efficiency.
- Cost per MWh (USD/MWh): Tracks generation cost efficiency across plants.
- Average Plant Efficiency (%): Indicates thermal-to-electric conversion performance.
- Forecast Accuracy (%): Evaluates the precision of generation forecasting models.
- Total Downtime Hours: Measures operational disruptions affecting generation output.
- Planned vs Unplanned Downtime Ratio: Assesses maintenance planning effectiveness.
- Capacity Utilization (%): Compares actual generation to installed capacity.
- Maintenance Cost per MW: Monitors asset reliability spending.
- Well Productivity Distribution (%): Categorizes wells into performance tiers.
- Regional Performance Index: Benchmark performance by geography.
Frequently Asked Questions
1. Who should use a geothermal multi-plant benchmarking and forecasting dashboard?
Electric power utility executives, operations managers, asset performance teams, and financial analysts managing multiple geothermal facilities.
2. How does this dashboard improve forecasting accuracy?
It compares historical generation data with forecast models, tracks deviation trends, and measures forecast accuracy percentage across plants.
3. Can this dashboard support capacity optimization?
Yes. It functions as a geothermal plant capacity utilization benchmarking tool by comparing installed capacity against actual output.
4. How does it help reduce operational cost?
By benchmarking cost per MWh and maintenance spending across plants, utilities can identify inefficiencies and optimize processes.
5. Is it suitable for enterprise reporting?
Yes. It acts as a geothermal energy multi-plant executive reporting dashboard, consolidating multi-facility KPIs into a centralized analytics framework.