What is an Electric Power Distribution Asset Performance & Reliability Dashboard?
An Electric Power Distribution Asset Performance & Reliability Dashboard is a centralized analytics view that helps distribution utilities monitor asset health, reliability outcomes, and maintenance effectiveness across transformers, feeders, and switchgear. It consolidates operational, condition, and outage data to track how physical assets perform under load, how failures impact reliability indices, and where maintenance or digital monitoring interventions are required. This power distribution asset condition monitoring dashboard enables utilities to move from reactive asset management to predictive and reliability-driven decision-making.
How to Create an Electric Power Distribution Asset Performance & Reliability Dashboard
You don’t need to build your report from scratch; just start with a ready-to-use dashboard template from Mokkup. Add in your data and export it however you like. Here’s how to do it:
1. Create or Log in to Your Mokkup Account
Start by signing up on Mokkup.ai using your email. If you already have an account, just log in, and you’ll be good to go.
2. Choose and Customize Your Dashboard Template
Find the Electric Power Distribution Asset Performance & Reliability Dashboard template in the Templates section. Use the drag-and-drop editor to adjust KPIs, edit filters, or add elements based on your data.
3. Export to Your BI Tool
Once your dashboard wireframe is ready, use the BI Tool Export feature to send it directly to Power BI or Tableau for further analysis and enhancements. You can also download the dashboard as a PDF, PNG, or JPEG, embed it on a platform, or invite your team to collaborate.
Note: This is a Pro template. You’ll need a Pro subscription on Mokkup to use and customize this dashboard wireframe. Upgrade anytime to unlock full access.
Electric Power Distribution Asset Performance & Reliability Dashboard Example
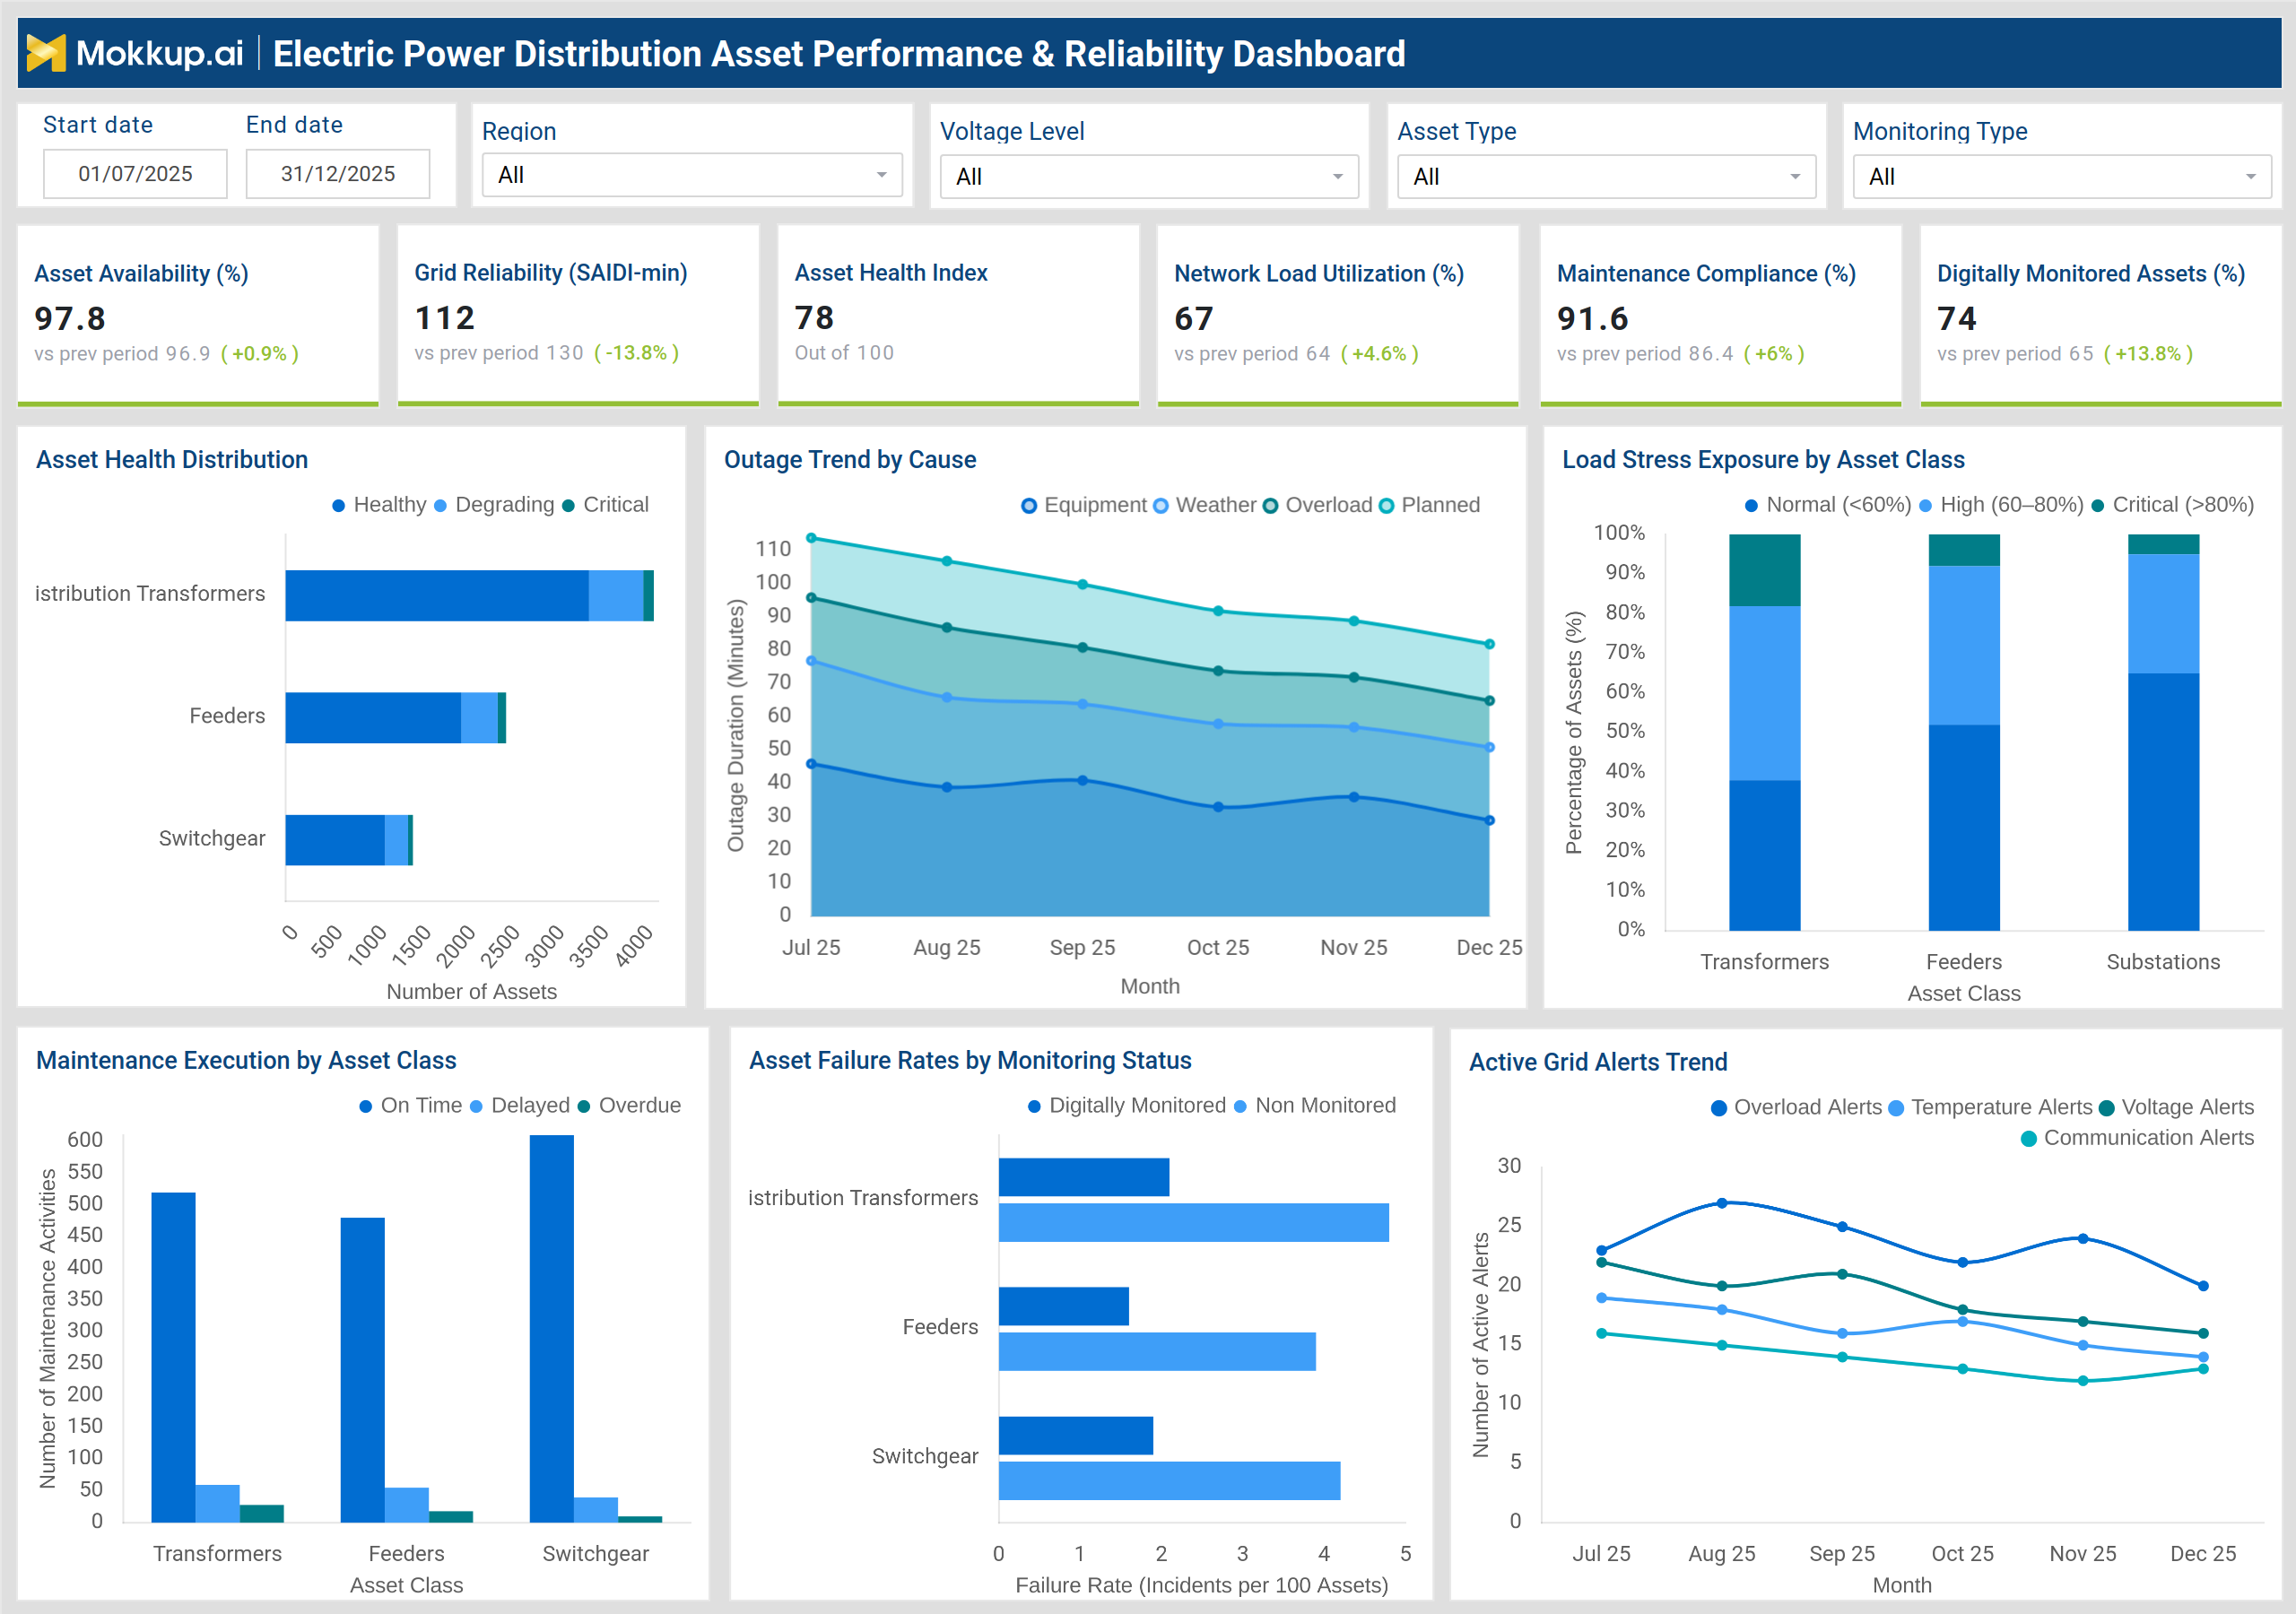
In this example, the electric power distribution asset performance dashboard provides a network-wide view of asset availability, grid reliability (SAIDI), asset health index, load utilization, maintenance compliance, and digital monitoring coverage. Visuals highlight asset health distribution across transformers, feeders, and switchgear, outage trends by cause, load stress exposure, maintenance execution status, asset failure rates by monitoring type, and active grid alerts. Together, these views support asset condition monitoring, reliability improvement planning, and risk-based maintenance prioritization.
How to Analyze Data in an Electric Power Distribution Asset Performance & Reliability Dashboard
Here is how you can analyze data from this Distribution utility asset health performance dashboard:
- Review Asset Availability (%) and Maintenance Compliance (%) to confirm operational readiness and preventive maintenance discipline.
- Track Grid Reliability (SAIDI) trends to understand customer impact from asset-related outages.
- Use the Asset Health Index to identify degrading or critical assets requiring intervention.
- Analyze Asset Health Distribution to prioritize transformers, feeders, or switchgear with higher risk concentration.
- Compare Maintenance Execution by Asset Class to identify delayed or overdue activities.
- Assess Asset Failure Rates by Monitoring Status to measure the effectiveness of digital monitoring programs.
- Monitor Active Grid Alerts Trend to identify recurring overload, temperature, voltage, or communication issues.
Benefits of Electric Power Distribution Asset Performance & Reliability Dashboard
The following are the benefits of using this Electric Power Distribution dashboard:
- Improves reliability planning by linking asset health with SAIDI performance.
- Enables condition-based maintenance using historical asset data.
- Reduces unplanned outages through early detection of degrading assets.
- Supports load management by highlighting stress exposure across asset classes.
- Enhances ROI from digital monitoring investments by correlating monitoring with failure reduction.
- Strengthens regulatory reporting with auditable reliability and maintenance KPIs.
- Improves capital prioritization by focusing upgrades on high-risk assets.
KPIs to Track in Electric Power Distribution Asset Performance & Reliability Dashboard
The following key KPIs can be tracked by using this dashboard that acts like a Power distribution reliability monitoring analytics platform:
- Asset Availability (%): Measures the percentage of distribution assets available for operation.
- Grid Reliability (SAIDI – minutes): Tracks average outage duration experienced by customers.
- Asset Health Index (0–100): Composite score reflecting overall asset condition.
- Network Load Utilization (%): Indicates how much of installed capacity is being used.
- Maintenance Compliance (%): Measures adherence to scheduled maintenance plans.
- Digitally Monitored Assets (%): Tracks asset coverage under digital monitoring systems.
- Asset Health Distribution (Healthy / Degrading / Critical): Shows condition spread across asset classes.
- Outage Duration by Cause (minutes): Breaks down outages by equipment, overload, weather, and planned events.
- Load Stress Exposure (%): Identifies assets operating under normal, high, or critical load conditions.
- Maintenance Execution Status (On-time / Delayed / Overdue): Tracks maintenance performance by asset type.
- Asset Failure Rate (incidents per 100 assets): Compares digitally monitored vs non-monitored assets.
- Active Grid Alerts (count): Tracks overload, temperature, voltage, and communication alerts.
Frequently Asked Questions
1. Who should use an Electric Power Distribution Asset Performance & Reliability Dashboard?
This Distribution utility reliability KPI dashboard is designed for distribution utility operations teams, asset managers, reliability engineers, and network planners.
2. How does this dashboard support reliability improvement?
It links asset condition, load stress, and outage causes directly to SAIDI trends, enabling targeted reliability actions.
3. Can this dashboard support predictive maintenance?
Yes. Asset health indices, failure rates, and digital monitoring data enable early identification of degradation patterns.