What is a Cardiac Procedures & Interventions Dashboard?
A Cardiac Procedures & Interventions Dashboard template is a dedicated data visualization tool used by heart centers and cardiology departments to monitor, analyze, and improve cardiac procedures and interventions. This dashboard wireframe tracks clinical operation metrics such as procedure count, complication rates, device utilization, and surgeon performance for cardiac interventions.
How to Create a Cardiac Procedures & Interventions Dashboard
You don’t need to build your report from scratch—just start with a ready-to-use Cardiac Procedures & Interventions Dashboard template from Mokkup. Add in your data and export it however you like. Here’s how to do it:
1. Create or Log in to Your Mokkup Account
Start by signing up on Mokkup.ai using your email. If you already have an account, just log in, and you’ll be good to go.
2. Choose and Customize Your Dashboard Template
Find the Cardiac Procedures & Interventions Dashboard template in the Templates section. Use the drag-and-drop editor to adjust KPIs, edit filters, or add elements based on your data.
3. Export to Your BI Tool
Once your dashboard wireframe is ready, use the BI Tool Export feature to send it directly to Power BI or Tableau for further analysis and enhancements. You can also download the dashboard as a PDF, PNG, or JPEG, embed it on a platform, or invite your team to collaborate.
Note: This is a Pro template. You’ll need a Pro subscription on Mokkup to use and customize this dashboard wireframe. Upgrade anytime to unlock full access.
Cardiac Procedures & Interventions Dashboard Example
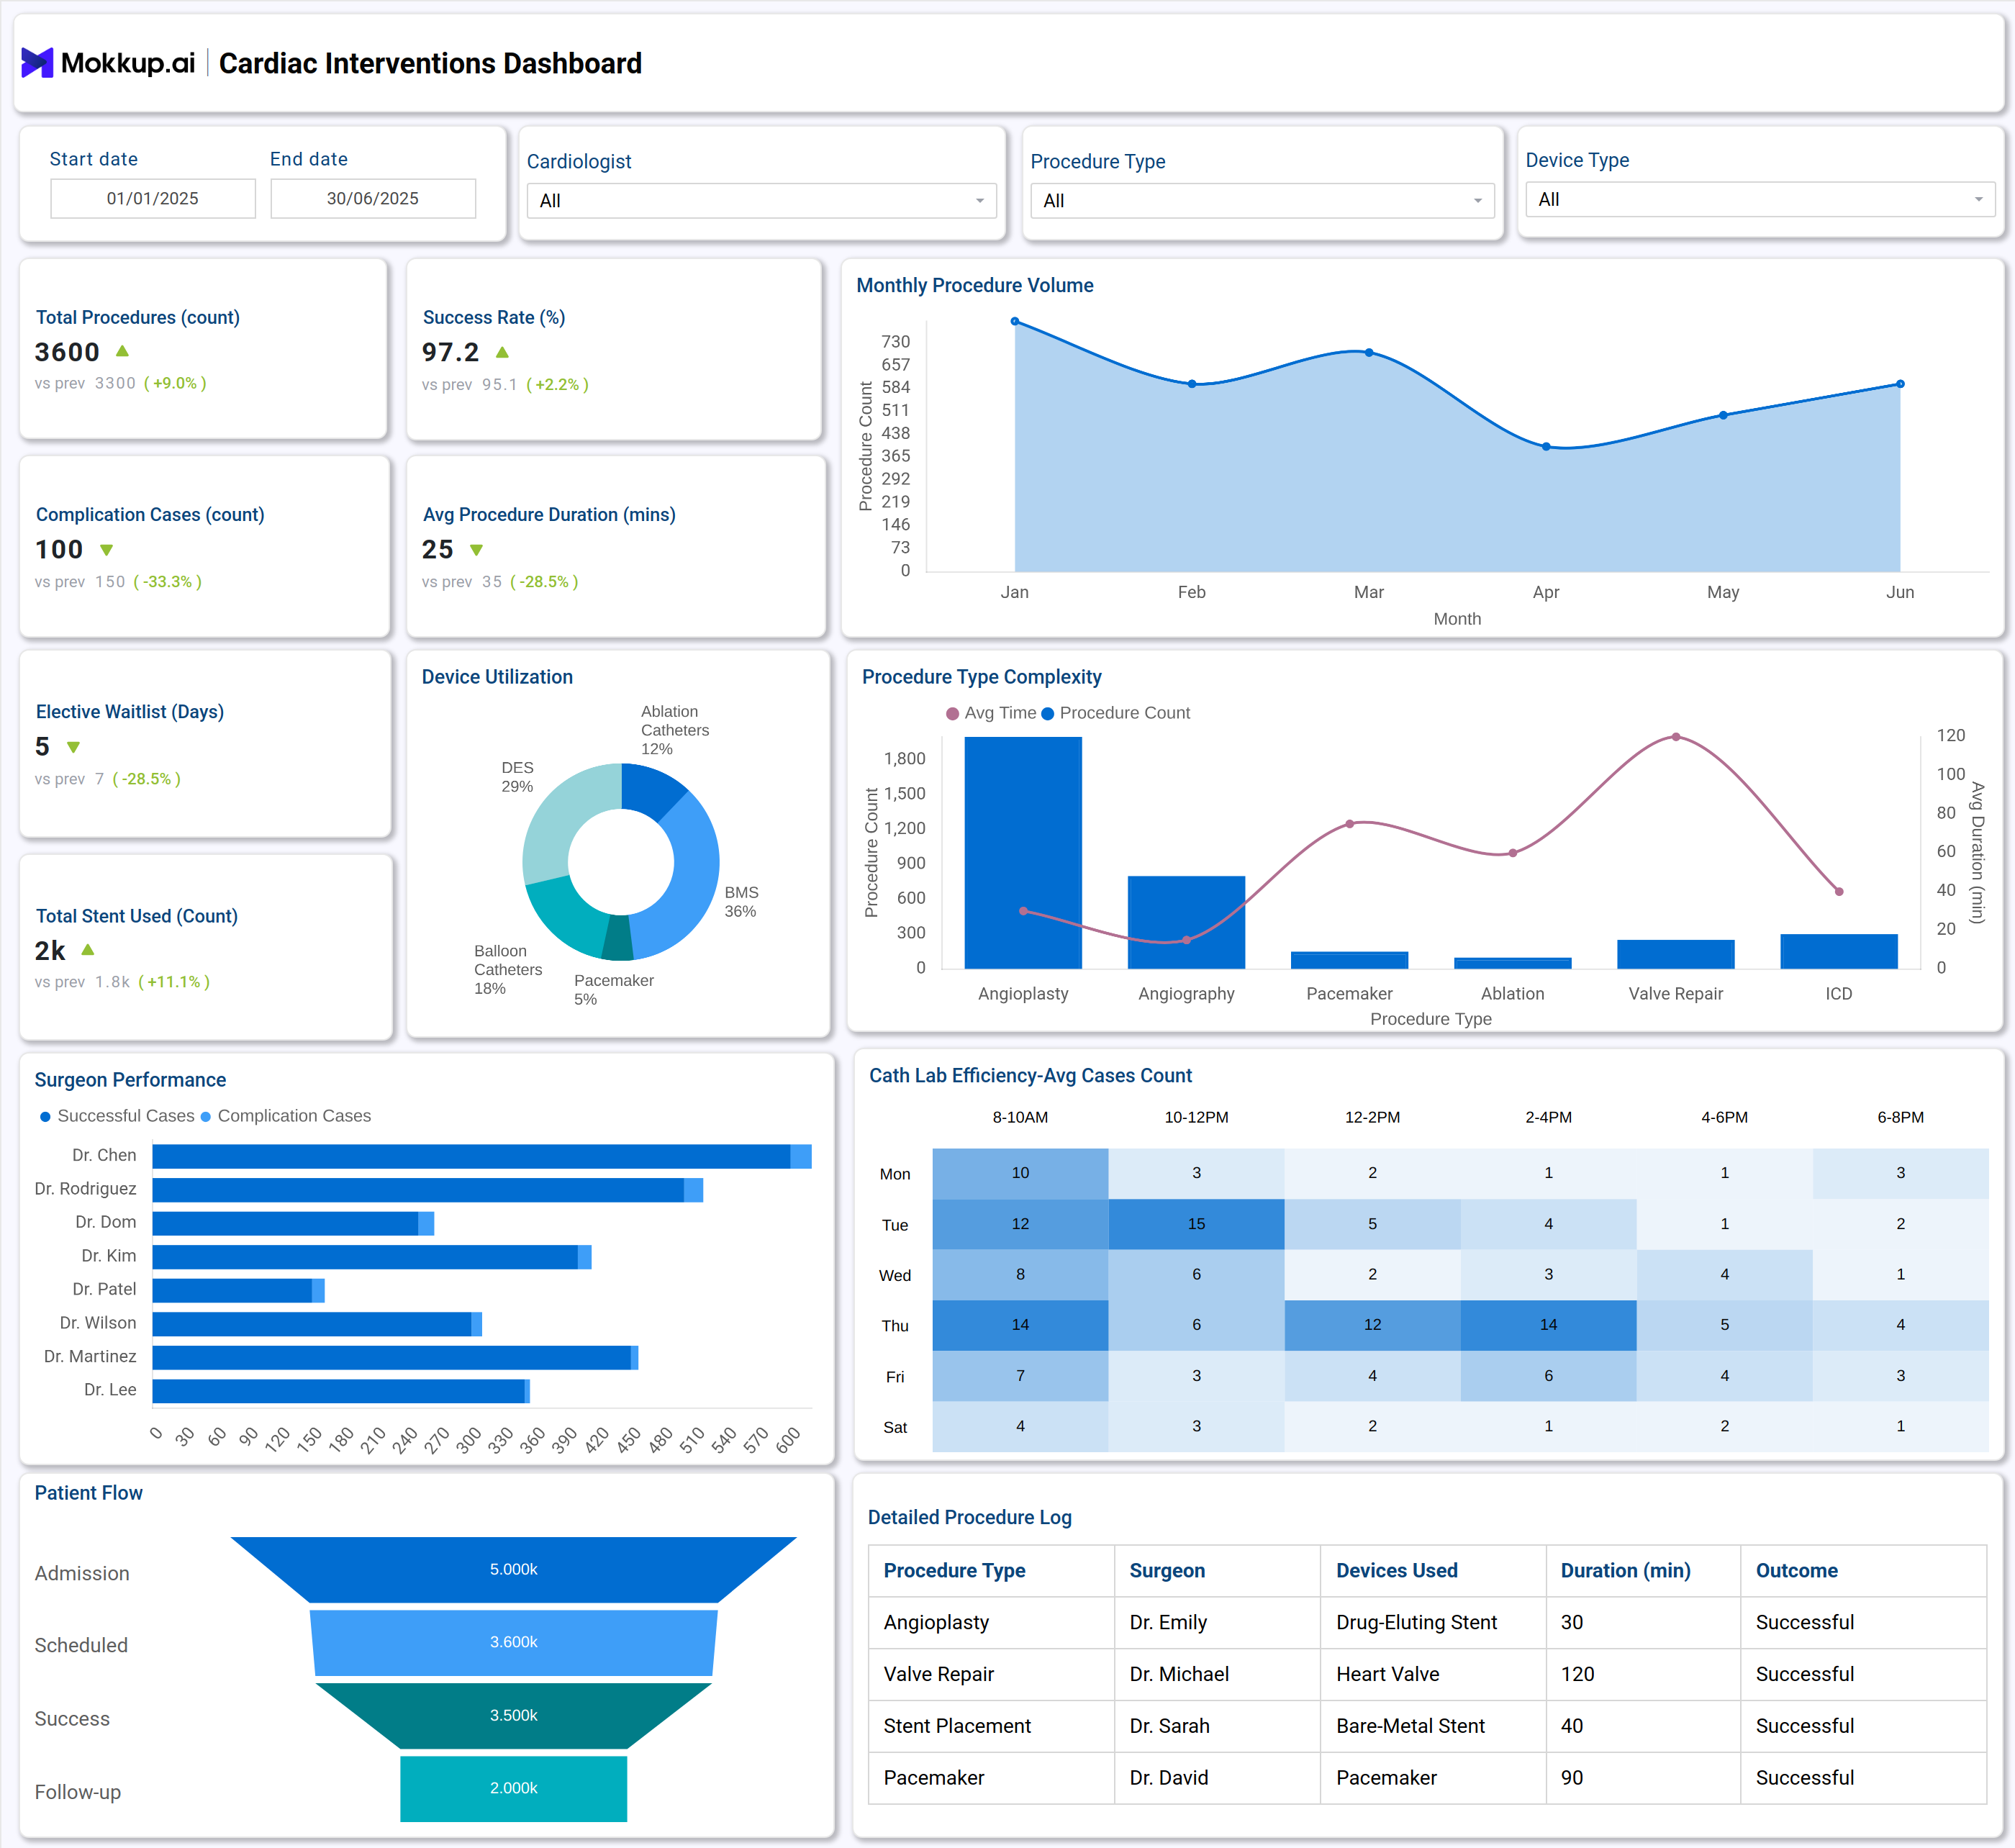
A dynamic Cardiac Procedures & Interventions Dashboard typically features interactive filters for date range, procedure type, cardiologist, and device selection. Standard dashboard elements include total procedure count, success rate, complication cases, and average procedure duration. Device usage is visualized through charts showing the proportion of DES, BMS, balloon catheters, and pacemakers. Monthly trends reveal surgery volumes, while performance indicators highlight individual surgeon outcomes for heart surgeries and interventions. The dashboard streamlines reporting, enabling clinical leaders to identify patterns, monitor waitlists, and manage available resources. Through clear graphical insights, teams can address bottlenecks, reduce complication rates, and drive patient-centered care across a full spectrum of cardiac interventions.
How to Analyze Data in Cardiac Procedures & Interventions Dashboards
Analyzing a Cardiac Procedures and Interventions Dashboard wireframe allows cardiology teams to optimize patient care, improve procedure efficiency, and ensure effective resource allocation:
- Identify monthly trends in procedure volume to allocate resources efficiently.
- Monitor success rates for each type of cardiac procedure and compare them against benchmarks.
- Track complication cases and address underlying causes promptly.
- Analyze device utilization to optimize stock and deployment of stents, pacemakers, or balloon catheters.
- Evaluate surgeon performance by reviewing successful versus complicated procedures.
- Assess cath lab efficiency by examining case distribution throughout the day and week.
- Drill down into detailed procedure logs for case-by-case outcome reviews.
Benefits of Cardiac Procedures & Interventions Dashboards
Analyzing a Cardiac Procedures & Interventions Dashboard allows cardiology teams to optimize patient care, improve procedure efficiency, and effectively allocate resources.
- Centralizes all key operational data for cardiology procedures.
- Improves clinical outcomes by identifying trends and complications early.
- Increases accountability through transparent reporting of surgeon and team performance.
- Enhances resource planning for devices and procedure rooms.
- Supports continuous quality improvement across heart center operations.
- Reduces administrative workload by automating reporting and analytics.
- Facilitates evidence-based decision-making for clinical leaders and cardiologists.
KPIs to Track in Cardiac Procedures & Interventions Dashboards
Tracking the right KPIs ensures heart centers can monitor performance, optimize workflows, and improve patient care:
- Total Procedures: Measures the volume of cardiac interventions completed.
- Success Rate: Shows the percentage of procedures with positive outcomes.
- Complication Cases: Tracks the number of procedures involving complications.
- Average Procedure Duration: Monitors efficiency and utilization of clinical resources.
- Elective Waitlist: Reflects demand and access to heart center services.
- Total Stent Used: Quantifies devices consumed in procedures.
- Device Utilization: Shows the usage breakdown of stents, pacemakers, and other devices.
- Surgeon Performance: Compares successful and complicated cases per surgeon.
- Monthly Procedure Volume: Highlights seasonality and operational trends.
- Cath Lab Efficiency: Measures average case count per time slot to find bottlenecks.
- Patient Flow: Visualizes the patient journey from admission to follow-up.
Frequently Asked Questions
Q1. Who should use a Cardiac Procedures & Interventions Dashboard?
This dashboard is ideal for clinical operations teams, cardiologists, heart center managers, and healthcare administrators monitoring cardiac procedures and interventions.
Q2. How often should the Cardiac Procedures & Interventions Dashboard be reviewed?
The dashboard should be reviewed regularly, typically monthly or quarterly, to monitor trends, identify procedural inefficiencies, and make timely resource allocation and quality improvement decisions.
Q3. Can the dashboard track outcomes for specific procedures like angioplasty or pacemaker placement?
Yes, individual procedure types such as angioplasty, heart surgery, or pacemaker insertion can be tracked with granular KPIs.