
What is a Gastroenterology Patient Experience & Quality Dashboard?
A Gastroenterology hospital patient experience dashboard template is a performance monitoring tool that tracks patient satisfaction, complaint resolution, safety incidents, and quality of care metrics. By integrating clinical, operational, and patient feedback data, it provides hospital administrators and clinicians with real-time visibility into patient experience and care delivery standards.
This patient experience dashboard template is designed for gastroenterology departments and hospitals seeking to enhance care quality, mitigate safety risks, and foster patient trust. As a real-time quality monitoring dashboard, it supports evidence-based decision-making by aligning patient satisfaction scores with departmental efficiency and safety compliance.
How To Create a Gastroenterology Hospital Patient Experience & Quality Dashboard
You don’t need to build your report from scratch—just start with a ready-to-use sample Gastroenterology Hospital Patient Experience & Quality Dashboard template from Mokkup. Add in your data and export it however you like. Here’s how to do it:
1. Create or Log in to Your Mokkup Account
Start by signing up on Mokkup.ai using your email. If you already have an account, just log in, and you’ll be good to go.
2. Choose and Customize Your Dashboard Template
You can find the Gastroenterology Hospital Patient Experience & Quality Dashboard template in the Templates section. Use the drag-and-drop editor to adjust KPIs, edit filters, or add elements based on your data.
3. Export to Your BI Tool
Once your dashboard wireframe is ready, use the BI Tool Export feature to send it directly to Power BI or Tableau for further analysis and enhancements. You can also download the dashboard as a PDF, PNG, or JPEG, embed it on a platform, or invite your team to collaborate.
Note: This is a Pro template. You’ll need a Pro subscription on Mokkup to use and customize this dashboard wireframe. Upgrade anytime to unlock full access.
Gastroenterology Patient Experience & Quality Dashboard Example
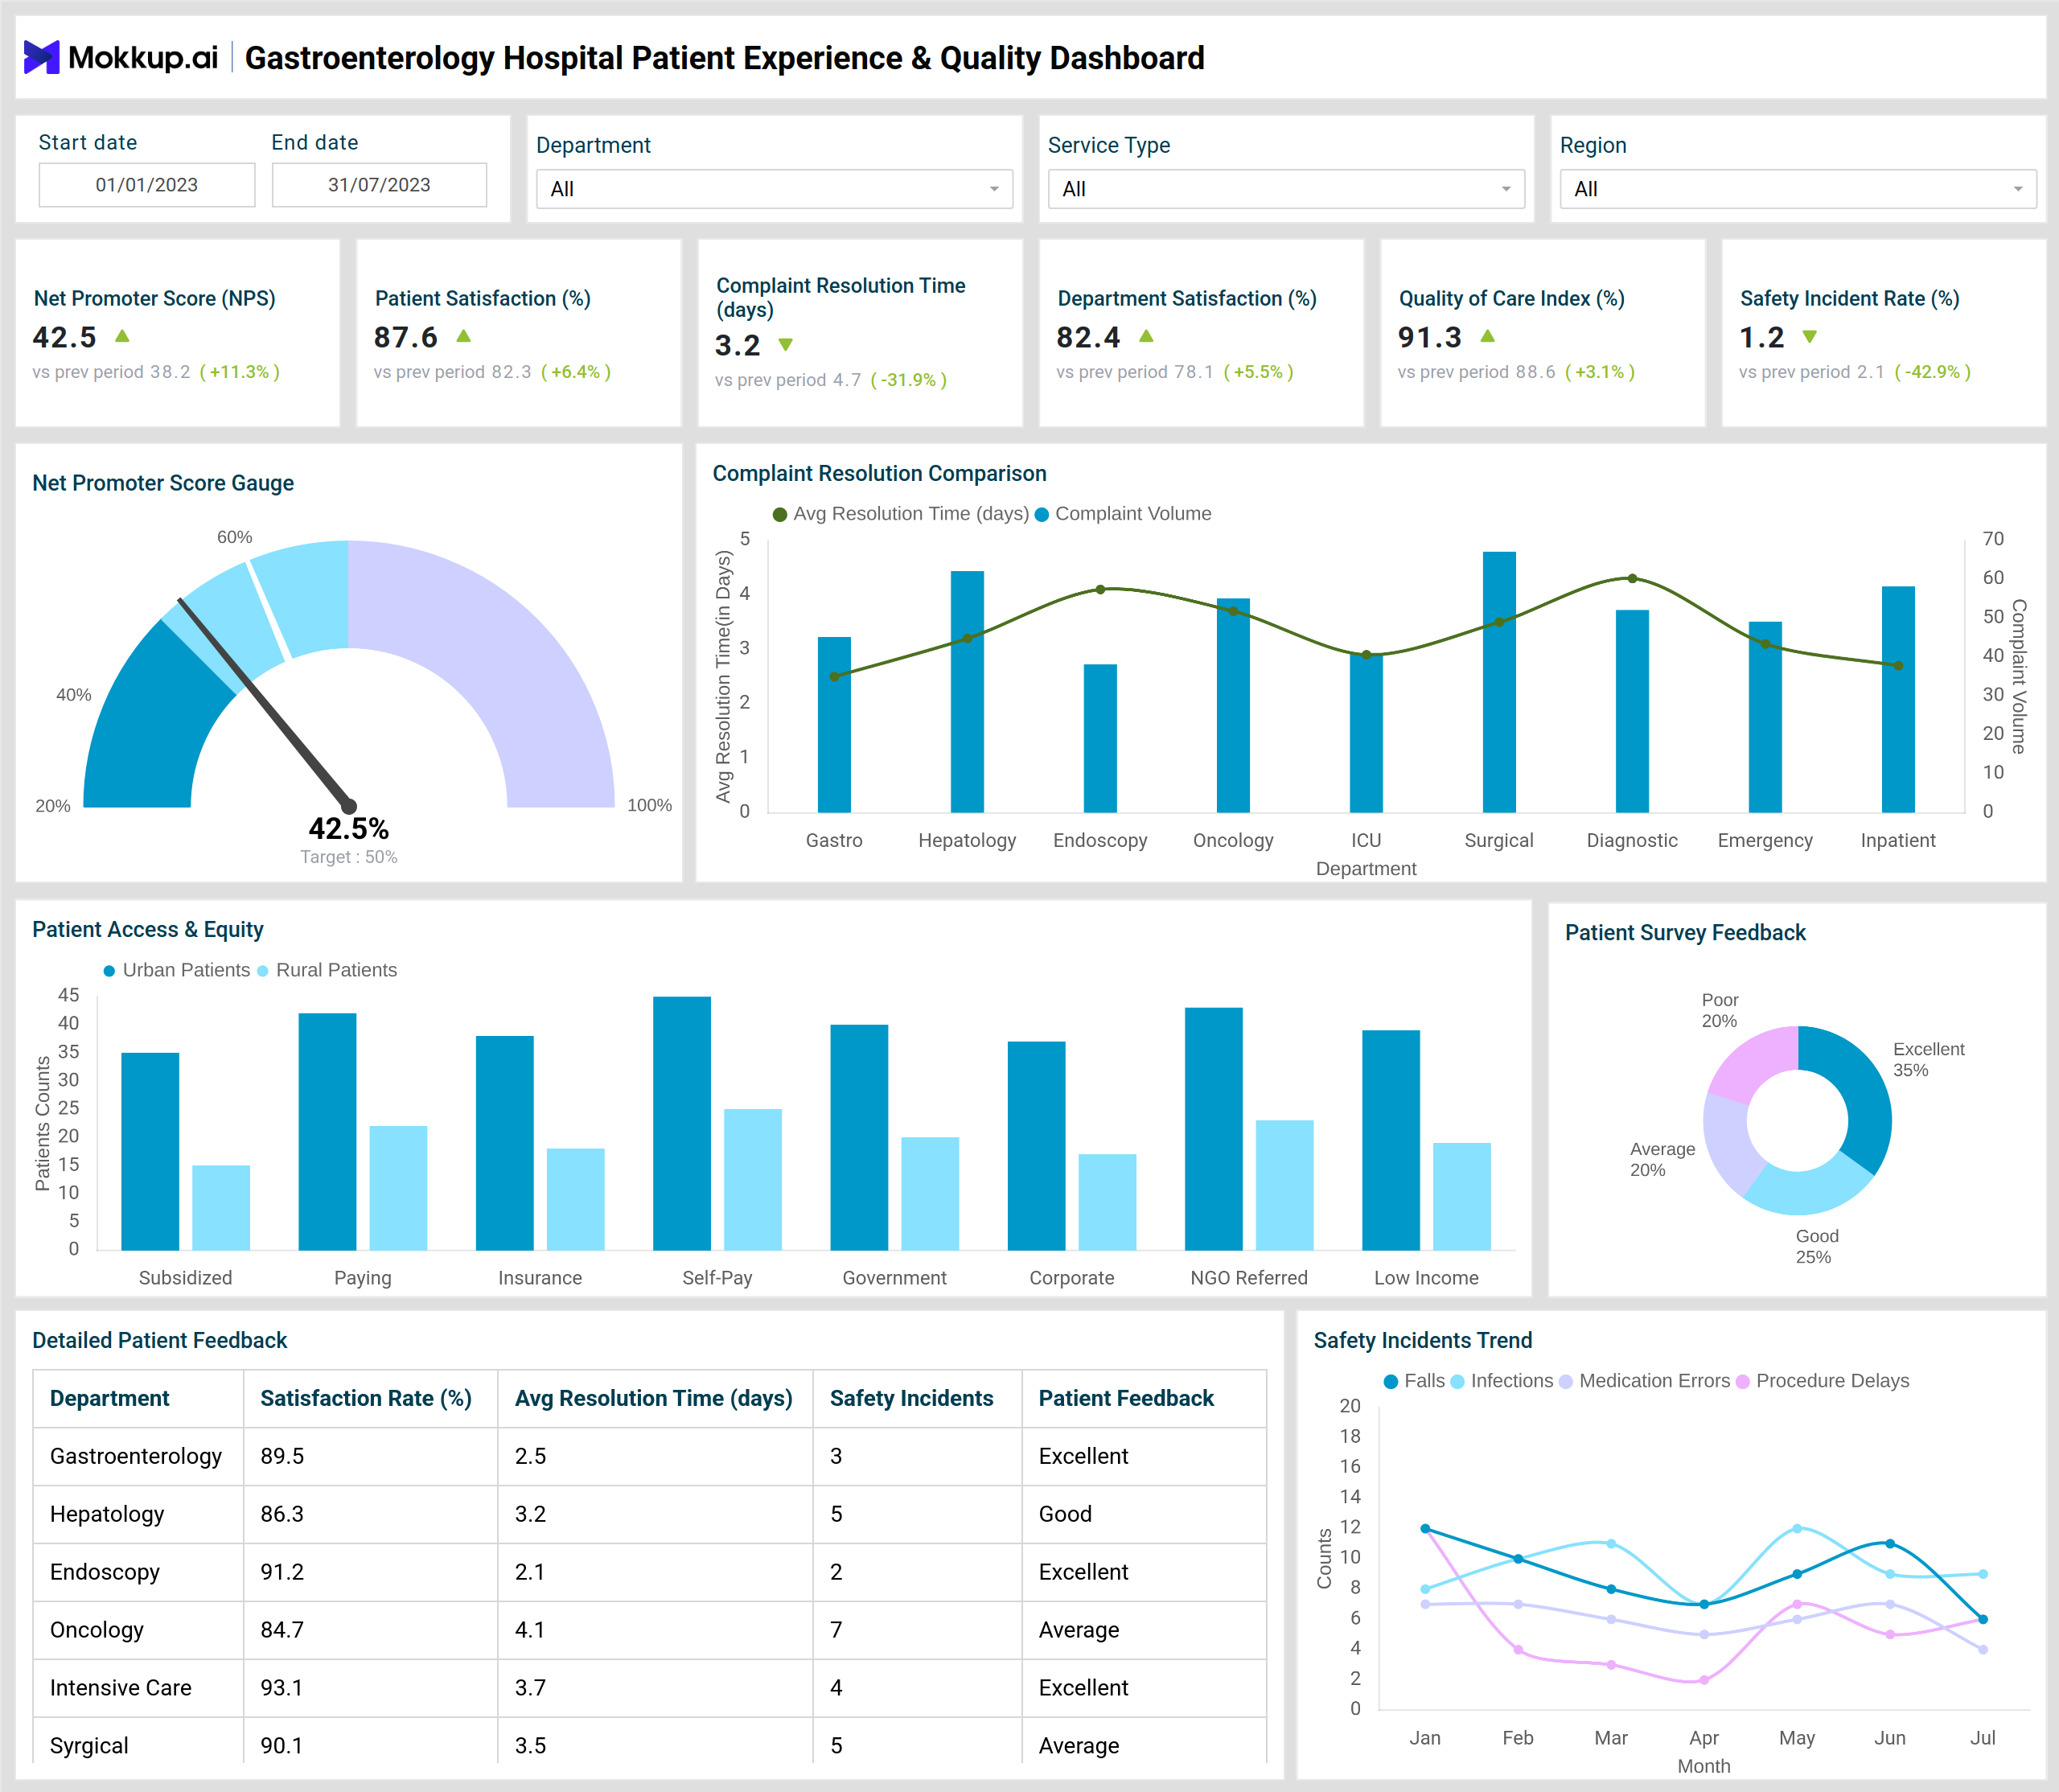
The example dashboard provides a comprehensive view of patient experience and service quality in gastroenterology hospitals. It highlights Net Promoter Score (NPS), overall satisfaction rate, complaint resolution time, department-level satisfaction, quality of care index, and safety incident rate as core KPIs.
Visuals, such as the Net Promoter Score gauge, measure the likelihood of patients recommending the hospital. The complaint resolution comparison chart tracks both resolution time and complaint volume across gastroenterology, hepatology, oncology, endoscopy, ICU, surgical, and diagnostic departments.
The patient access and equity chart highlights service accessibility by financial categories like subsidized care, insurance, corporate coverage, and NGO referrals, comparing urban and rural patient representation. Patient survey feedback provides a quick overview of satisfaction distribution, segmented into excellent, good, average, and poor experiences.
Together, these insights make the dashboard a holistic patient experience management tool, connecting patient perception with safety, compliance, and service quality outcomes.
How to Analyze Data in Patient Experience Dashboards
With this dashboard, you can get detailed department-wise insights, including satisfaction rates, resolution times, safety incidents, and qualitative feedback. Here is how you can analyze performance:
- Compare NPS and Satisfaction Scores to assess overall patient perception.
- Evaluate Complaint Resolution Metrics by department to identify areas causing delays.
- Track Safety Incident Trends (falls, infections, medication errors) for proactive risk management.
- Review Patient Access Equity to ensure fair distribution of services between rural and urban patients.
- Analyze Department-Level Feedback to link performance with patient experience.
Benefits of a Gastroenterology Patient Experience Dashboard
Implementing this dashboard provides significant advantages, including:
- Improved Patient Satisfaction – By continuously monitoring NPS and satisfaction scores, hospitals can take prompt corrective actions.
- Faster Complaint Resolution – The complaint resolution dashboard ensures grievances are tracked and closed efficiently.
- Quality of Care Monitoring – Tracks departmental performance using a quality care index to facilitate ongoing improvement.
- Safety & Compliance – Monitors incident rates and trends to strengthen patient safety practices.
- Equity in Access – Ensures services are accessible across financial backgrounds, urban, and rural populations.
KPIs to Track in Gastroenterology Patient Experience & Quality Dashboards
- Net Promoter Score (NPS) – Measures patient loyalty and the likelihood of recommending the hospital.
- Patient Satisfaction (%) – Tracks overall patient sentiment toward care and service quality.
- Complaint Resolution Time (days) – Measures the speed at which patient issues are resolved.
- Quality of Care Index (%) – Provides a combined score to evaluate care standards across departments.
- Safety Incident Rate (%) – Tracks the frequency of patient safety issues, helping reduce risks.
Frequently Asked Questions
1. Why is patient experience necessary in gastroenterology hospitals?
Patient experience has a direct impact on trust, treatment adherence, and long-term outcomes. Monitoring patient feedback enables hospitals to improve their service delivery.
2. How does this dashboard improve safety?
By tracking safety incident trends and departmental compliance, hospitals can detect risks early, reduce adverse events, and improve overall care standards.