What is a Health & Wellness Tracker Dashboard?
This health and wellness dashboard is concerned with measuring the effectiveness of employee wellness programs by giving actionable insights and real-time analytics. This dashboard is a good way to track engagement and participation rates in corporate wellness initiatives and derive insights about team performance and user breakdowns. With this consolidated view, you can tap into the corporate wellness analytics to strategize toward creating a healthy workplace culture.
Health & Wellness Dashboard Example
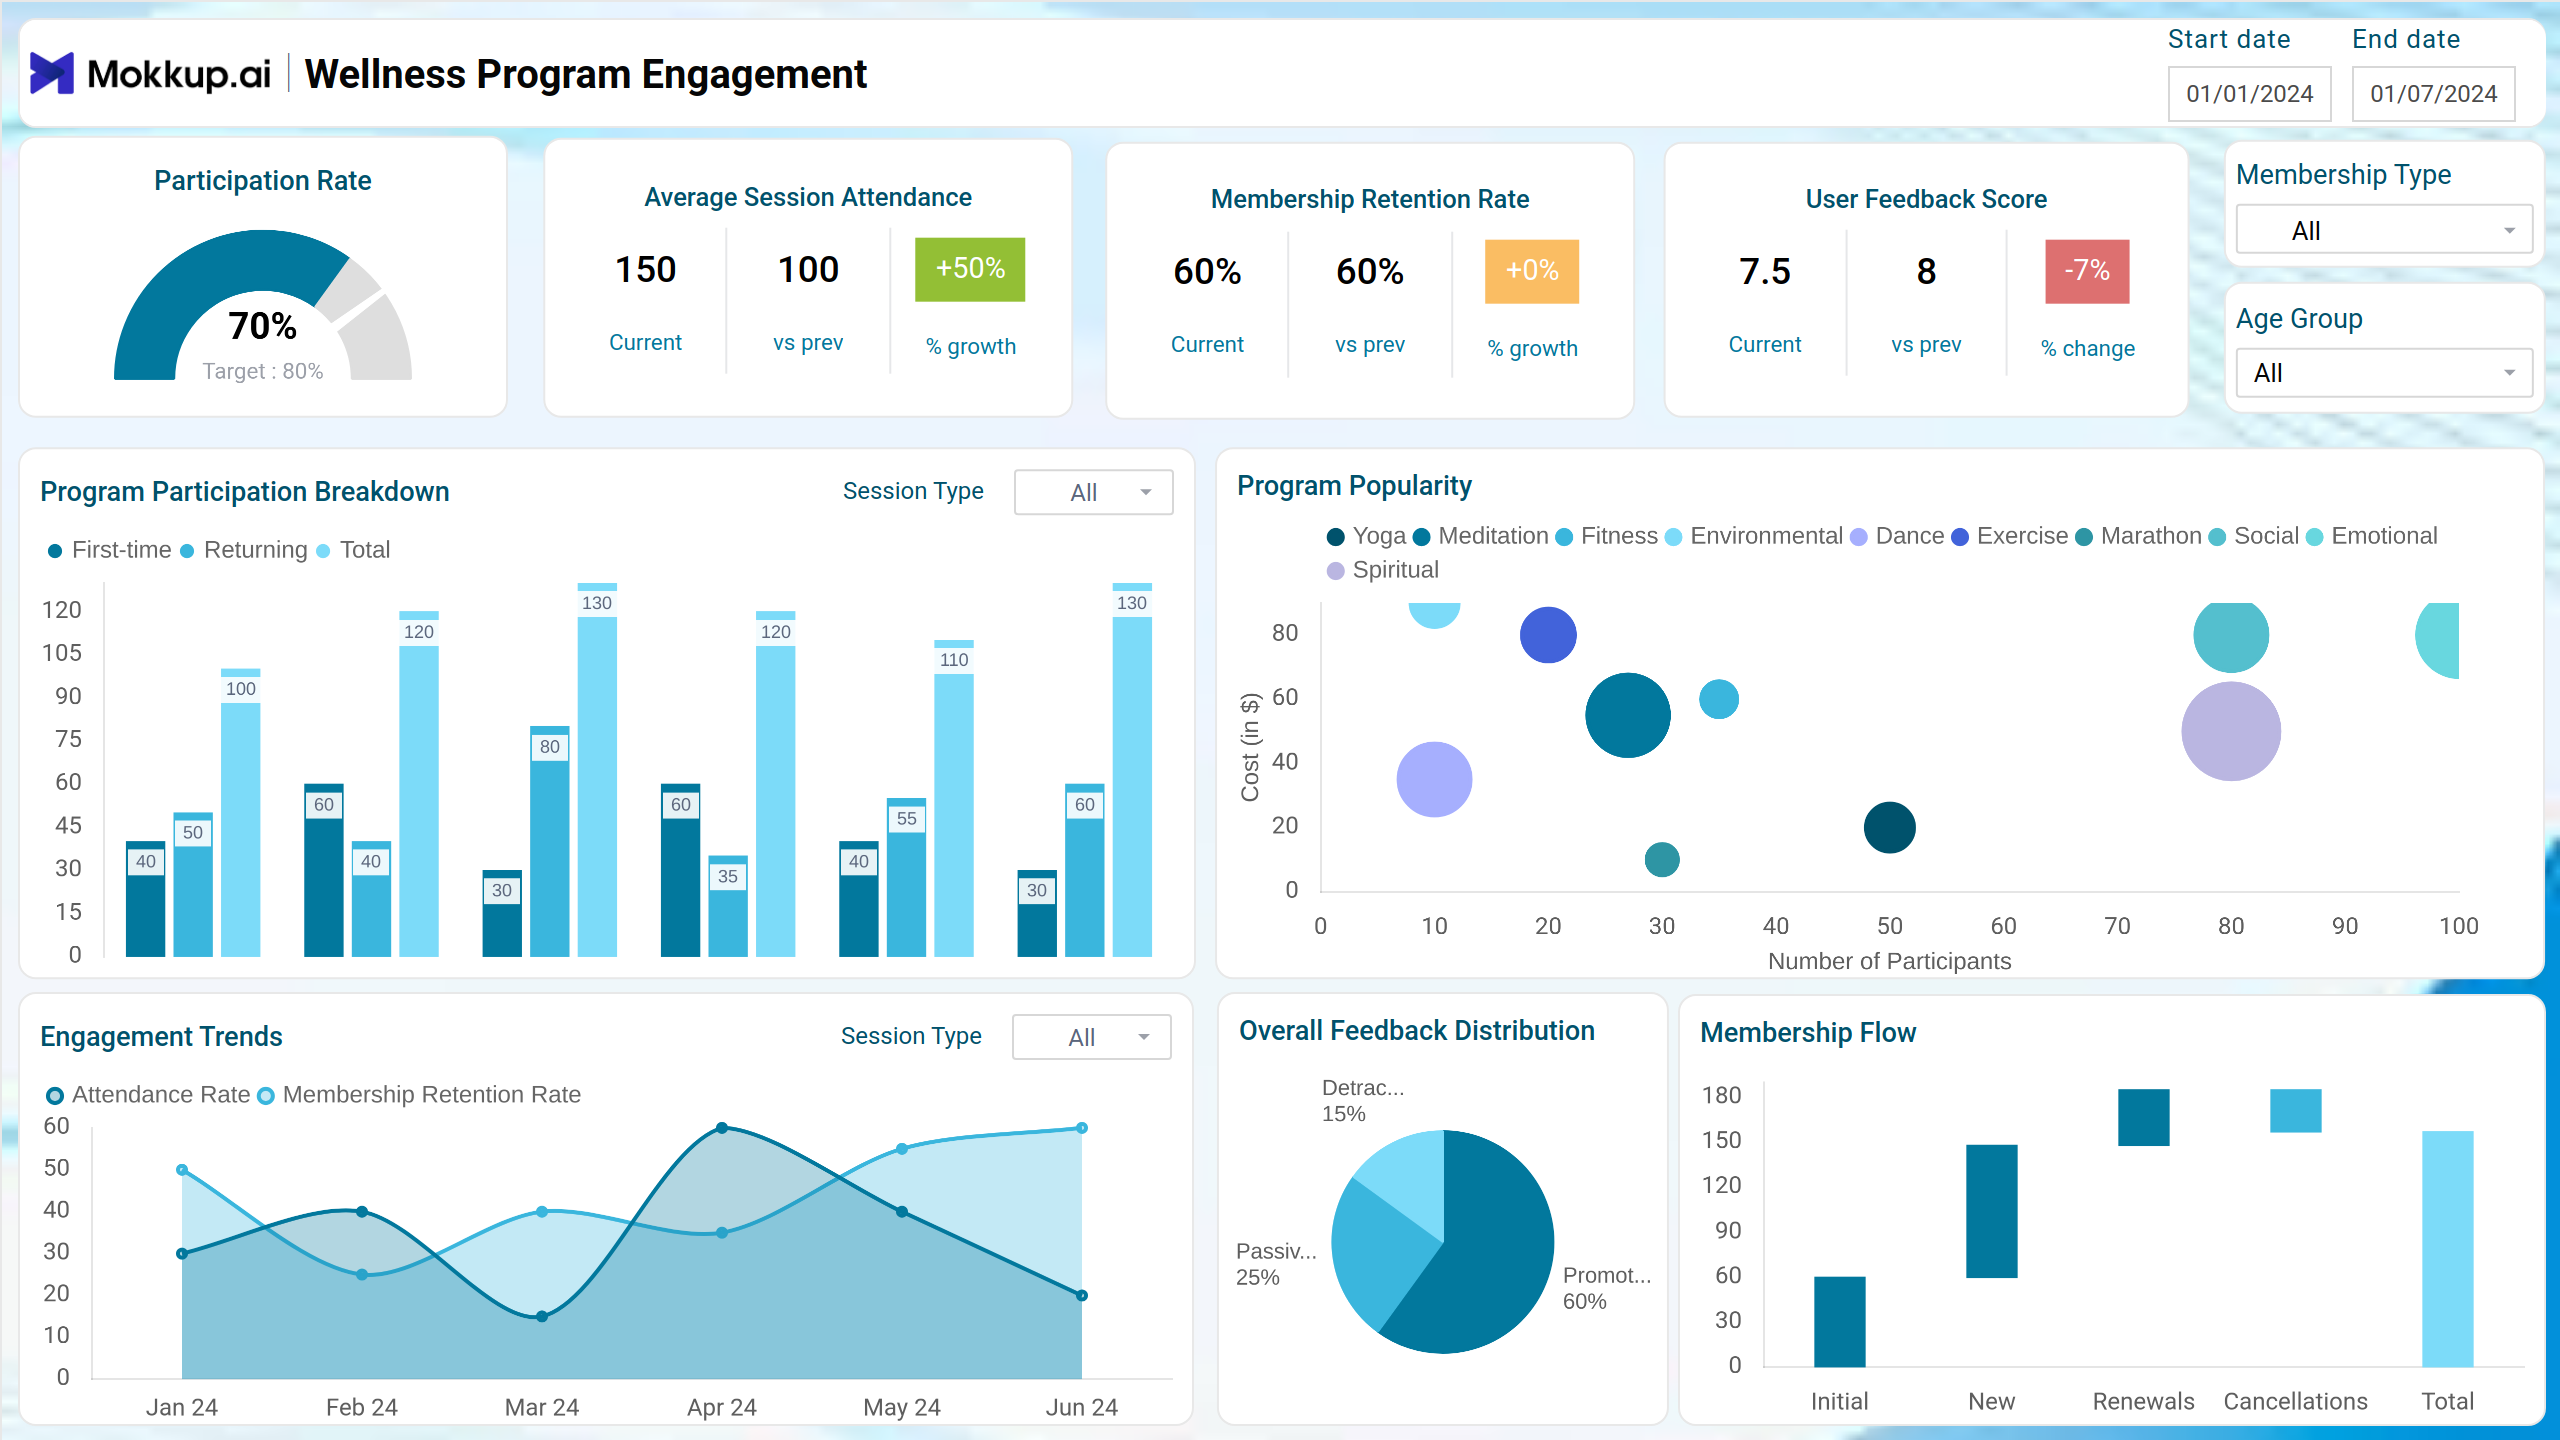
This wellness tracker dashboard is a go-to platform for monitoring key aspects of well-being, such as physical fitness, mental health, and lifestyle habits. It typically includes intuitive navigation with KPI tiles on top, with a gauge chart to evaluate participation rate. The dashboard template comprises bar charts, line charts, pie charts, and bubble charts to clarify the interpretation of complex data figures. Users can explore trends, track progress, and even export insights for consultations, making the dashboard a powerful daily companion for proactive health management. They can even be used to get virtual care insights.
How to Analyze Data in Health & Wellness Dashboards
The Lifestyle and fitness monitoring tool aims to analyze the effectiveness of wellness programs and determine what improvements can be made. You can start by reviewing the Participation Rate, which shows the percentage of enrolled members actively engaging in health programs, and later dig into the Average Session Attendance KPI, which indicates how often members attend scheduled sessions, revealing consistency and commitment levels. Further, engagement trends tracked over weeks or months provide insights into how participation fluctuates, and Membership Flow visualizations help monitor growth and attrition in real time.
How to Create a Health & Wellness Dashboard
You don’t need to build it from scratch. Just find the Mokkup.ai wellness dashboard template, add your data, and export it however you like. Follow these steps:
1. Create or Log in to Your Mokkup Account
Start by signing up on Mokkup.ai using your email. If you already have an account, just log in, and you’ll be good to go.
2. Choose and Customize Your Dashboard Template
The Health & Wellness Tracker dashboard template is in the Templates section. Use the drag-and-drop editor to adjust KPIs, edit filters, or add elements based on your data.
3. Export to Your BI Tool
Once your dashboard wireframe is ready, use the BI Tool Export feature to send it directly to Power BI or Tableau for further analysis and enhancements. You can also download the dashboard as a PDF, PNG, or JPEG, embed it on a platform, or invite your team to collaborate.
Note: This is a Pro template. You’ll need a Pro subscription on Mokkup to use and customize this dashboard wireframe. Upgrade anytime to unlock full access.
Benefits of Health & Wellness Dashboards
The wellness engagement dashboard provides a centralized view of employee well-being KPIs that would keep individuals and organizations on the same page. Here are some crucial benefits:
- Enables individuals and health professionals to make informed choices based on real-time insights and trends.
- Helps boost user participation through visual progress tracking, goal setting, and personalized insights.
- Use it as a daily health monitoring tool that tracks membership flow and feedback. This will help improve user satisfaction and retain participants longer.
- It can detect health issues early, which reduces healthcare costs.
KPIs to Track in Wellness Dashboards
The following are the Personal health KPIs that you can track:
- Participation Rate: The percentage of individuals actively participating in workplace wellness programs.
- Average Session Attendance: This metric evaluates the number of individuals who attended the wellness sessions.
- User Feedback Score: This KPI will measure employee satisfaction by tracking how users perceive the wellness initiatives.
- Program Participation Breakdown: The graph shows this metric, depicting how many participants actively engage in the different aspects of health and wellness programs.
- Program Popularity: This metric measures the level of interest in various wellness initiatives in well-being programs.
- Engagement Trends: This will determine changes in patterns in how actively employees engage with the wellness programs over time.
Frequently Asked Questions
1. What kind of data can I track from this dashboard?
You can track metrics such as step count, calories burned, sleep hours, hydration levels, heart rate, stress levels, mood, program attendance, user feedback scores, and more.
2. How does it help improve wellness program performance?
By tracking participation, attendance, retention, and user feedback, organizations can identify successful programs, detect drop-offs early, and continuously improve offerings.