
What is a Gastroenterology Hospital Diagnostics Dashboard?
A Gastroenterology Hospital Diagnostics Dashboard is a specialized healthcare performance tool designed to monitor diagnostic procedure volumes, room utilization, equipment downtime, patient revenue, and net margins. It provides administrators and clinicians with real-time insights into diagnostic efficiency, enabling hospitals to streamline workflows, optimize equipment usage, and enhance financial outcomes while maintaining high standards of patient care.
This diagnostics dashboard template ensures that gastroenterology hospitals can track utilization trends, identify bottlenecks, and align diagnostic capacity with patient demand.
How To Create a Gastroenterology Hospital Diagnostics Dashboard
You don’t need to build your report from scratch—just start with a ready-to-use sample Gastroenterology Hospital Diagnostics Dashboard template from Mokkup. Add in your data and export it however you like. Here’s how to do it:
1. Create or Log in to Your Mokkup Account
Start by signing up on Mokkup.ai using your email. If you already have an account, just log in, and you’ll be good to go.
2. Choose and Customize Your Dashboard Template
You can find the Gastroenterology Hospital Diagnostics Dashboard template in the Templates section. Use the drag-and-drop editor to adjust KPIs, edit filters, or add elements based on your data.
3. Export to Your BI Tool
Once your dashboard wireframe is ready, use the BI Tool Export feature to send it directly to Power BI or Tableau for further analysis and enhancements. You can also download the dashboard as a PDF, PNG, or JPEG, embed it on a platform, or invite your team to collaborate.
Note: This is a Pro template. You’ll need a Pro subscription on Mokkup to use and customize this dashboard wireframe. Upgrade anytime to unlock full access.
Gastroenterology Hospital Diagnostics Dashboard Example
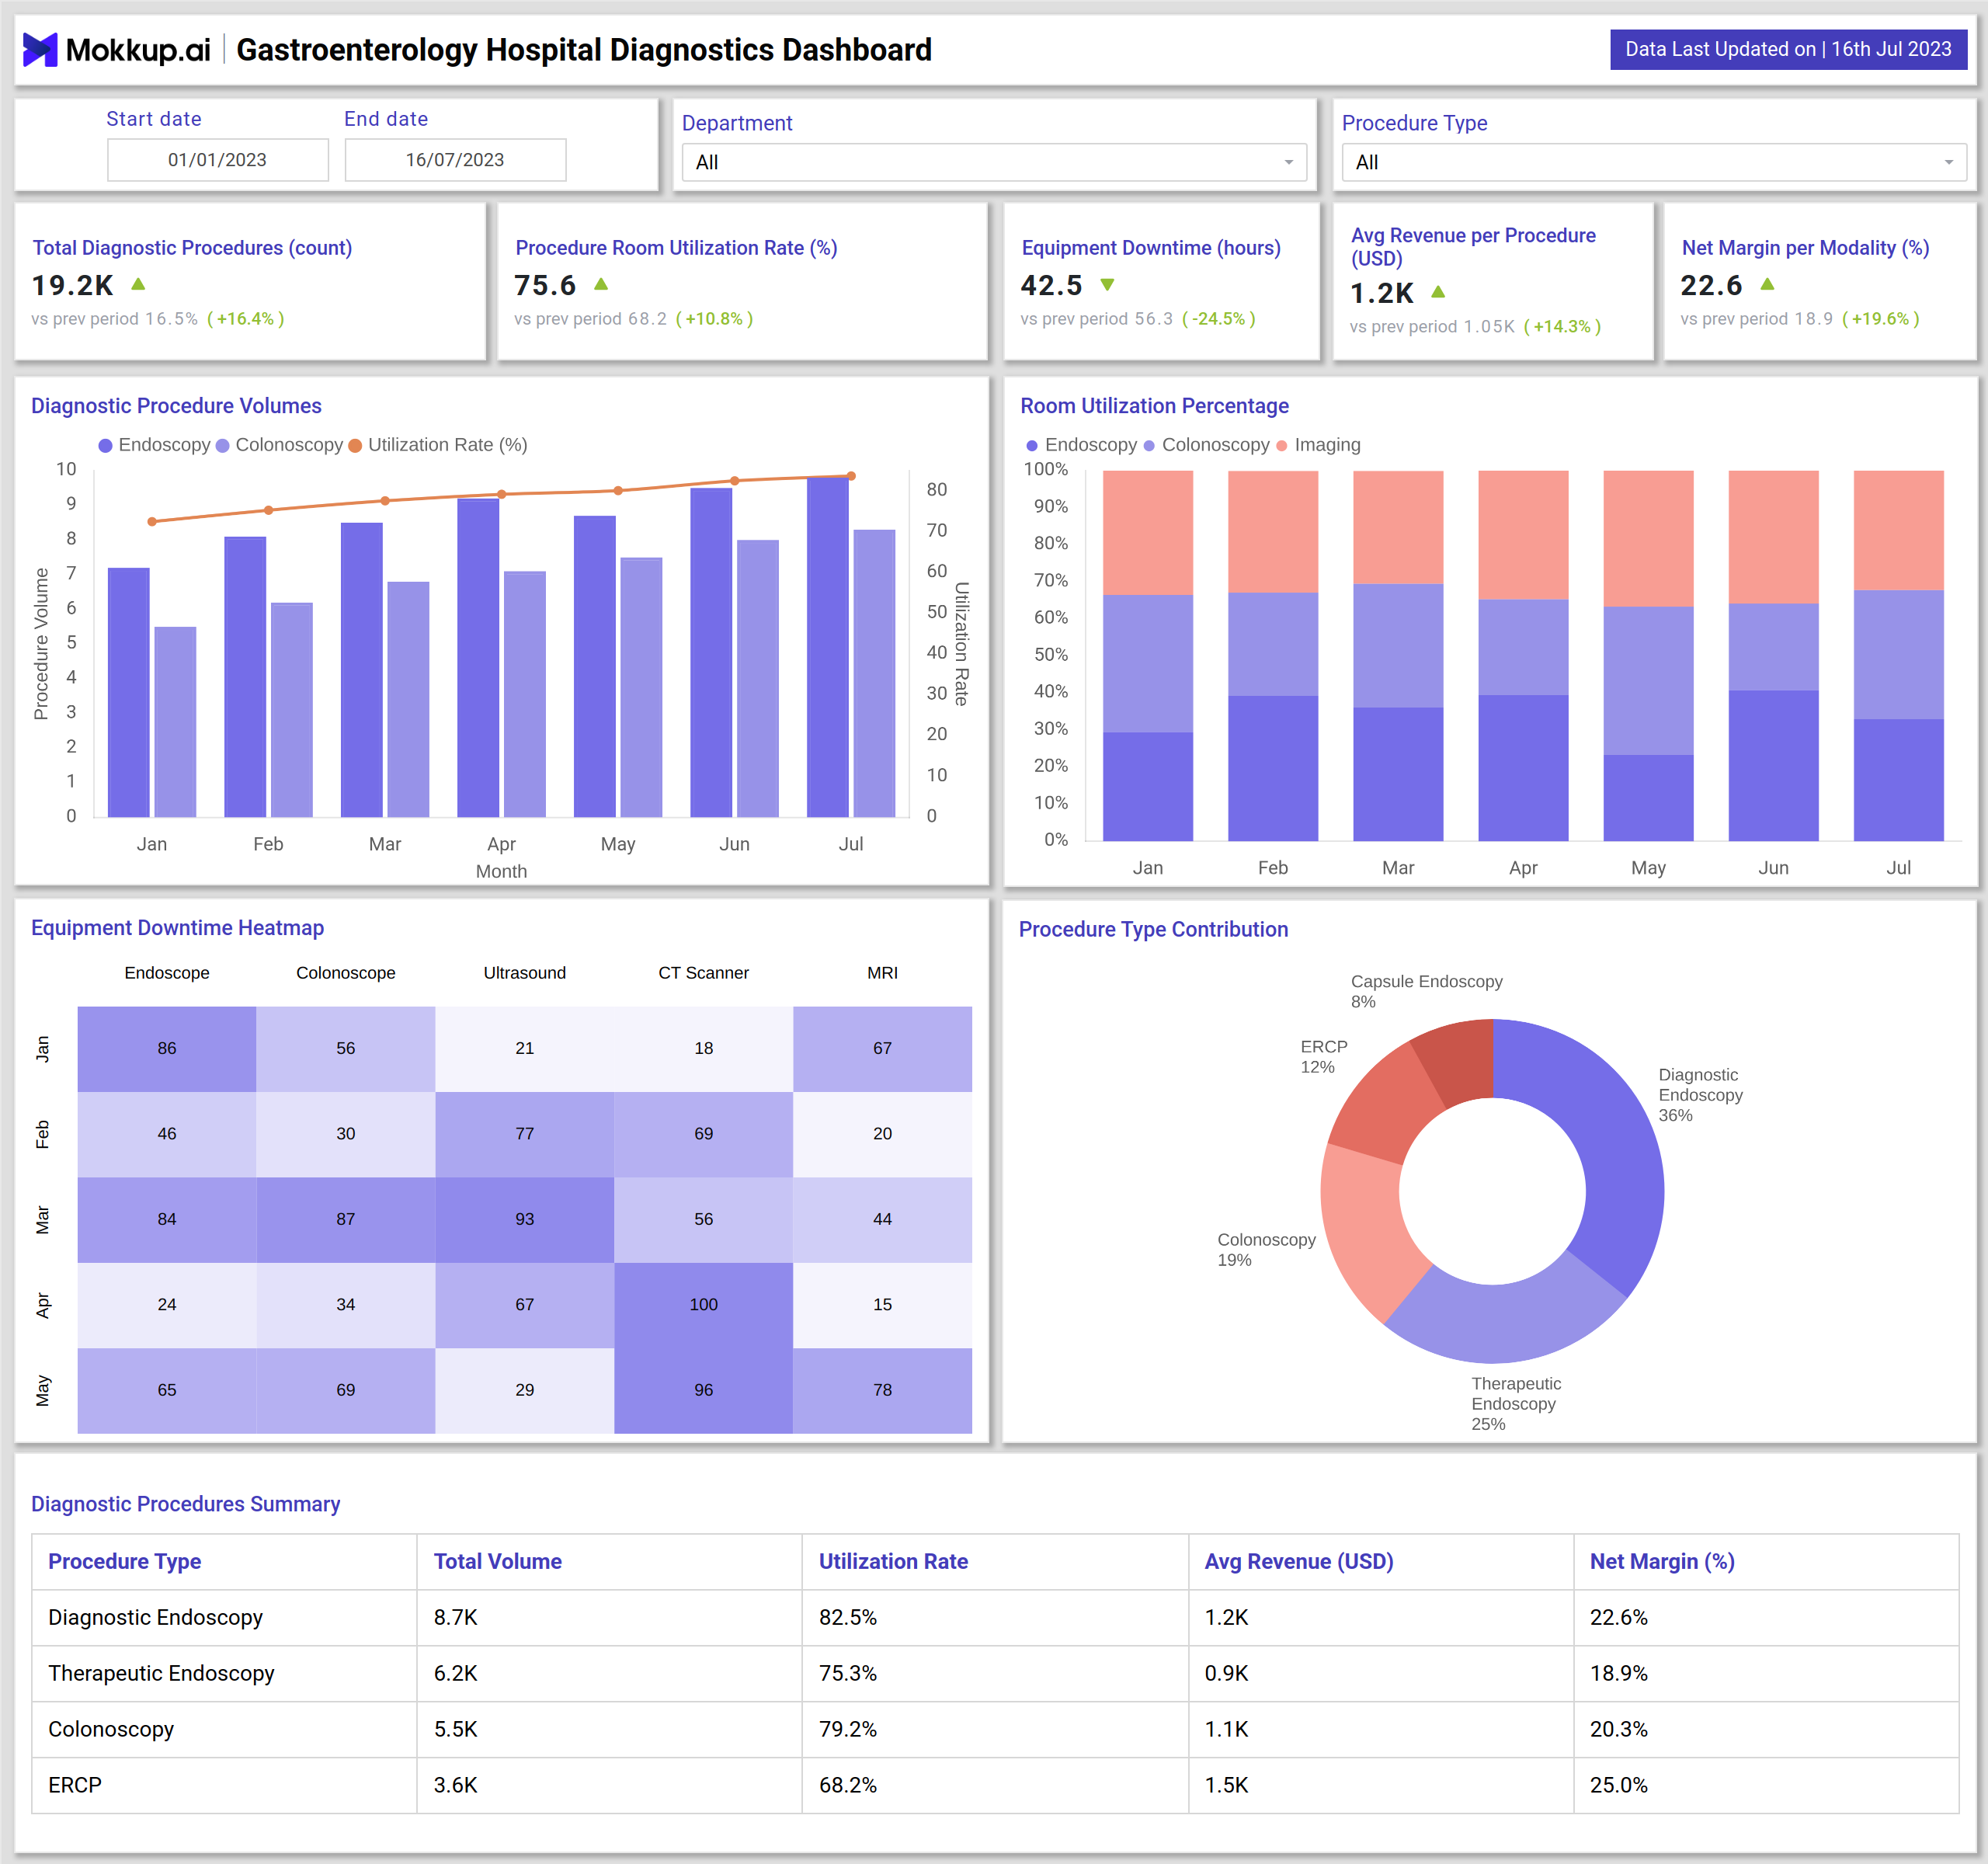
The example dashboard offers a comprehensive view of diagnostic operations through multiple KPIs and visualization panels. It tracks diagnostic procedure volumes, helping hospitals evaluate demand across tests like endoscopy, colonoscopy, and imaging. Room utilization percentage provides insights into how effectively diagnostic rooms are being managed, ensuring optimal resource distribution.
Equipment downtime analysis highlights inefficiencies across endoscopes, CT scanners, ultrasounds, and other machines, supporting proactive maintenance planning. The procedure type contribution chart breaks down diagnostic categories such as diagnostic endoscopy, therapeutic endoscopy, colonoscopy, ERCP, and capsule endoscopy to better understand resource allocation.
Financial KPIs such as average revenue per patient and net margin per modality provide visibility into profitability, while the diagnostic procedures summary highlights total volumes, utilization rates, and revenue by procedure type. Together, these insights empower hospital leaders to balance clinical efficiency with financial sustainability.
This gastroenterology diagnostics dashboard template enhances visibility into diagnostic workflows and aligns operational and financial goals for better patient outcomes.
How to Analyze Data in Gastroenterology Diagnostics Dashboards
To maximize the value of a gastroenterology hospital diagnostics dashboard template, administrators should:
- Track Procedure Volumes: Monitor trends in diagnostic tests to allocate resources effectively.
- Measure Room Utilization: Ensure procedure rooms are being used optimally to reduce bottlenecks.
- Analyze Equipment Downtime: Use downtime data as part of an incident tracking and performance dashboard to prioritize preventive maintenance.
- Evaluate Profitability: Assess net margins and average revenue per patient to identify high- and low-performing modalities.
- Optimize Diagnostic Mix: Balance between diagnostic and therapeutic procedures to align with patient demand and financial goals.
Benefits of Gastroenterology Hospital Diagnostics Dashboards
Implementing a diagnostic performance monitoring dashboard in gastroenterology hospitals provides several advantages:
- Operational Efficiency: Real-time visibility into procedure volumes and room utilization improves scheduling and throughput.
- Cost Savings: Proactive equipment maintenance reduces downtime and prevents costly delays.
- Financial Insights: Net margin analysis highlights profitable diagnostic services.
- Improved Patient Flow: Efficient utilization of diagnostic resources shortens waiting times and enhances patient satisfaction.
- Strategic Decision-Making: Supports hospital leaders in planning resource allocation and capacity expansion.
KPIs to Track in Gastroenterology Hospital Diagnostics Dashboards
Tracking these KPIs helps hospitals evaluate diagnostic efficiency, financial performance, and resource utilization within gastroenterology departments:
- Total Diagnostic Procedures (count): Monitors the volume of diagnostic tests conducted.
- Procedure Room Utilization Rate (%): Evaluates how efficiently diagnostic rooms are used.
- Equipment Downtime (hours): Tracks machine downtime to reduce disruptions.
- Average Revenue per Patient (USD): Assesses financial return per patient served.
- Net Margin per Modality (%): Measures profitability across different diagnostic procedures.
Frequently Asked Questions
Q1. Why is a gastroenterology hospital diagnostics dashboard important?
It provides real-time insights into diagnostic volumes, room utilization, and financial performance, helping hospitals improve efficiency and profitability.
Q2. How does this dashboard support data-driven decision-making?
It helps hospital administrators identify underutilized equipment, analyze cost trends, and allocate resources more effectively, leading to improved operational performance and patient outcomes.
Q3. Which departments benefit most from this dashboard?
Gastroenterology, oncology, imaging, and surgical departments benefit most by optimizing diagnostic operations and resource allocation.