What is a Gastroenterology Hospital Operations Dashboard?
A Gastroenterology Hospital Operations Dashboard is a healthcare management tool that monitors hospital operations across outpatient, inpatient, and emergency care. By integrating patient flow, bed utilization, procedure efficiency, and discharge trends, this dashboard helps administrators optimize resources, reduce wait times, and enhance patient care quality.
This operations dashboard template provides real-time visibility into OPD visits, ER admissions, inpatient census, ICU/bed usage, and surgical/endoscopy efficiency. Hospitals can leverage it as a real-time hospital performance monitoring dashboard to improve clinical workflows and operational outcomes.
How To Create a Gastroenterology Hospital Operations Dashboard
You don’t need to build your report from scratch—just start with a ready-to-use sample Gastroenterology hospital operations dashboard template from Mokkup. Add in your data and export it however you like. Here’s how to do it:
1. Create or Log in to Your Mokkup Account
Start by signing up on Mokkup.ai using your email. If you already have an account, just log in, and you’ll be good to go.
2. Choose and Customize Your Dashboard Template
You can find the Gastroenterology Hospital Operations Dashboard template in the Templates section. Use the drag-and-drop editor to adjust KPIs, edit filters, or add elements based on your data.
3. Export to Your BI Tool
Once your dashboard wireframe is ready, use the BI Tool Export feature to send it directly to Power BI or Tableau for further analysis and enhancements. You can also download the dashboard as a PDF, PNG, or JPEG, embed it on a platform, or invite your team to collaborate.
Note: This is a Pro template. You’ll need a Pro subscription on Mokkup to use and customize this dashboard wireframe. Upgrade anytime to unlock full access.
Gastroenterology Hospital Operations Dashboard Example
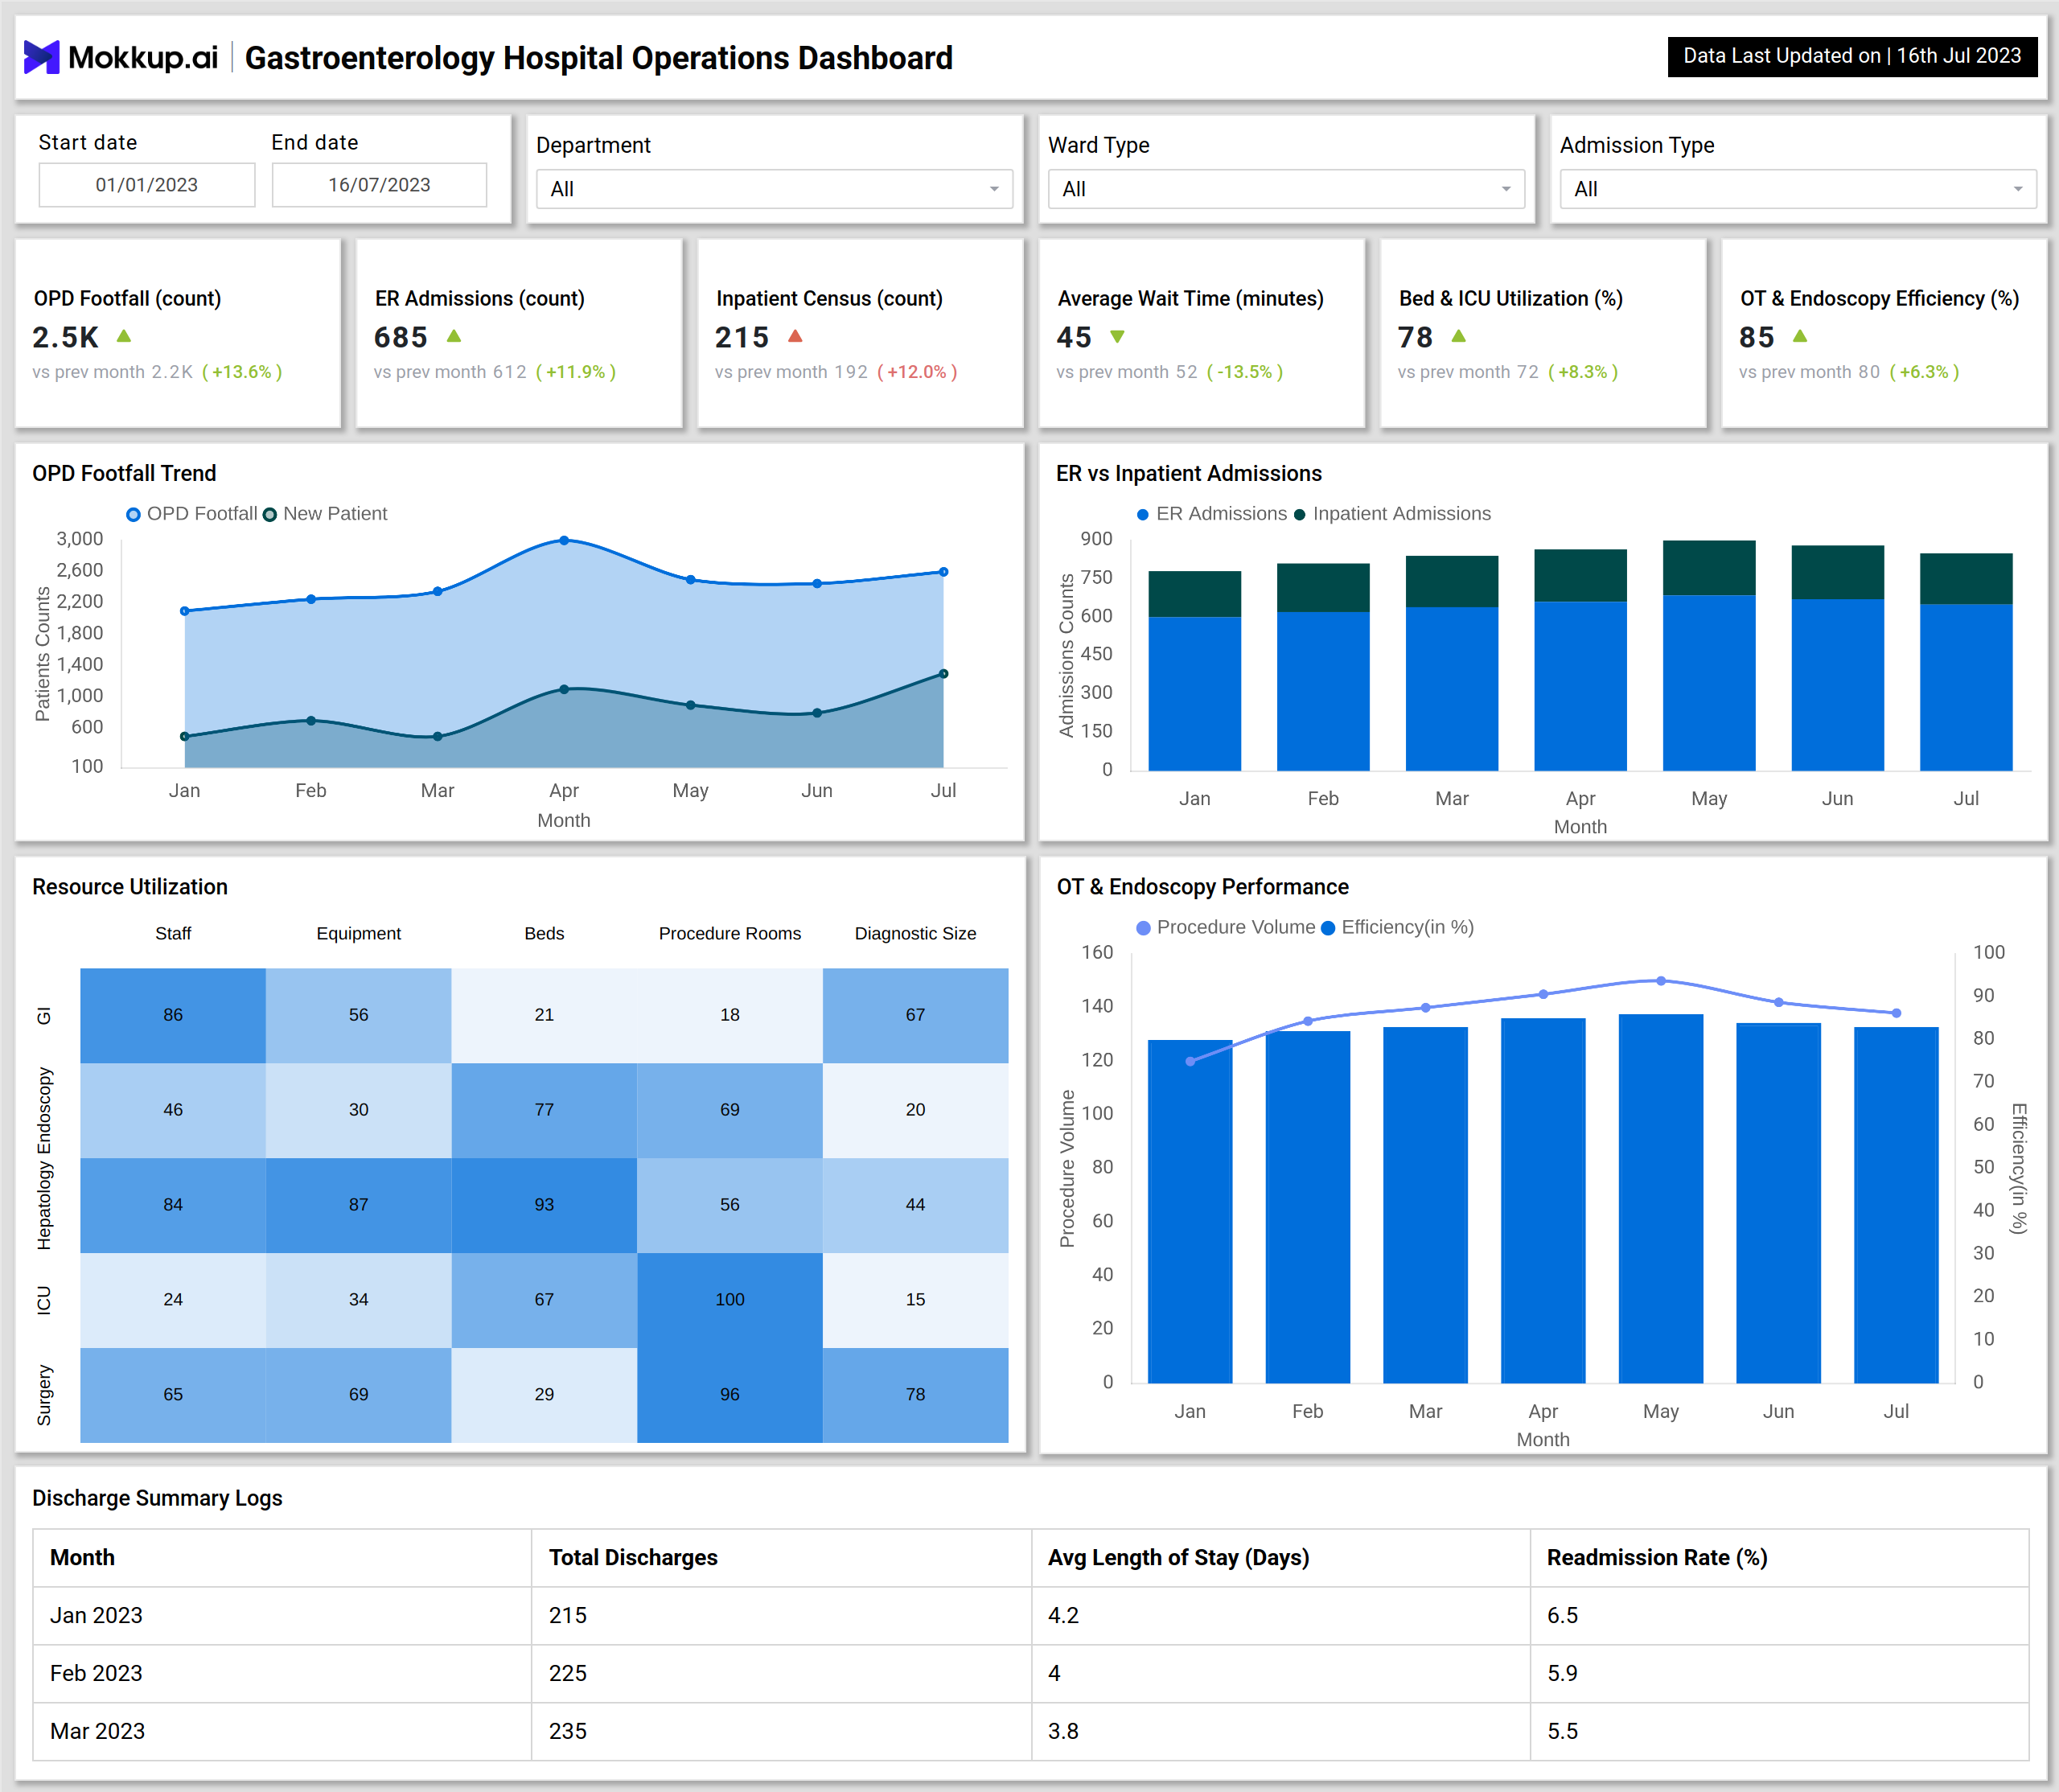
The example dashboard offers a comprehensive overview of hospital operations by combining multiple KPIs and visual insights into a single, intuitive interface. It monitors OPD footfall trends, ER admissions, and inpatient census to ensure hospitals remain prepared for patient inflow at all times. Alongside this, it tracks average wait times, ICU occupancy, and overall bed utilization, helping administrators balance capacity and demand effectively while minimizing delays in patient care.
The dashboard also measures OT and endoscopy performance by evaluating procedure volumes and efficiency rates, highlighting areas where surgical and diagnostic services can improve turnaround time and optimize resource usage. A dedicated heatmap provides deeper insights into resource distribution across GI, hepatology, ICU, and surgical units, enabling hospitals to quickly identify bottlenecks in staff, equipment, or procedure room availability. Additionally, discharge logs by month, average length of stay, and readmission rates are closely tracked to assess continuity of care and recovery outcomes. Overall, this gastroenterology operations dashboard not only provides clear visibility into clinical efficiency but also ensures stronger alignment between hospital operational capacity and evolving patient needs.
How to Analyze Data in Gastroenterology Operations Dashboards
To extract value from a gastroenterology hospital operations dashboard template, healthcare leaders should:
- Monitor Patient Inflow Patterns – The gastroenterology resource utilization dashboard shows OPD and ER trends, allowing you to forecast demand and optimize staffing.
- Evaluate Wait Times & Utilization – Balance patient load with bed and ICU usage to reduce overcrowding.
- Track Procedure Efficiency – Measure OT and endoscopy turnaround time to improve patient throughput.
- Assess Resource Allocation – Analyze staff, equipment, and room distribution to address inefficiencies.
- Review Readmission & Stay Metrics – Reduce readmission rates by linking discharge planning with post-care follow-ups.
Benefits of Gastroenterology Hospital Operations Dashboards
Implementing a Gastroenterology Hospital Operations Dashboard provides significant benefits, making it an essential addition to the hospital operations efficiency dashboards. Some of them are:
- Improved Patient Flow: Ensures smooth transitions from OPD to ER to inpatient care.
- Operational Efficiency: Optimizes bed and procedure room allocation for maximum capacity usage.
- Enhanced Patient Satisfaction: Reduces wait times and improves treatment turnaround.
- Data-Driven Decision Making: Provides administrators with real-time KPIs for immediate action.
- Quality of Care Improvement: Links operational performance with clinical outcomes such as readmissions and recovery rates.
KPIs to Track in Gastroenterology Operations Dashboards
- OPD Footfall (count): Total number of outpatient visits, indicating service demand.
- ER Admissions (count): Tracks emergency patient load and hospital responsiveness.
- Inpatient Census (count): Monitors admitted patients for capacity planning.
- Average Wait Time (minutes): Measures patient experience and service efficiency.
- OT & Endoscopy Efficiency (%): Evaluates the effectiveness of surgical and diagnostic procedures.
Frequently Asked Questions
1. Why is a Gastroenterology Hospital Operations Dashboard important?
It enables hospitals to manage patient flow, resource allocation, and clinical efficiency, ensuring improved patient care and operational performance.
2. Who benefits from this dashboard?
Hospital administrators, operations managers, GI specialists, and quality teams can all leverage this dashboard to track efficiency and patient outcomes.
3. What insights can a Gastroenterology Resource Utilization Dashboard provide?
It helps identify underused or overburdened resources by analyzing staff schedules, equipment usage, and procedure room occupancy. This enables data-driven decisions to balance workloads and improve capacity management.