What is a Heart Center Patient Care & Quality Dashboard?
The Heart Center Patient Care & Quality Dashboard is a centralized, real-time tool for hospital leadership and care teams. It provides visibility into patient outcomes, procedure volumes, operational efficiency, and care quality. Executives and physicians can track trends, monitor KPIs, and make data-driven decisions to improve patient care and operational performance from this heart center dashboard.
How to Create a Heart Center Patient Care Dashboard
You don’t need to build your report from scratch—start with a ready-to-use Heart Center Patient Care & Quality Dashboard template from Mokkup. Add in your hospital data and export it as needed. Steps include:
1. Create or Log in to Your Mokkup Account
Sign up on Mokkup.ai using your email, or log in if you already have an account.
2. Choose and Customize Your Dashboard Template
Find the Heart Center Patient Care & Quality Dashboard template in the Templates section. Use the drag-and-drop editor to adjust KPIs, add filters, or insert visuals based on your data.
3. Export to Your BI Tool
Once your dashboard wireframe is ready, use the BI Tool Export feature to send it to Power BI or Tableau for deeper analysis. You can also download the dashboard as a PDF, PNG, or JPEG, embed it on a hospital portal, or invite your team to collaborate.
Note: This is a Pro template. You’ll need a Pro subscription on Mokkup to use and customize this dashboard wireframe. Upgrade anytime to unlock full access.
Heart Center Patient Care & Quality Dashboard Example
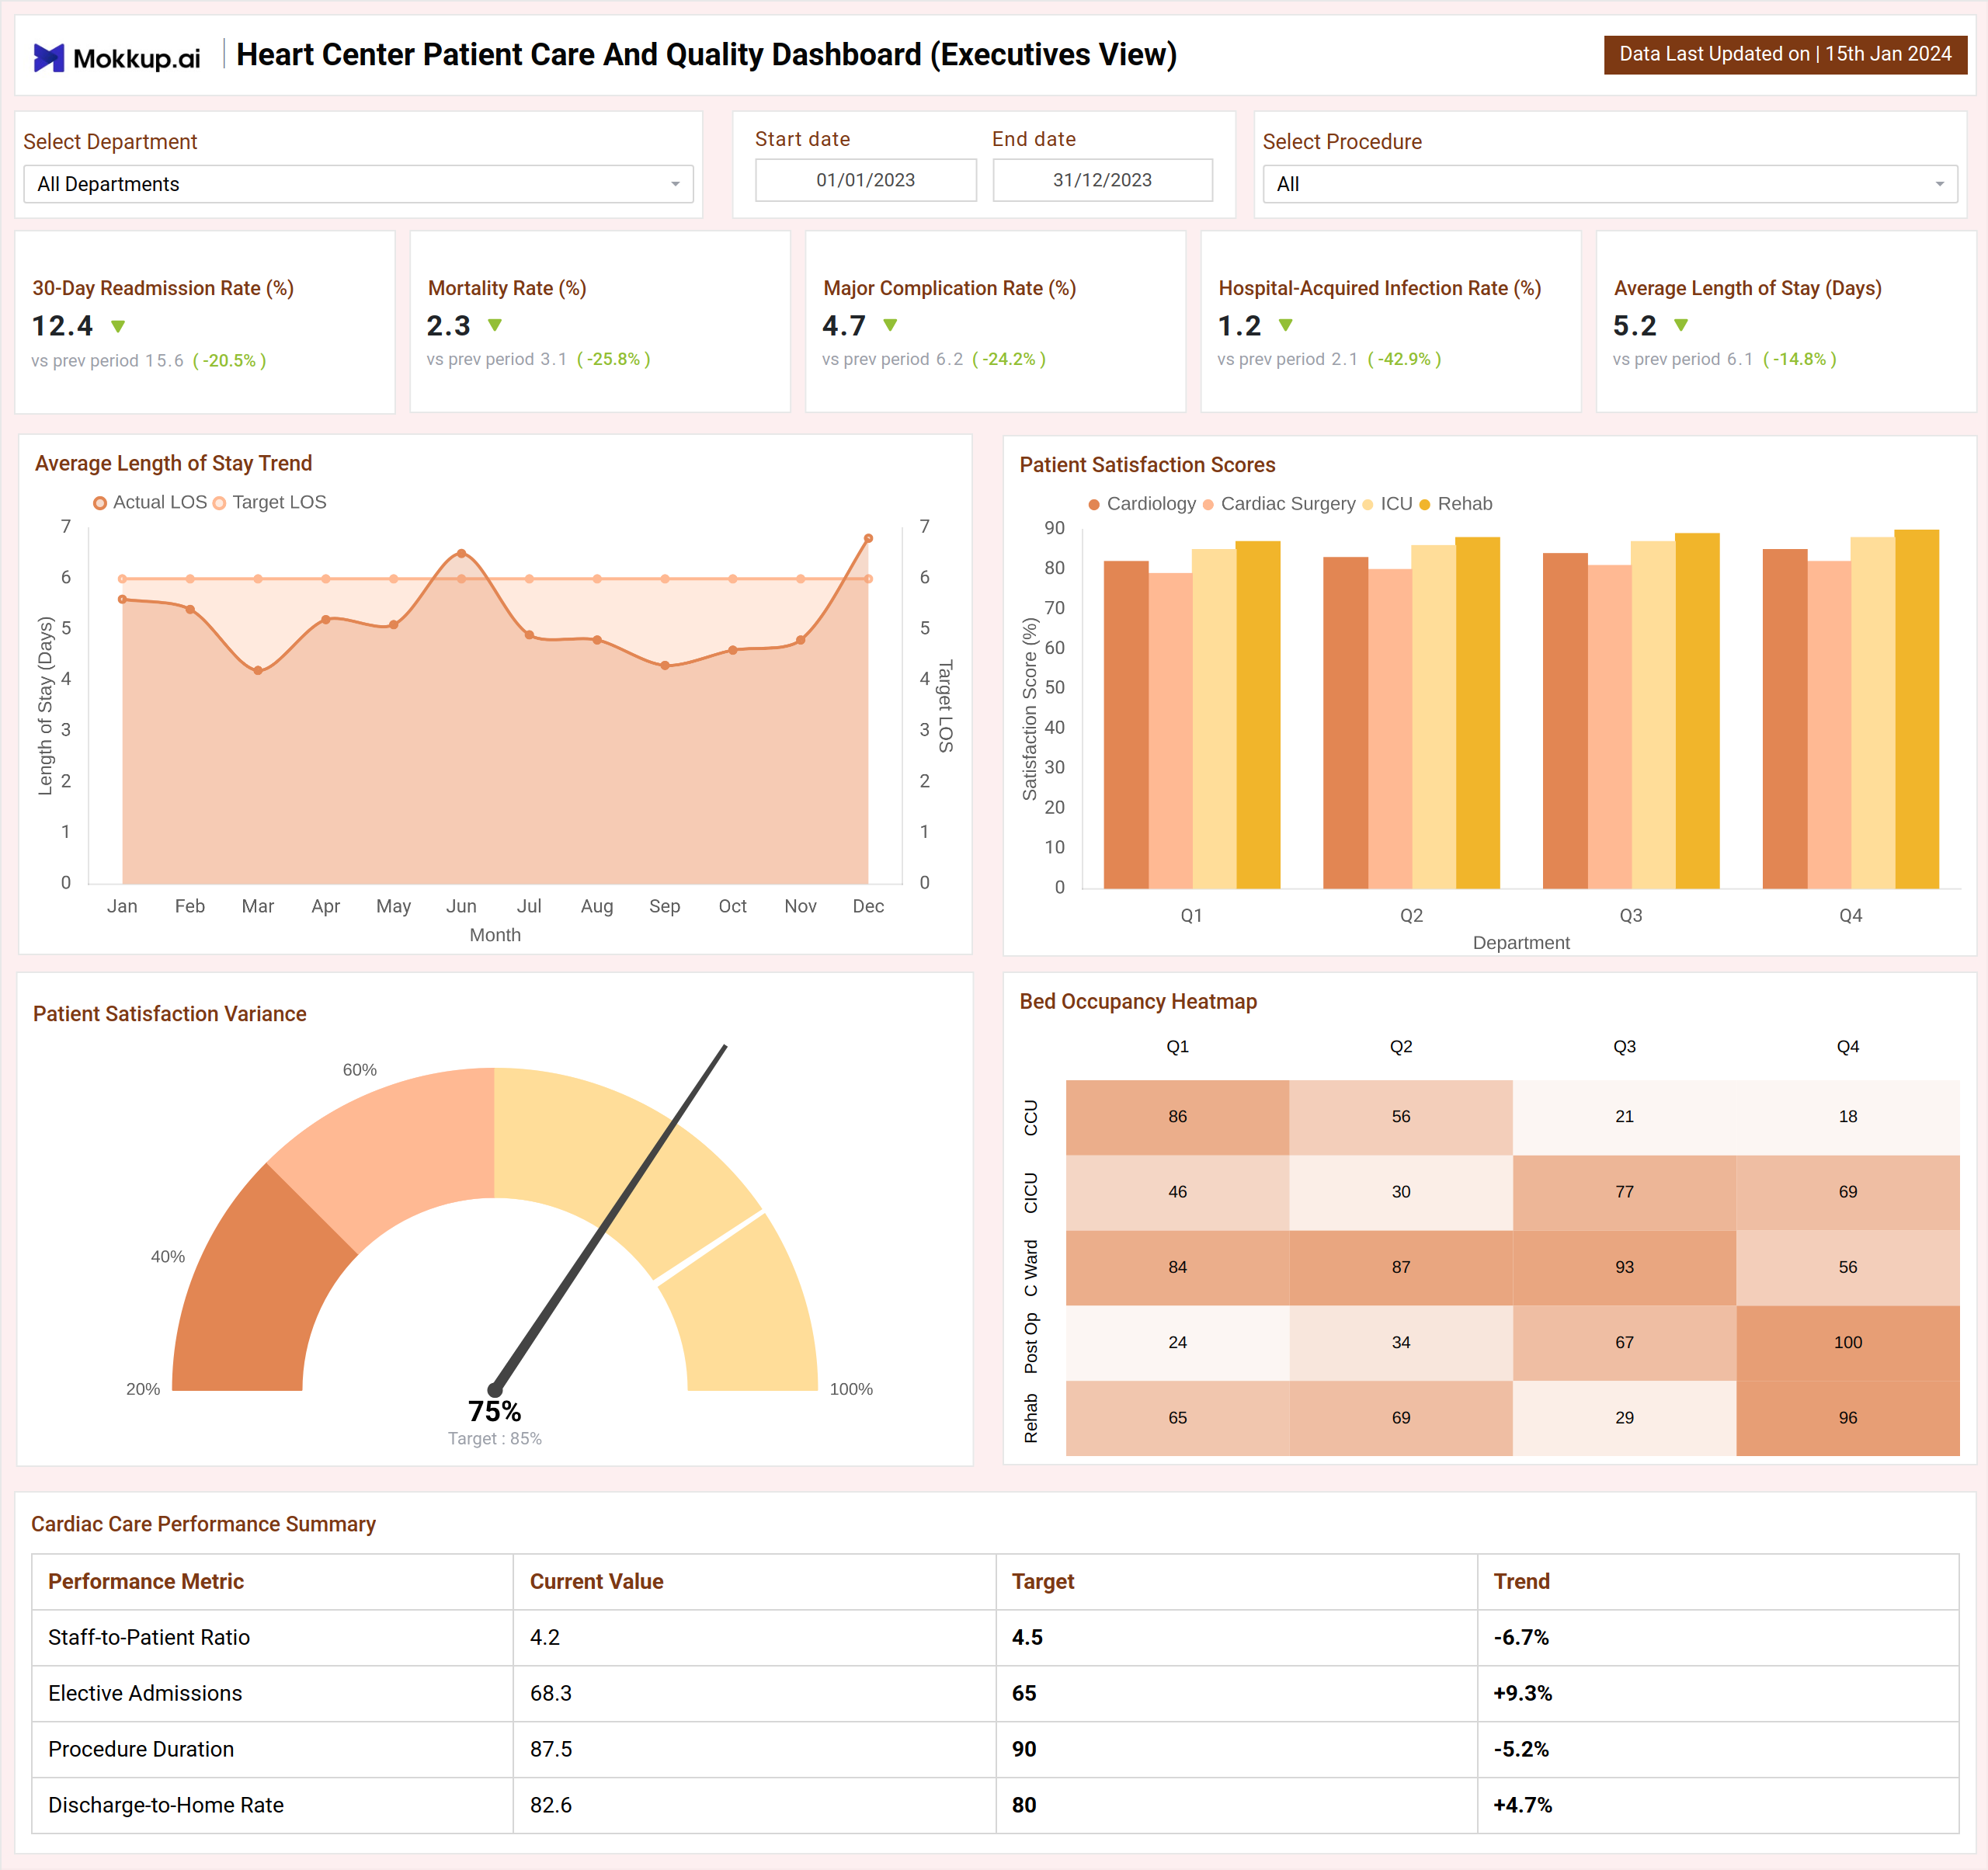
From this real-time heart center Patient care & quality dashboard, you can track many Cardiology KPIs that can provide a wholesome view of patient progress and care.
- KPI Cards: Readmission rate, mortality, complication rate, procedure volumes, intervention response, patient satisfaction.
- Charts: Trends in CABG, Angioplasty, Stent Placement, length of stay, and procedure compliance.
- Tables: Drill-down by patient, physician, or department for operational monitoring.
- Maps: Patient geographic distribution to track service reach.
How to Analyze Data in Heart Center Patient Care & Quality Dashboard
Analyzing data in a Heart Center dashboard goes beyond looking at numbers — it’s about connecting metrics to patient outcomes and care quality. Here’s a structured approach:
- Review Key Patient Metrics – Start with admissions, discharges, readmission rates, and average length of stay to understand patient flow and outcomes.
- Check Quality and Safety Indicators – Focus on mortality rates, post-surgery complications, infection rates, and adherence to care protocols to measure care standards.
- Evaluate Patient Experience – Look at satisfaction scores, wait times, and overall feedback to identify areas that impact patient perception and trust.
- Monitor Operational Efficiency – Analyze resource utilization, staff-to-patient ratios, and workflow effectiveness to detect bottlenecks in service delivery.
- Compare Trends Over Time – Use historical data to track improvements, spot early risks, and measure the impact of interventions on patient outcomes.
- Turn Insights into Action – Share results with care teams in an understandable format and set measurable goals to improve both quality and efficiency.
Benefits of Heart Center Patient Care & Quality Dashboard
The following are benefits of implementing this dashboard:
- Real-time visibility: Combines quality, outcomes, and efficiency metrics.
- Optimized operations: Monitors ICU, CCU, and ward utilization.
- Data-driven decisions: Connects clinical and operational KPIs.
- Enhanced patient care: Identifies risks and monitors recovery.
- Compliance support: Tracks quality and safety for audits.
KPIs to Track in Heart Center Patient Care & Quality Dashboard
The key KPIs include for patient care analytics:
- Patient Outcomes: Readmission Rate (%), Mortality Rate (%), Major Complications (%)
- Procedures & Compliance: CABG, Angioplasty, Stent Placement volumes, Procedure Compliance (%)
- Operations: Bed Occupancy (%), ICU/CCU Utilization (%), Length of Stay, Intervention Response Time
- Patient Experience: Satisfaction Score (NPS), Follow-up Compliance (%)
- Staff & Admissions: Staff-to-Patient Ratio, Elective vs Emergency Admissions (%)
Frequently Asked Questions
1. Why is such a dashboard important for heart care?
It allows clinicians and administrators to track critical metrics like readmission rates, complications, recovery timelines, and patient satisfaction, ensuring evidence-based decisions and improved patient outcomes.
2. What kind of data does the dashboard include?
The dashboard typically covers patient metrics (admissions, discharges, recovery rates), quality and safety indicators (mortality, infection rates), patient experience data (satisfaction, wait times), and operational metrics (bed occupancy, staff utilization).
3. Who can use this dashboard?
It’s designed for cardiologists, care teams, hospital administrators, and quality managers to gain insights into patient care and organizational performance.