What is a CNG Fleet & Retail Customer Performance Dashboard?
A CNG Fleet & Retail Customer Performance Dashboard template is a comprehensive visualization platform designed to monitor, analyze, and optimize customer relationships and sales performance across Compressed Natural Gas (CNG) distribution networks. It consolidates critical customer and business metrics, including active customers, volume sold, contract renewal rates, customer churn rate, average fleet size, and customer satisfaction ratings into a unified, interactive interface.
By integrating CNG customer analytics, fleet performance tracking, retail sales monitoring, contract renewal management, and customer segmentation analysis, this dashboard enables sales managers, customer relationship teams, fleet coordinators, and business development leadership to understand customer behavior, identify growth opportunities, reduce churn, optimize contract management, and drive revenue growth across both fleet and retail customer segments. It serves as a central command center for data-driven customer performance management in CNG operations.
How to Create a CNG Fleet & Retail Customer Performance Dashboard
You don’t need to build your report from scratch—just start with a ready-to-use CNG Fleet & Retail Customer Performance dashboard template from Mokkup. Add in your data and export it however you like. Here’s how to do it:
1. Create or Log in to Your Mokkup Account
Start by signing up on Mokkup.ai using your email. If you already have an account, just log in, and you’ll be good to go.
2. Choose and Customize Your Dashboard Template
Find the CNG Fleet & Retail Customer Performance Dashboard template in the Templates section. Use the drag-and-drop editor to adjust KPIs, edit filters, or add elements based on your data.
3. Export to Your BI Tool
Once your dashboard wireframe is ready, use the BI Tool Export feature to send it directly to Power BI or Tableau for further analysis and enhancements. You can also download the dashboard as a PDF, PNG, or JPEG, embed it on a platform, or invite your team to collaborate.
Note: This is a Pro template. You’ll need a Pro subscription on Mokkup to use and customize this dashboard wireframe. Upgrade anytime to unlock full access.
CNG Fleet & Retail Customer Performance Dashboard Example
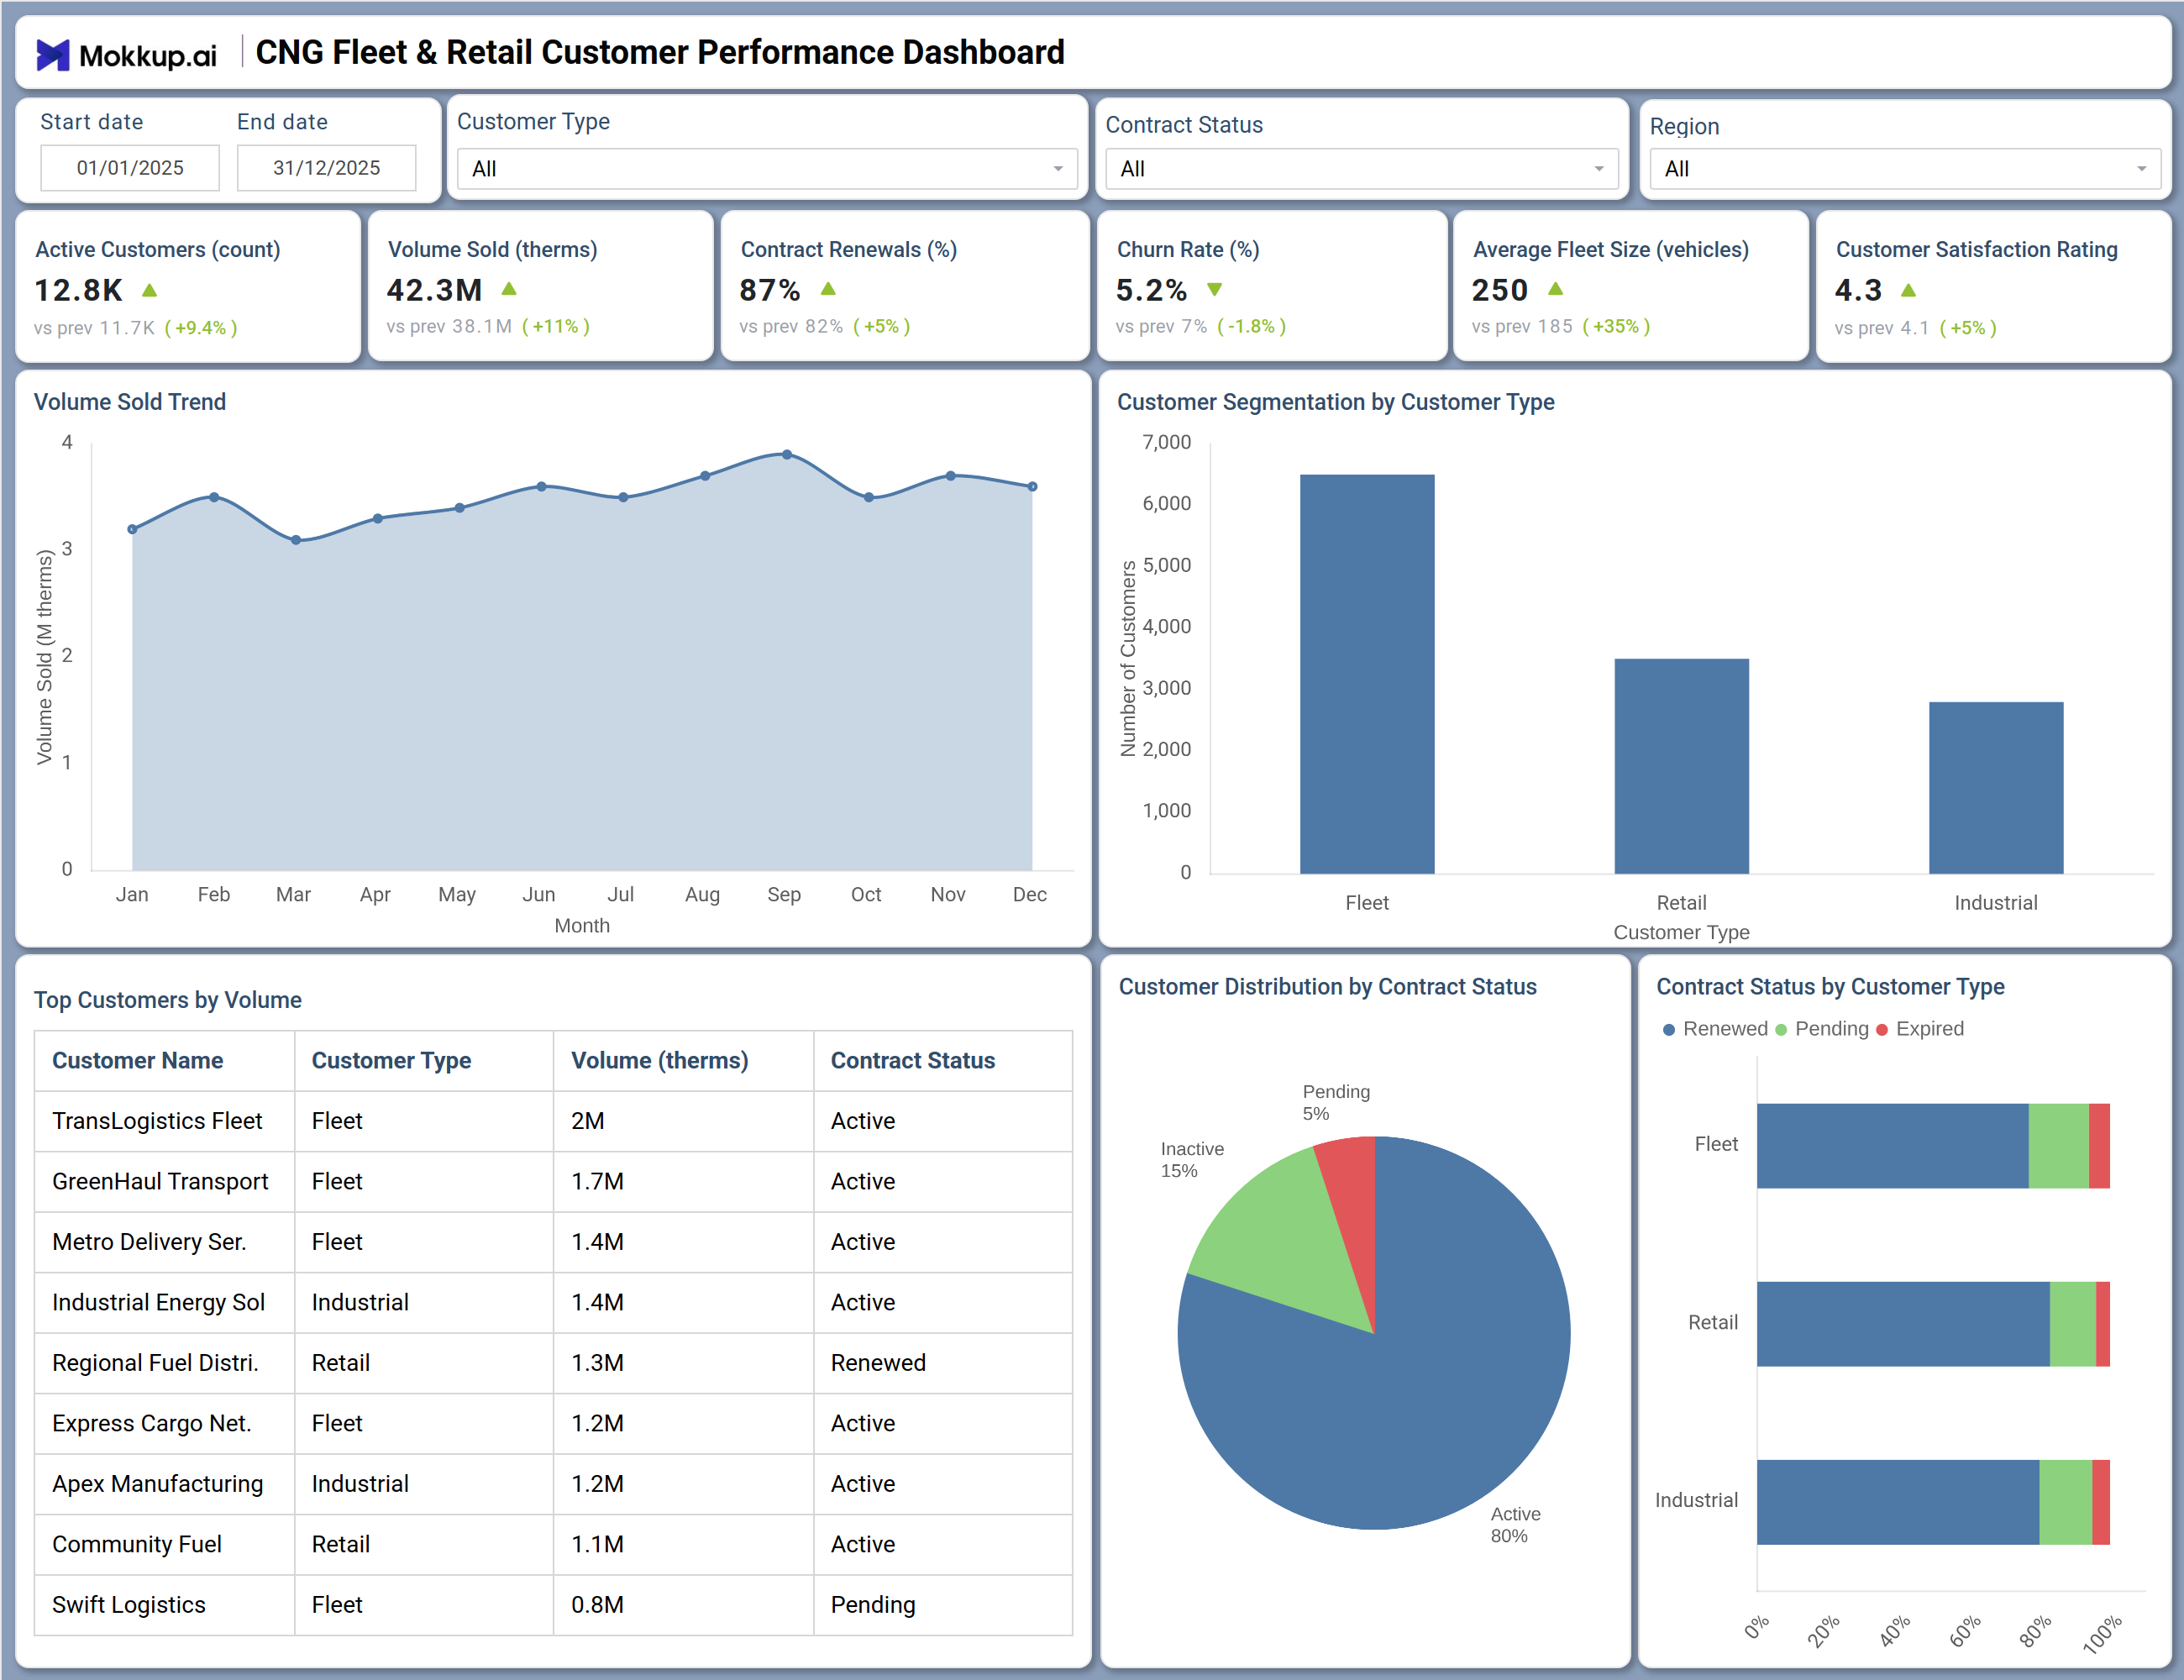
This dashboard delivers a comprehensive view of customer performance and sales analytics across CNG operations. The Overview screen prominently displays six critical customer KPIs with trend indicators: Active Customers at 12.8K (9.4% growth from prior period), Volume Sold at 42.3M therms (11% increase), Contract Renewals at 87% (5 percentage point improvement), Churn Rate reduced to 5.2% (1.8 percentage point decrease), Average Fleet Size at 250 vehicles (35% growth), and Customer Satisfaction Rating at 4.3 (5% improvement).
The Volume Sold Trend chart tracks monthly therms sold from January through December, revealing seasonal patterns and validating the impact of sales initiatives. Customer Segmentation by Customer Type provides a visual breakdown of the customer base across Retail and Industrial segments, enabling targeted marketing and service strategies. Additional segmentation views show Fleet Distribution by Contract Status (Renewed, Pending, Expired) and Contract Status by Customer Type, providing granular visibility into contract renewal risks.
The Top Customers by Volume table lists key accounts with their customer type, volume, and contract status, including TransLogistics Fleet (2M therms, Active), GreenHaul Transport (1.7M therms, Active), and Swift Logistics (0.8M therms, Pending)—enabling focused relationship management for high-value customers. Customer Distribution by Contract Status pie chart shows the overall portfolio health with 85% Active contracts and 15% Inactive, providing a quick visual on customer retention performance. Together, these components enable CNG customer analytics, fleet performance tracking, contract renewal management, and data-driven sales strategy development.
How to Analyze Data in a CNG Fleet & Retail Customer Performance Dashboard
Here is how you can analyze data from this dashboard:
- Customer Growth Analysis: Monitor Active Customers over time to assess acquisition trends.
- Consumption Trend Tracking: Track Volume Sold monthly to understand usage patterns.
- Retention Performance Review: Analyze Contract Renewals to evaluate retention effectiveness.
- Churn Analysis: Monitor Churn Rate to identify attrition risks and take corrective action.
- Fleet Expansion Insights: Examine Average Fleet Size to identify growth and upsell opportunities.
- Customer Satisfaction Monitoring: Evaluate Customer Satisfaction Rating to assess service quality and retention risk.
- Customer Segmentation Analysis: Use segmentation data to understand customer mix and tailor strategies.
- Key Account Prioritization: Review Top Customers by Volume to focus on high-value accounts.
- Contract Risk Assessment: Analyze Contract Status by Customer Type to identify renewal risks.
- Portfolio Balance Evaluation: Review Customer Distribution by Contract Status for portfolio health.
Benefits of a CNG Fleet & Retail Customer Performance Dashboard
The following are the benefits of using this dashboard:
- Centralized Customer Visibility: Provides a unified view of customer and sales performance.
- Proactive Retention Management: Enables early identification of churn risks.
- Revenue Growth Support: Identifies high-value customers and consumption trends.
- Improved Renewal Rates: Strengthens contract renewal tracking and execution.
- Enhanced Customer Experience: Improves service quality through satisfaction monitoring.
- Data-Driven Sales Strategy: Supports segmentation-based targeting and planning.
- Optimized Account Management: Prioritizes key customers for better relationship management.
- Performance Transparency: Demonstrates customer and sales metrics to stakeholders clearly.
KPIs to Track in a CNG Fleet & Retail Customer Performance Dashboard
The following key KPIs can be tracked by using this dashboard:
- Active Customers (count): Total number of active CNG customers.
- Volume Sold (therms): Total natural gas volume sold in therms.
- Contract Renewals (%): Percentage of contracts renewed upon expiration.
- Churn Rate (%): Percentage of customers lost during the reporting period.
- Average Fleet Size (vehicles): Average number of vehicles per fleet customer.
- Customer Satisfaction Rating: Average customer satisfaction score (scale of 1-5).
- Volume Sold Trend: Monthly volume sold tracking over time.
- Customer Segmentation: Breakdown of customers by type (Retail, Industrial, Fleet).
- Contract Status Distribution: Percentage of contracts by status (Active, Inactive, Renewed, Pending, Expired).
- Top Customers by Volume: Ranked list of highest-volume customers with contract status.
- Customer Distribution by Contract Status: Overall portfolio health by contract status.
Frequently Asked Questions
Q1. Who is the intended audience for this dashboard?
This dashboard is designed for sales managers, customer relationship teams, fleet coordinators, business development leaders, and commercial executives who need to monitor customer performance, track sales volumes, and manage contract renewals across CNG operations.
Q2. Is this dashboard suitable for organizations with both fleet and retail customers?
Yes. The dashboard includes customer segmentation by type (Fleet, Retail, Industrial) and provides separate views for analyzing each segment's performance, contract status, and volume trends.
Q3. How does this dashboard help improve customer retention?
By tracking churn rate, contract renewal percentages, and contract status by customer type, the dashboard enables proactive identification of at-risk customers. The Top Customers by Volume table also helps prioritize retention efforts for high-value accounts.
Q4. What customer segments can be tracked in this dashboard?
The dashboard supports tracking across multiple customer types including Fleet customers (transportation companies, logistics providers), Retail customers (individual consumers, small businesses), and Industrial customers (manufacturing, processing facilities).
Q5. Is this dashboard useful for non-technical sales and customer service teams?
Absolutely. The dashboard presents customer data in clear, visual formats with intuitive charts, tables, and trend lines. Sales and customer service professionals can immediately understand customer performance metrics without requiring technical analytics expertise.