
What Is a Fire Incident Tracking & Resource Deployment Dashboard?
A fire incident tracking & resource deployment dashboard is a centralized analytics platform designed for municipal fire departments and emergency response teams. It consolidates incident data, personnel deployment, apparatus usage, and resource allocation into a single, actionable view. This fire department incident management system tool enables leaders to monitor response efficiency, optimize resource distribution, and improve public safety outcomes. By tracking fire incident reporting and analytics, the dashboard provides insights into incident trends, regional response patterns, and equipment utilization. Municipal fire departments use this emergency response resource deployment dashboard to assess performance, identify operational gaps, and make data-driven decisions for better emergency preparedness.
How to Create a Fire Incident Tracking & Resource Deployment Dashboard
You don't need to build your report from scratch, just start with a ready-to-use dashboard template from Mokkup. Add in your data and export it however you like. Here's how to do it:
1. Create or Log in to Your Mokkup Account
Start by signing up on Mokkup.ai using your email. If you already have an account, just log in, and you'll be good to go.
2. Choose and Customize Your Dashboard Template
Find the Fire Incident Tracking & Resource Deployment Dashboard template in the Templates section. Use the drag-and-drop editor to adjust KPIs, edit filters, or add elements based on your data.
3. Export to Your BI Tool
Once your dashboard wireframe is ready, use the BI Tool Export feature to send it directly to Power BI or Tableau for further analysis and enhancements. You can also download the dashboard as a PDF, PNG, or JPEG, embed it on a platform, or invite your team to collaborate.
Note: This is a Pro template. You'll need a Pro subscription on Mokkup to use and customize this dashboard wireframe. Upgrade anytime to unlock full access.
Fire Incident Tracking & Resource Deployment Dashboard Example
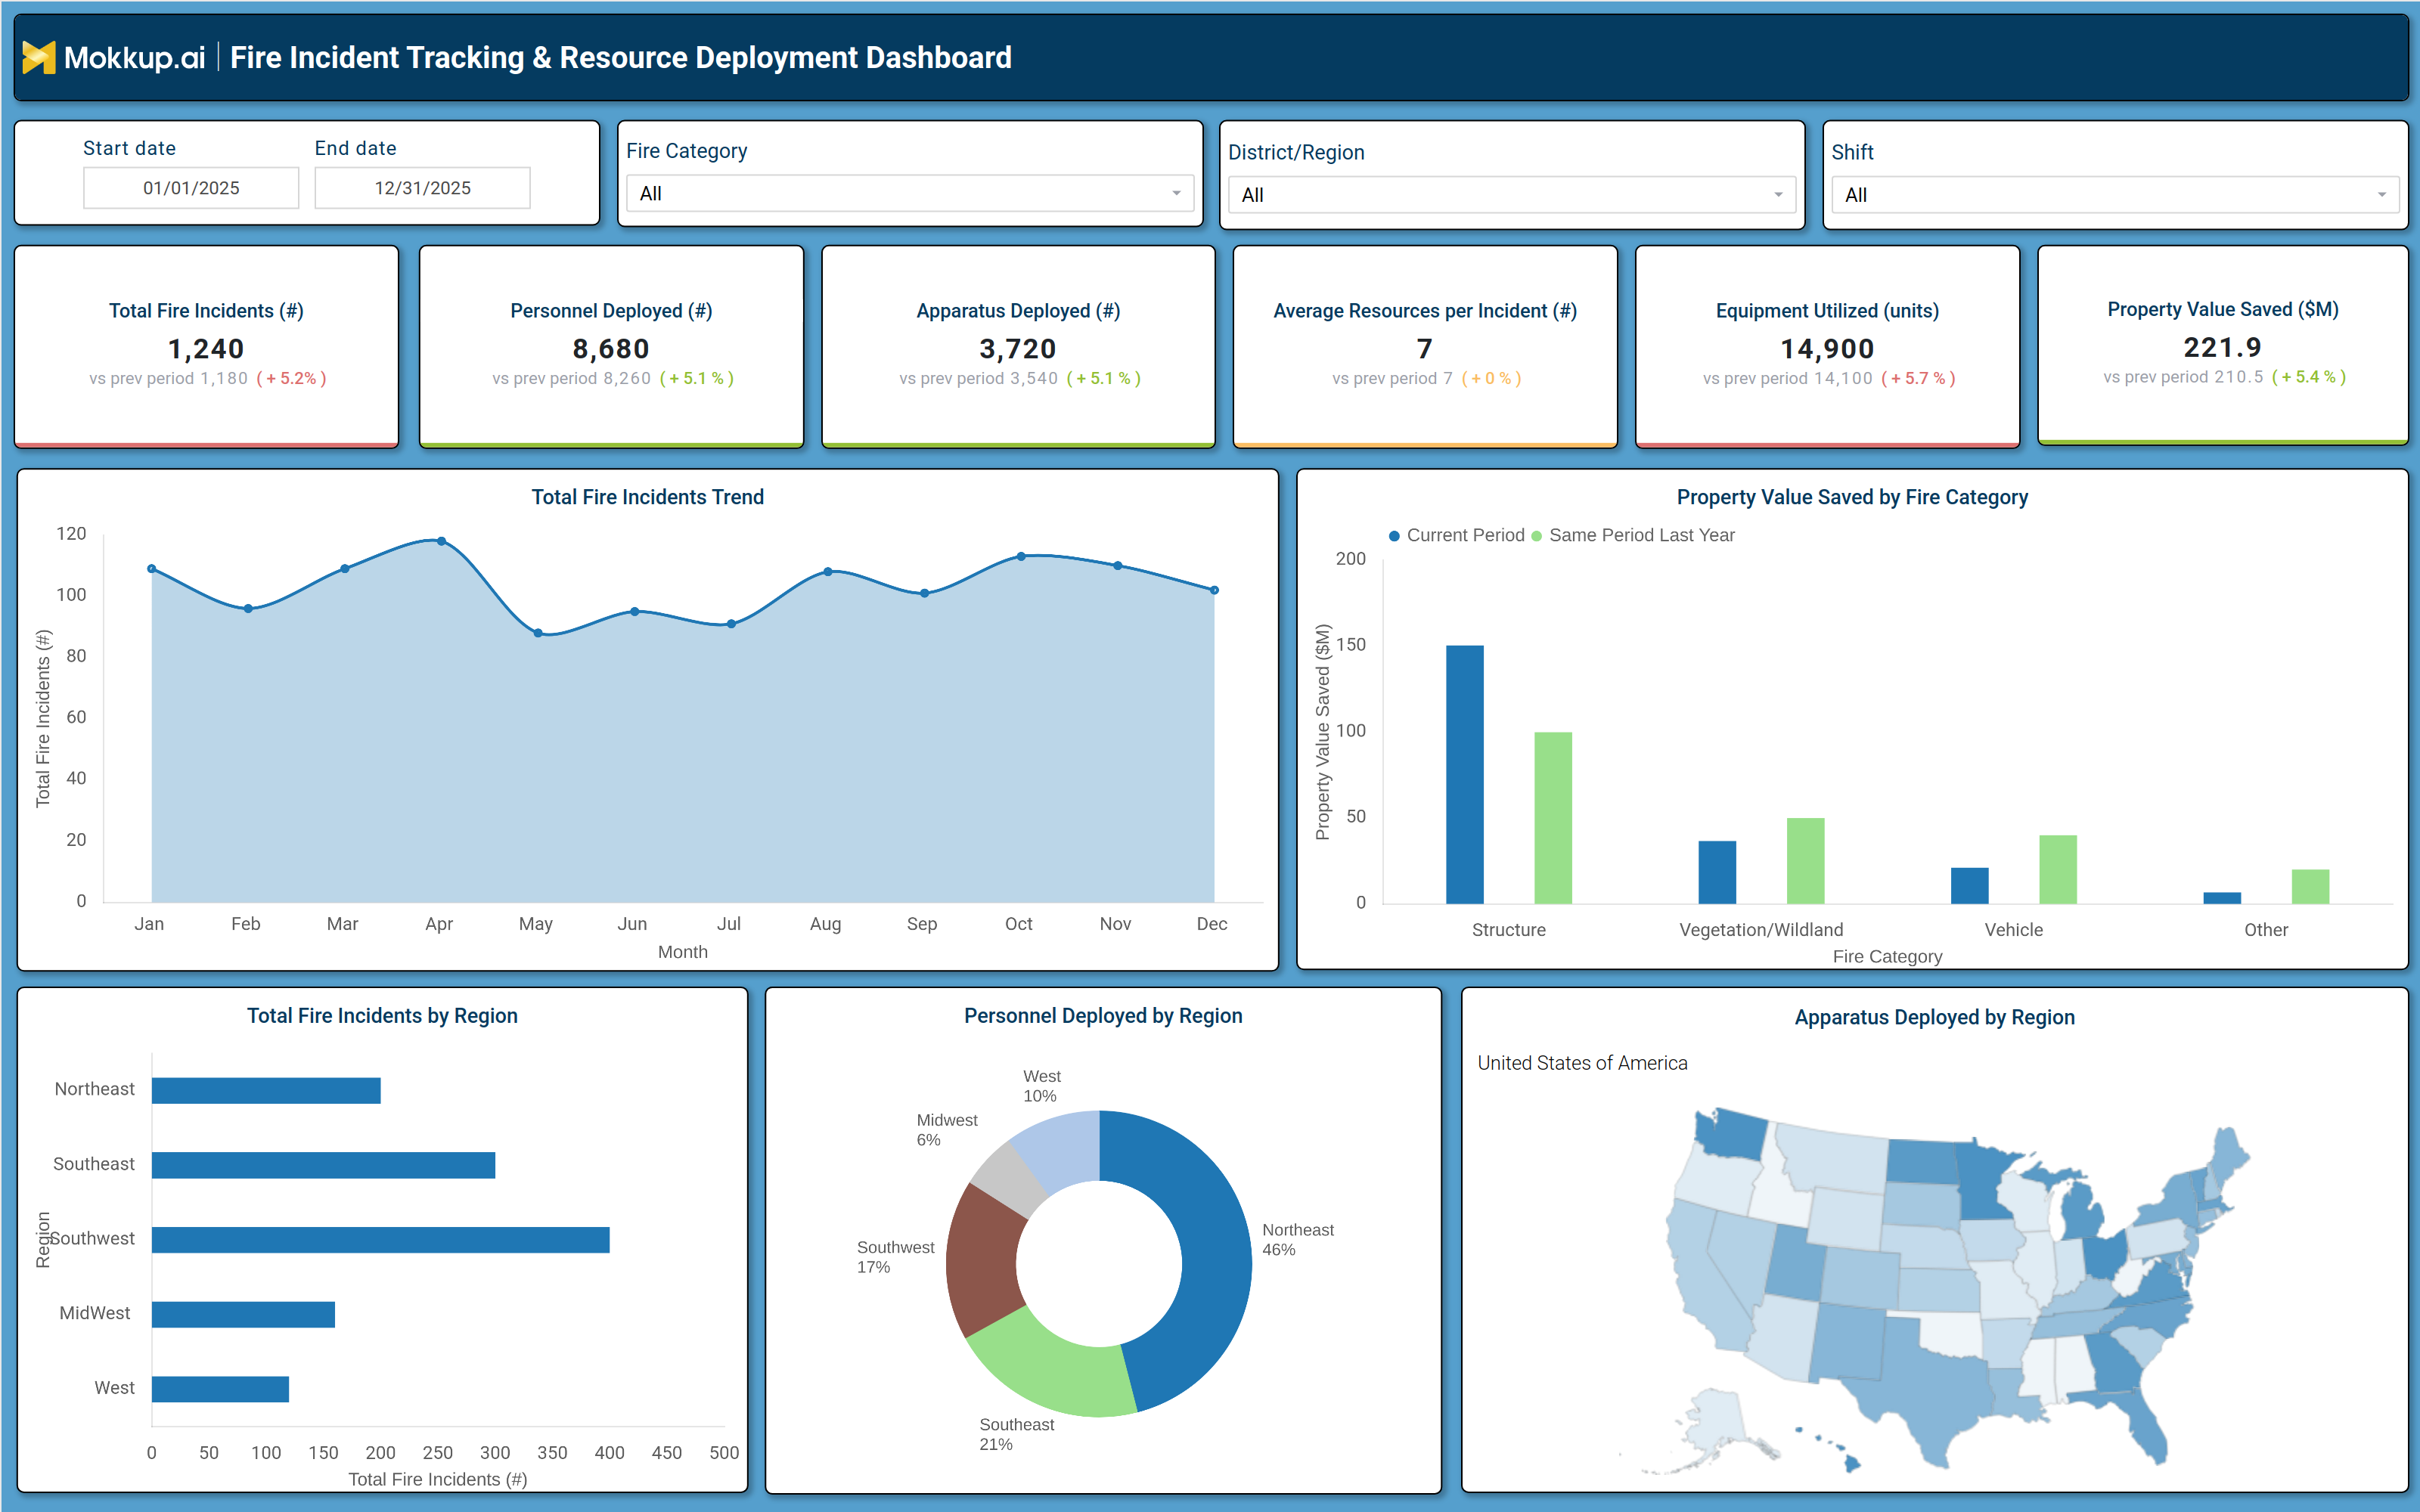
A typical emergency response resource optimization dashboard includes interactive filters for date ranges, fire categories, districts, and shifts. Key performance tiles display metrics such as total fire incidents, personnel deployed, apparatus used, average resources per incident, equipment utilization, and property value saved. Trend charts compare current incident data against historical periods, while regional breakdowns highlight high-risk areas. A geographic heatmap visualizes incident density, and a pie chart segments personnel deployment by region. The public safety emergency deployment dashboard also tracks property value saved by fire category, helping departments assess the financial impact of their response efforts. Together, these components form a resource deployment dashboard for fire departments.
How to Analyze Data in a Fire Incident Tracking & Resource Deployment Dashboard
Here is how you can analyze data from this dashboard:
- Review Total Fire Incidents: Analyze the total number of fire incidents to identify seasonal patterns, regional hotspots, and emerging risk trends.
- Compare Personnel Deployment Across Districts: Evaluate staffing distribution across regions to detect imbalances and ensure adequate emergency response coverage.
- Monitor Apparatus Usage: Track fire apparatus utilization to optimize fleet allocation, improve operational efficiency, and plan maintenance schedules effectively.
- Track Average Resources per Incident: Measure the average personnel and equipment deployed per incident to assess response efficiency and resource adequacy.
- Analyze Equipment Utilization: Monitor equipment usage patterns to prevent shortages, improve readiness, and support proactive inventory management.
- Evaluate Property Value Saved by Fire Category: Assess the financial impact of fire response efforts by analyzing property value protected across different fire categories.
- Use Regional Heatmaps for Resource Allocation: Leverage geographic heatmaps to identify high-incident areas and prioritize resource deployment accordingly.
- Compare Current Data with Historical Trends: Analyze current performance against historical data to identify operational improvements, recurring challenges, or declining trends.
Benefits of a Fire Incident Tracking & Resource Deployment Dashboard
The following are the benefits of using this dashboard:
- Enhances Response Efficiency: Optimizes personnel and apparatus deployment to improve emergency response coordination and operational effectiveness.
- Improves Resource Allocation: Uses data-driven insights from incident trends and patterns to allocate resources more effectively across regions.
- Reduces Response Times: Identifies high-risk zones and staffing gaps to ensure faster emergency response and better coverage.
- Supports Budget Planning: Provides cost-saving insights through metrics such as property value saved and resource utilization efficiency.
- Strengthens Public Safety: Improves incident tracking, monitoring, and reporting to support safer communities and more effective fire response operations.
- Enables Proactive Decision-Making: Leverages historical data analysis to identify trends, anticipate risks, and support strategic planning.
- Streamlines Compliance Reporting: Simplifies reporting processes for municipal fire departments by centralizing operational and incident-related data.
KPIs to Track in a Fire Incident Tracking & Resource Deployment Dashboard
The following key KPIs can be tracked by using this dashboard:
- Total Fire Incidents (count): Measures the number of fire incidents reported within a given period.
- Personnel Deployed (count): Tracks the total number of firefighters and emergency responders dispatched.
- Apparatus Deployed (count): Counts the number of fire trucks, engines, and specialized vehicles used.
- Average Resources per Incident (count): Calculates the average number of personnel and equipment per incident.
- Equipment Utilized (units): Monitors the usage of firefighting tools and apparatus.
- Property Value Saved ($M): Estimates the financial value of property protected from fire damage.
Frequently Asked Questions
1. Who should use a fire incident tracking dashboard?
Fire chiefs, emergency response coordinators, public safety officials, and municipal administrators.
2. What data sources feed into this fire apparatus utilization dashboard?
Fire incident reports, dispatch logs, personnel deployment records, and equipment usage data.
3. How does a property value saved dashboard improve public safety?
It provides data-driven insights to optimize resource allocation, improve response times, and reduce fire damage across communities.