
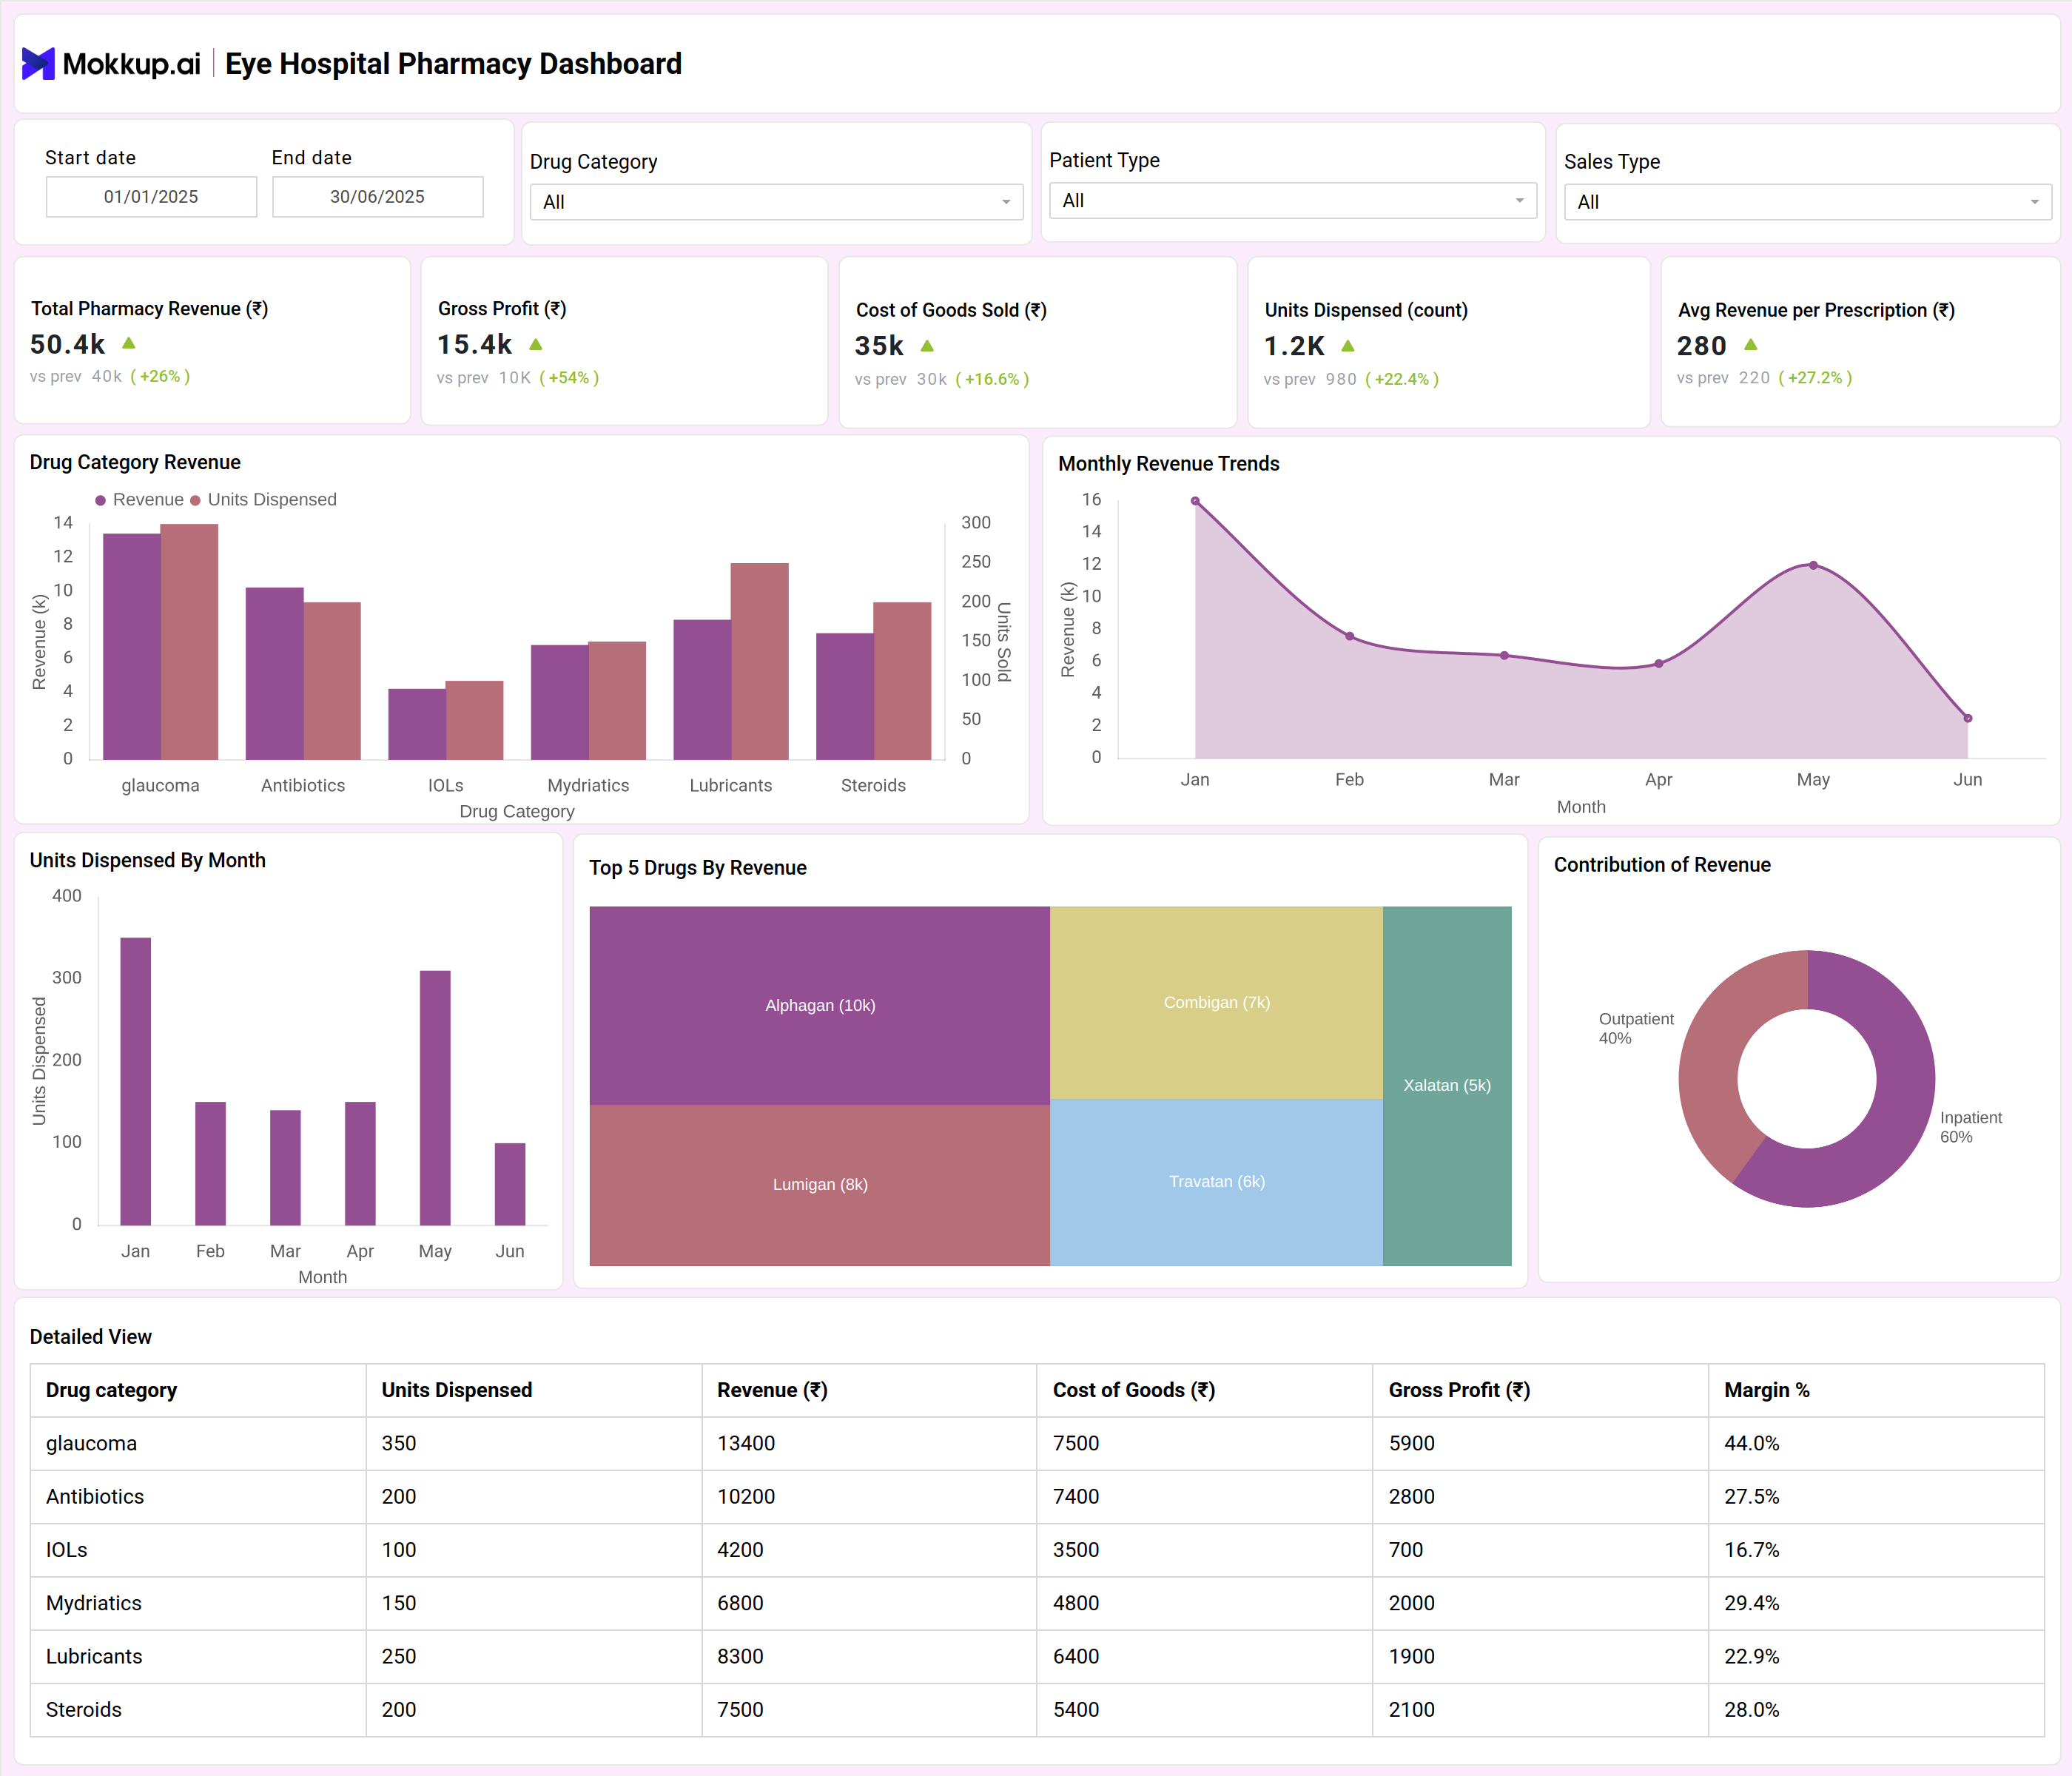
An Eye Hospital Pharmacy Dashboard Template is a digital analytics platform designed to monitor, analyze, and optimize pharmacy operations within an eye hospital or institution. This dashboard centralizes key pharmacy performance metrics such as revenue, profitability, and medication inventory, providing real-time insights for hospital administrators and pharmacy managers.
How to Create an Eye Hospital Pharmacy Dashboard
You don’t need to build your report from scratch—just start with a ready-to-use dashboard template from Mokkup. Add in your data and export it however you like. Here’s how to do it:
1. Create or Log in to Your Mokkup Account
Start by signing up on Mokkup.ai using your email. If you already have an account, just log in, and you’ll be good to go.
2. Choose and Customize Your Dashboard Template
Find the Eye Hospital Pharmacy Dashboard Template in the Templates section. Use the drag-and-drop editor to adjust KPIs, edit filters, or add elements based on your data.
3. Export to Your BI Tool
Once your dashboard wireframe is ready, use the BI Tool Export feature to send it directly to Power BI or Tableau for further analysis and enhancements. You can also download the dashboard as a PDF, PNG, or JPEG, embed it on a platform, or invite your team to collaborate.
Note: This is a Pro template. You’ll need a Pro subscription on Mokkup to use and customize this dashboard wireframe. Upgrade anytime to unlock full access.
Eye Hospital Pharmacy Dashboard Example
A modern Eye Hospital Pharmacy Dashboard typically features data visualizations for total pharmacy revenue, gross profit, cost of goods sold, and average revenue per prescription. These dashboards break down revenue and unit dispensation by drug category—such as antibiotics, steroids, and mydriatics—while showcasing monthly revenue trends and top-performing drugs. Users can track inpatient versus outpatient revenue, analyze cost structures, and assess operating margins at a glance. The example interface enables filtering data by time period, drug category, patient type, and sales type, making it intuitive for pharmacy stakeholders to conduct in-depth analyses of profitability, optimize inventory, and enhance prescription tracking. The focus on profit and revenue helps hospital management quickly identify growth opportunities and address inefficiencies using real-time analytics.
How to Analyze Data in Eye Hospital Pharmacy Dashboards
- Monitor month-on-month trends in total revenue, gross profit, and cost of goods sold to identify seasonal effects or optimization opportunities.
- Evaluate revenue and units dispensed by drug category to understand which therapies drive pharmacy performance and require inventory focus.
- Use visual heatmaps and charts to compare average revenue per prescription and contribution analysis of inpatient vs. outpatient sales.
- Track the top-performing drugs by revenue to optimize purchasing strategies and maximize pharmacy sales outcomes.
- Drill down through dashboard filters (date range, drug category, patient type, sales type) to pinpoint inefficiencies and actionable opportunities in both medication inventory and prescription tracking.
- Review historical data to project demand, minimize stockouts, and reduce overstocking, supporting smarter inventory management.
Benefits of Eye Hospital Pharmacy Dashboards
- Real-time pharmaceutical management dashboard enables quick, data-driven decisions that boost revenue and profitability.
- Enhances visibility of pharmacy performance metrics for both inpatient and outpatient services.
- Streamlines operations by centralizing prescription tracking and medication inventory management.
- Reduces risk of drug shortages or expirations with proactive monitoring of inventory and cost of goods sold.
- Identifies inefficiencies and growth opportunities by comparing gross profit and margins across drug categories.
- Improves compliance and reporting accuracy for regulatory or accreditation requirements.
KPIs to Track in Eye Hospital Pharmacy Dashboards
- Total Pharmacy Revenue: Monitors the gross sales generated from all pharmacy transactions.
- Gross Profit: Reflects profit after subtracting the cost of goods sold from total revenue.
- Cost of Goods Sold (COGS): Tracks direct expenses incurred in obtaining medications.
- Units Dispensed: Measures the total number of medication units provided in a given period.
- Average Revenue per Prescription: Shows profitability on each prescription filled.
- Drug Category Revenue: Highlights revenue performance for each drug class.
Frequently Asked Questions
Q1. What is pharmacy business intelligence in a hospital context?
Pharmacy business intelligence combines digital tools and analytics to transform operational pharmacy data into actionable insights for better decision-making within hospitals or eye care institutions.
Q2. Why is tracking pharmacy performance metrics important?
Ongoing monitoring ensures inventory availability, revenue growth, and regulatory compliance while driving process improvements and cost efficiency.
Q3.What KPIs should an Eye Hospital Pharmacy Dashboard prioritize?
Essential KPIs include total revenue, gross profit, COGS, units dispensed, and profitability by drug category, with added focus on top-selling drugs and revenue source breakdowns.