
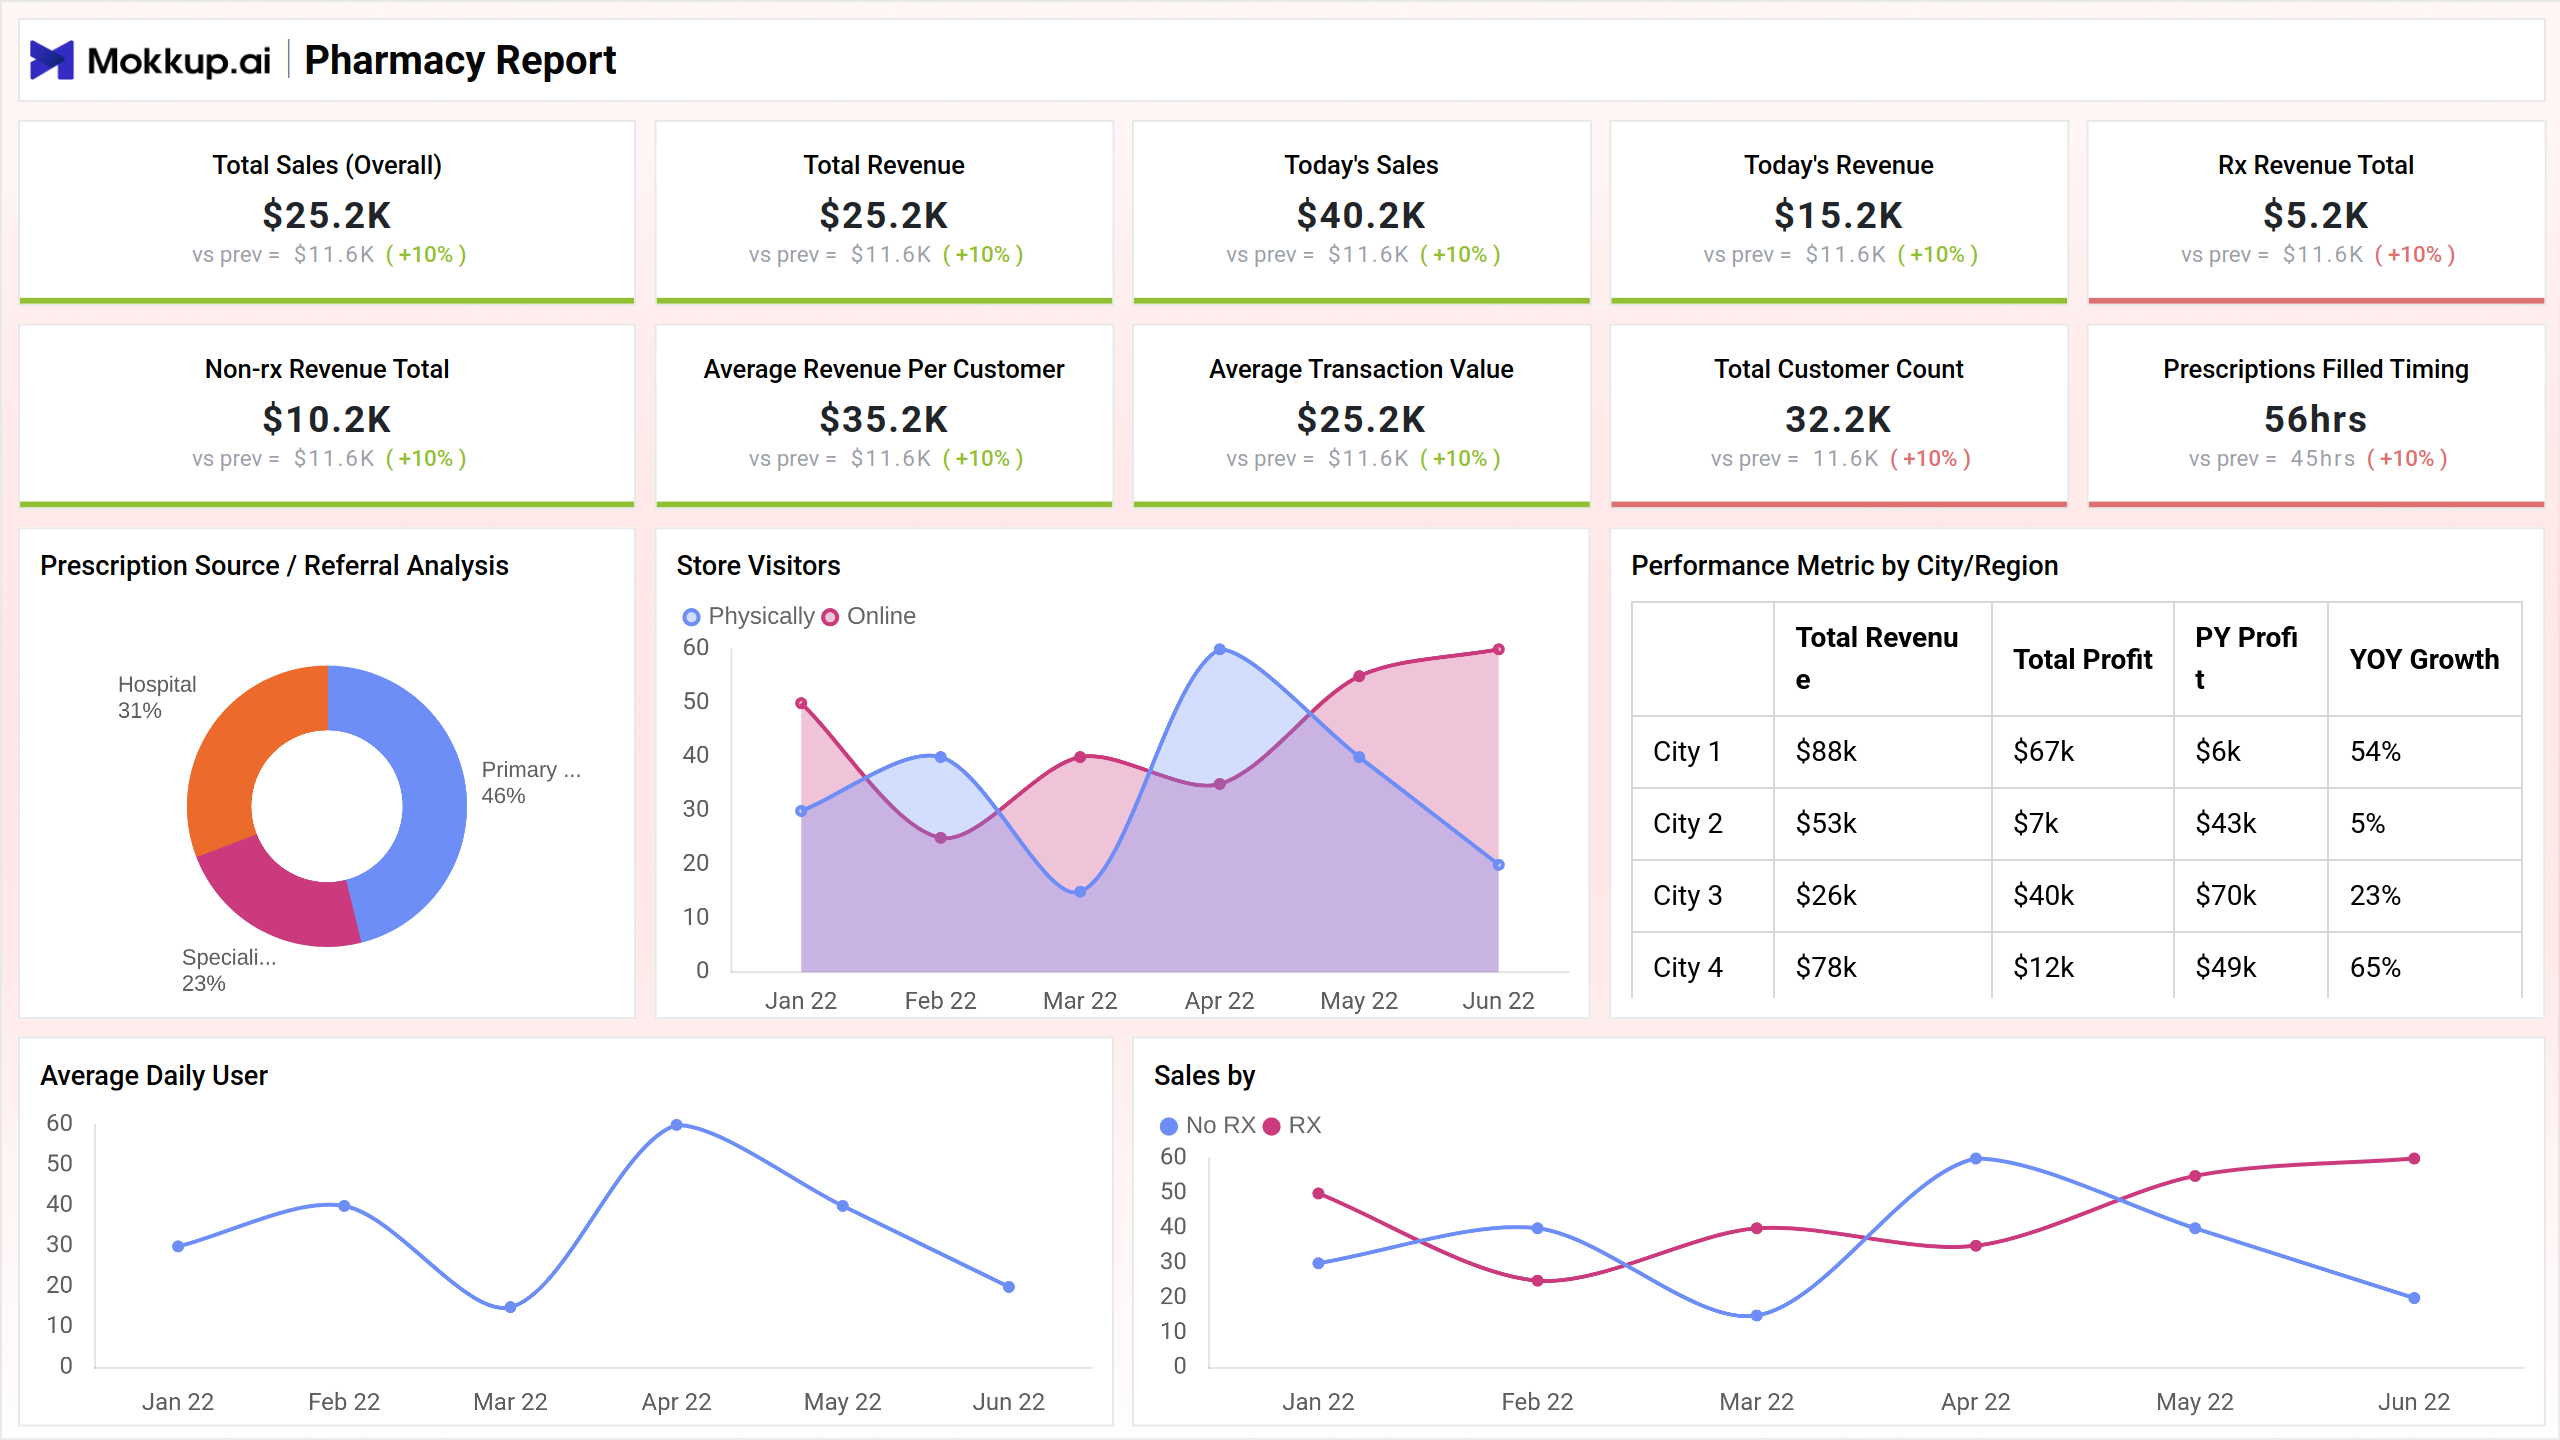
A pharmacy report dashboard is a visual representation of a pharmacy's most important metrics and KPIs (key performance indicators). It provides a quick and easy way to track the pharmacy's performance, such as average revenue, total customer count, store visitors, etc. A well-designed dashboard can help pharmacy managers make informed decisions about how to improve the efficiency and effectiveness of the pharmacy.
Screen 1:
This screen offers a holistic view of essential metrics, including Non-RX and RX revenue, average customer revenue, transaction values, customer count, prescription timing, daily user engagement, store visitors, and previous-year profit. This visual representation empowers pharmacy managers to make informed decisions for enhancing financial performance, customer engagement, and operational efficiency.
Key Terms to Consider:
- Non-RX Revenue Total - The cumulative revenue generated from non-prescription products or services.
- RX Revenue Total - The overall revenue derived from prescription products or services.
- Average Revenue Per Customer - The mean revenue generated from each customer.
- Average Transaction Value - A single transaction's typical value indicates purchasing patterns.
- Total Customer Count - The overall number of customers engaged with the business.
- Prescriptions Filled Timing - The timing and frequency of prescription fulfillment.
- Average Daily User - The mean number of users engaging with the platform daily.
- Store Visitors - The total number of individuals visiting the physical store.
- PY Profit - The profit generated in the previous financial year.
Screen 2: Revenue Insights
It delves into specific revenue-related metrics, including analyzing product/medicine category revenue distribution, monthly revenue comparisons, revenue generated through different channels, performance metrics by city/region, and tracking the total prescription count for deeper insights into customer demand and workload management.
Key Terms to consider:
- Revenue By Product/Medicine Category - Analyzing revenue distribution across different product or medicine categories to identify top-performing areas.
- Monthly Revenue Comparison - Comparing monthly revenue figures to track performance trends and identify notable fluctuations.
- Revenue Generated Through Channel - Assessing revenue generated through various channels to optimize sales strategies and focus on high-performing avenues.
- Performance Metric by City/Region - Evaluating pharmacy performance metrics in different cities or regions to tailor strategies based on geographical variations.
- Total Prescription Count - Keeping track of the number of prescriptions filled, providing insights into customer demand and pharmacy workload.
Screen 3: Prescription
This screen delves into the identification and ranking of frequently prescribed medications for enhanced inventory management, gauges financial impact through the mean value of prescriptions filled, evaluates patient satisfaction to enhance healthcare services, monitors medicine availability to prevent disruptions, optimizes staffing based on hourly patient visits, tailors services to specific regions based on patient distribution, manages workload through tracking prescription fill timelines, and strategically assesses revenue streams for effective sales strategies.
Key Terms to consider:
- Top Prescribed Medications - Identifying and ranking the most frequently prescribed medications to streamline inventory management and enhance patient care.
- Average Prescription Value - Calculate the mean value of prescriptions filled to gauge prescription services' financial impact and efficiency.
- Patient Satisfaction Score - Measuring patient satisfaction to assess healthcare service quality and identify improvement areas.
- Medicine Run Out - Monitoring instances where medicines are out of stock to prevent disruptions in patient treatment and pharmacy operations.
- Patient Visit By Hour - Analyzing the distribution of patient visits throughout the day to optimize staffing and resources for efficient service.
- Geographical Distribution Of Patients - Examining the geographic spread of patients to tailor healthcare services and marketing strategies to specific regions.
- Prescription fill Over Time - Tracking the prescription fill timeline to manage workload and ensure timely service delivery.
- Revenue Generated Through Channel - Assessing revenue streams from different channels to optimize sales strategies and focus on high-performing avenues.
Dashboard Template Insights
The pharmacy report dashboard, spanning three screens, offers a comprehensive overview of key performance metrics crucial for effective pharmacy management. This dashboard provides insights into financial performance, customer engagement, medication dispensing, and inventory management. It empowers managers to make informed decisions, track progress, and identify areas for improvement in pharmacy operations.
Conclusion
The pharmacy report dashboard provides a comprehensive overview of the pharmacy's performance. The dashboard includes metrics on key areas such as medication dispensing, inventory management, and financial performance. Pharmacy managers can use this information to identify areas for improvement, track progress over time, and make informed decisions about the pharmacy's operations.