What is an Eye Hospital Academic & Research Training Dashboard?
An Academic & Research Training Dashboard is a real-time, interactive tool designed for eye hospitals and academic medical institutions to monitor and visualize metrics connected to residency surgical training and development, academic engagement, and research output. It consolidates complex datasets on surgical volume, completion rates, teaching sessions, certifications, and research publications, making information readily accessible for administrators, educators, and clinical leaders.
How to Create an Eye Hospital Academic & Research Training Dashboard
You don’t need to build your report from scratch—just start with a ready-to-use Eye hospital academic & research training dashboard template from Mokkup. Add in your data and export it however you like. Here’s how to do it:
1. Create or Log in to Your Mokkup Account
Start by signing up on Mokkup.ai using your email. If you already have an account, just log in, and you’ll be good to go.
2. Choose and Customize Your Dashboard Template
Find the Eye Hospital Academic & Research Training Dashboard template in the Templates section. Use the drag-and-drop editor to adjust KPIs, edit filters, or add elements based on your data.
3. Export to Your BI Tool
Once your dashboard wireframe is ready, use the BI Tool Export feature to send it directly to Power BI or Tableau for further analysis and enhancements. You can also download the dashboard as a PDF, PNG, or JPEG, embed it on a platform, or invite your team to collaborate.
Note: This is a Pro template. You’ll need a Pro subscription on Mokkup to use and customize this dashboard wireframe. Upgrade anytime to unlock full access.
Eye Hospital Academic & Research Training Dashboard Example
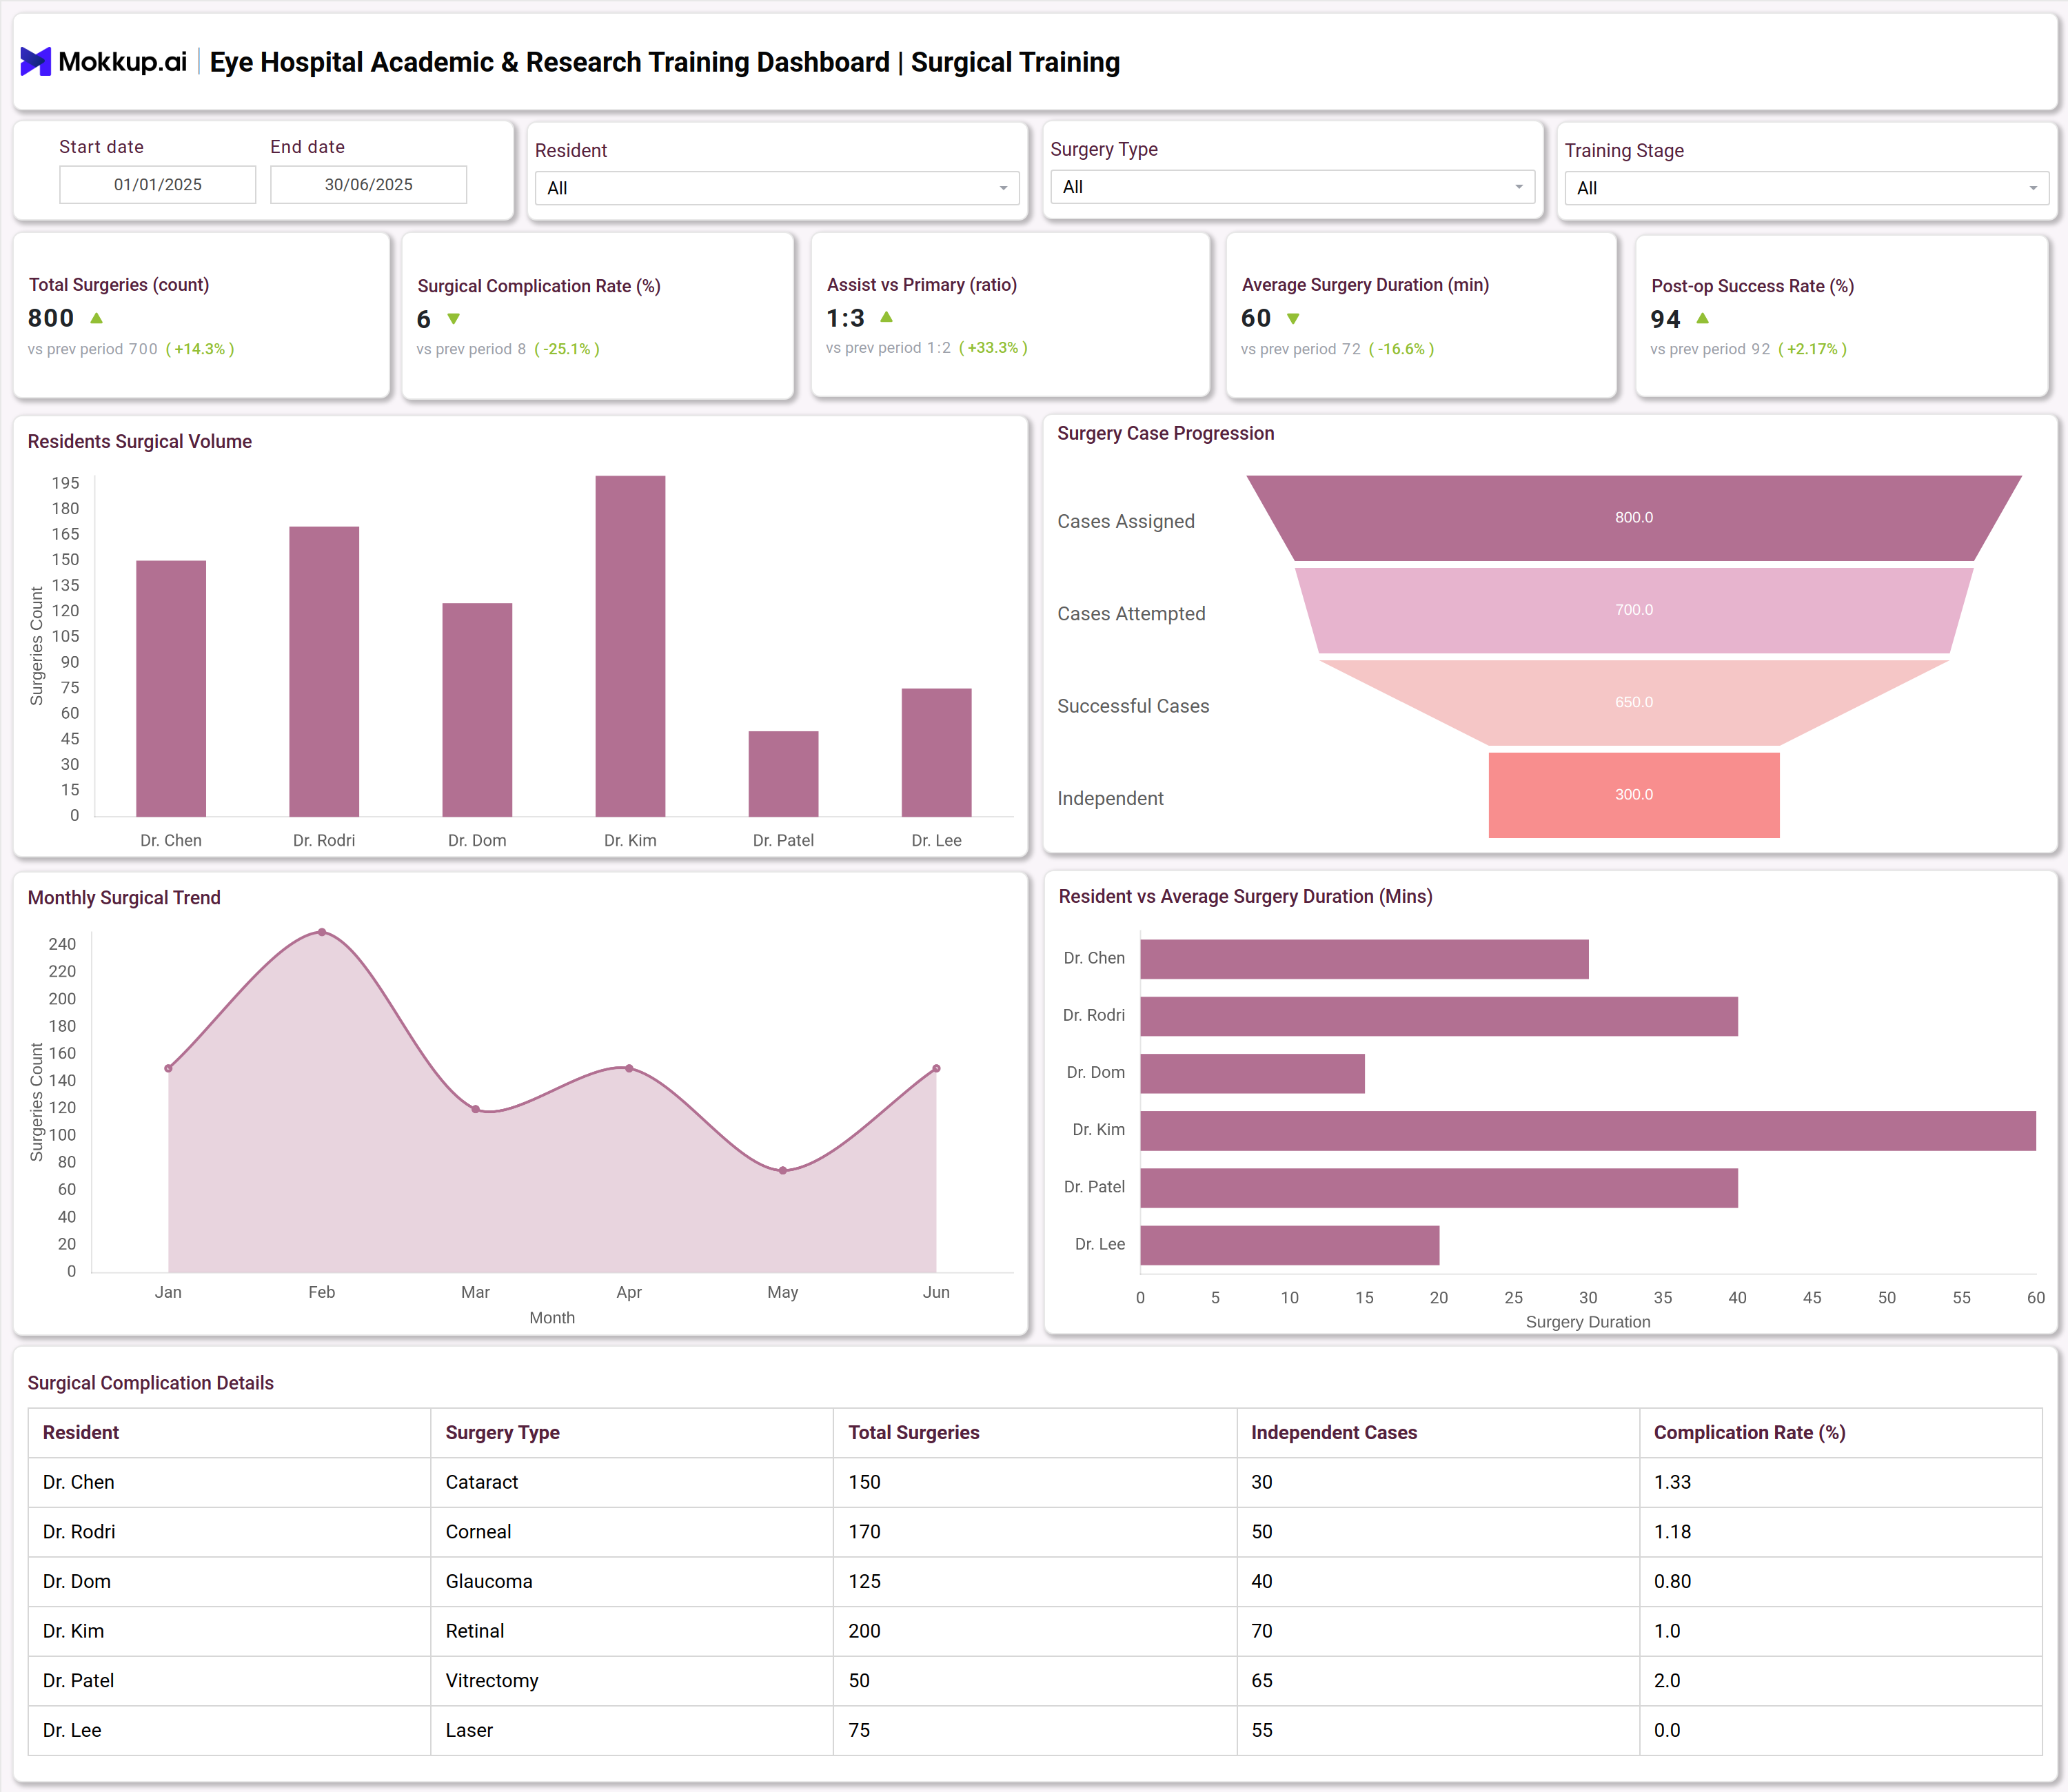
Most leading eye hospitals use dashboards to bridge clinical practice, research, and training. A typical Academic & Research Training Dashboard template functions as a training management dashboard, consolidating information such as total surgeries performed by resident doctors, surgical completion rates, assist-to-primary ratios, complication rates, and post-op success rates.
Additional panels track academic engagement: the number of wet lab sessions, CME attendance, research publications by subspecialty, conference presentations, and teaching hours. With built-in research data visualization, elements like funnel charts, bar graphs, and timelines allow for quick comparisons between residents and easy tracking of trends in surgical and academic performance. With detailed breakdowns by resident name, surgery type, and teaching metrics, the dashboard gives a comprehensive, actionable picture of staff performance and learning outcomes.
How to Analyze Data in Eye Hospital Academic & Research Training Dashboards
Use the dashboard like an employee training dashboard to evaluate both clinical performance and academic growth. Focus on these steps:
- Review key training analytics such as overall surgical volume, resident-specific metrics, and surgical completion rates.
- Analyze data visualization charts to identify trends in academic, clinical, and research activity across the institution.
- Benchmark KPIs monthly, quarterly, or half-yearly to compare program performance and spot areas needing intervention.
- Use filters by resident, subspecialty, or procedure to extract granular insights.
- Track certifications completed and CME attendance to assess professional development.
- Monitor research output by publication count, subspecialty contributions, and conference presentations.
- Evaluate complication rates and post-operative success to measure patient safety and clinical quality.
Benefits of Eye Hospital Academic & Research Training Dashboards
An Eye hospital academic & research training dashboard offers multiple advantages for hospitals and medical institutions:
- Centralized Oversight: Combine training management and research data in one place to improve operational efficiency.
- Clear Performance Visibility: Visualize employee training metrics and research outcomes for stakeholders with ease.
- Data-Driven Decisions: Support outcome-based program reviews with real-time insights.
- Continuous Improvement: Give staff and leadership analytics that promote transparency and growth.
- Early Gap Detection: Identify performance issues or emerging strengths among residents and faculty quickly.
- Simplified Reporting: Automate compliance, accreditation, and quality reporting tasks.
- Better Resource Allocation: Highlight trends in training effectiveness and academic engagement for smarter planning.
Overall, this dashboard streamlines academic performance tracking and helps hospitals enhance training outcomes, research productivity, and decision-making.
KPIs to Track in Eye Hospital Academic & Research Training Dashboards
- Surgical Completion Rate (%): The percentage of surgeries successfully completed by residents out of those assigned.
- Total Surgeries (Count): The total number of surgeries performed during the specified period.
- Assist vs Primary (Ratio): The ratio of surgeries where residents assisted versus being the primary surgeon.
- Average Surgery Duration (Minutes): The average time taken to complete surgeries.
- Post-op Success Rate (%): The percentage of surgeries resulting in successful postoperative outcomes.
- Complication Rate (%): The percentage of surgeries that had complications.
Frequently Asked Questions
1. What are the main functions of an Academic & Research Training Dashboard in an eye hospital?
It combines research and training metrics for oversight of clinical teaching, research output, and resident performance, streamlining reporting and supporting targeted program management.
2. How does this dashboard improve training outcomes?
Visualizing surgical, academic, and research data makes gaps and opportunities visible for educators and residents, enabling timely intervention and data-driven improvements.
3. Who benefits most from using these dashboards?
Administrators, educators, program directors, and residents benefit from centralized, actionable data for clinical training, teaching, and research progress assessment.