What is a Training and Development Dashboard?
A Training and Development Dashboard is an interactive HR analytics tool that helps organizations monitor employee learning, skill development, and training ROI. It visualizes key metrics such as training costs, completion rates, and workforce progress, enabling HR teams to make data-driven decisions.
This dashboard consolidates information from multiple HR systems to present a real-time overview of employee training performance across departments and locations. Unlike static reports, a Learning and Development Dashboard provides a dynamic view, making it easier to track participation, training hours, and cost efficiency while ensuring that learning programs align with organizational goals.
How to Create a Training and Development Dashboard
You don’t need to build your report from scratch—just start with a ready-to-use dashboard template from Mokkup. Add in your data and export it however you like. Here’s how to do it:
1. Create or Log in to Your Mokkup Account
Start by signing up on Mokkup.ai using your email. If you already have an account, just log in, and you’ll be good to go.
2. Choose and Customize Your Dashboard Template
Find the Training and Development Dashboard template in the Templates section. Use the drag-and-drop editor to adjust KPIs, edit filters, or add elements based on your data.
3. Export to Your BI Tool
Once your dashboard wireframe is ready, use the BI Tool Export feature to send it directly to Power BI or Tableau for further analysis and enhancements. You can also download the dashboard as a PDF, PNG, or JPEG, embed it on a platform, or invite your team to collaborate.
Note: This is a Pro template. You’ll need a Pro subscription on Mokkup to use and customize this dashboard wireframe. Upgrade anytime to unlock full access.
Training and Development Dashboard Example
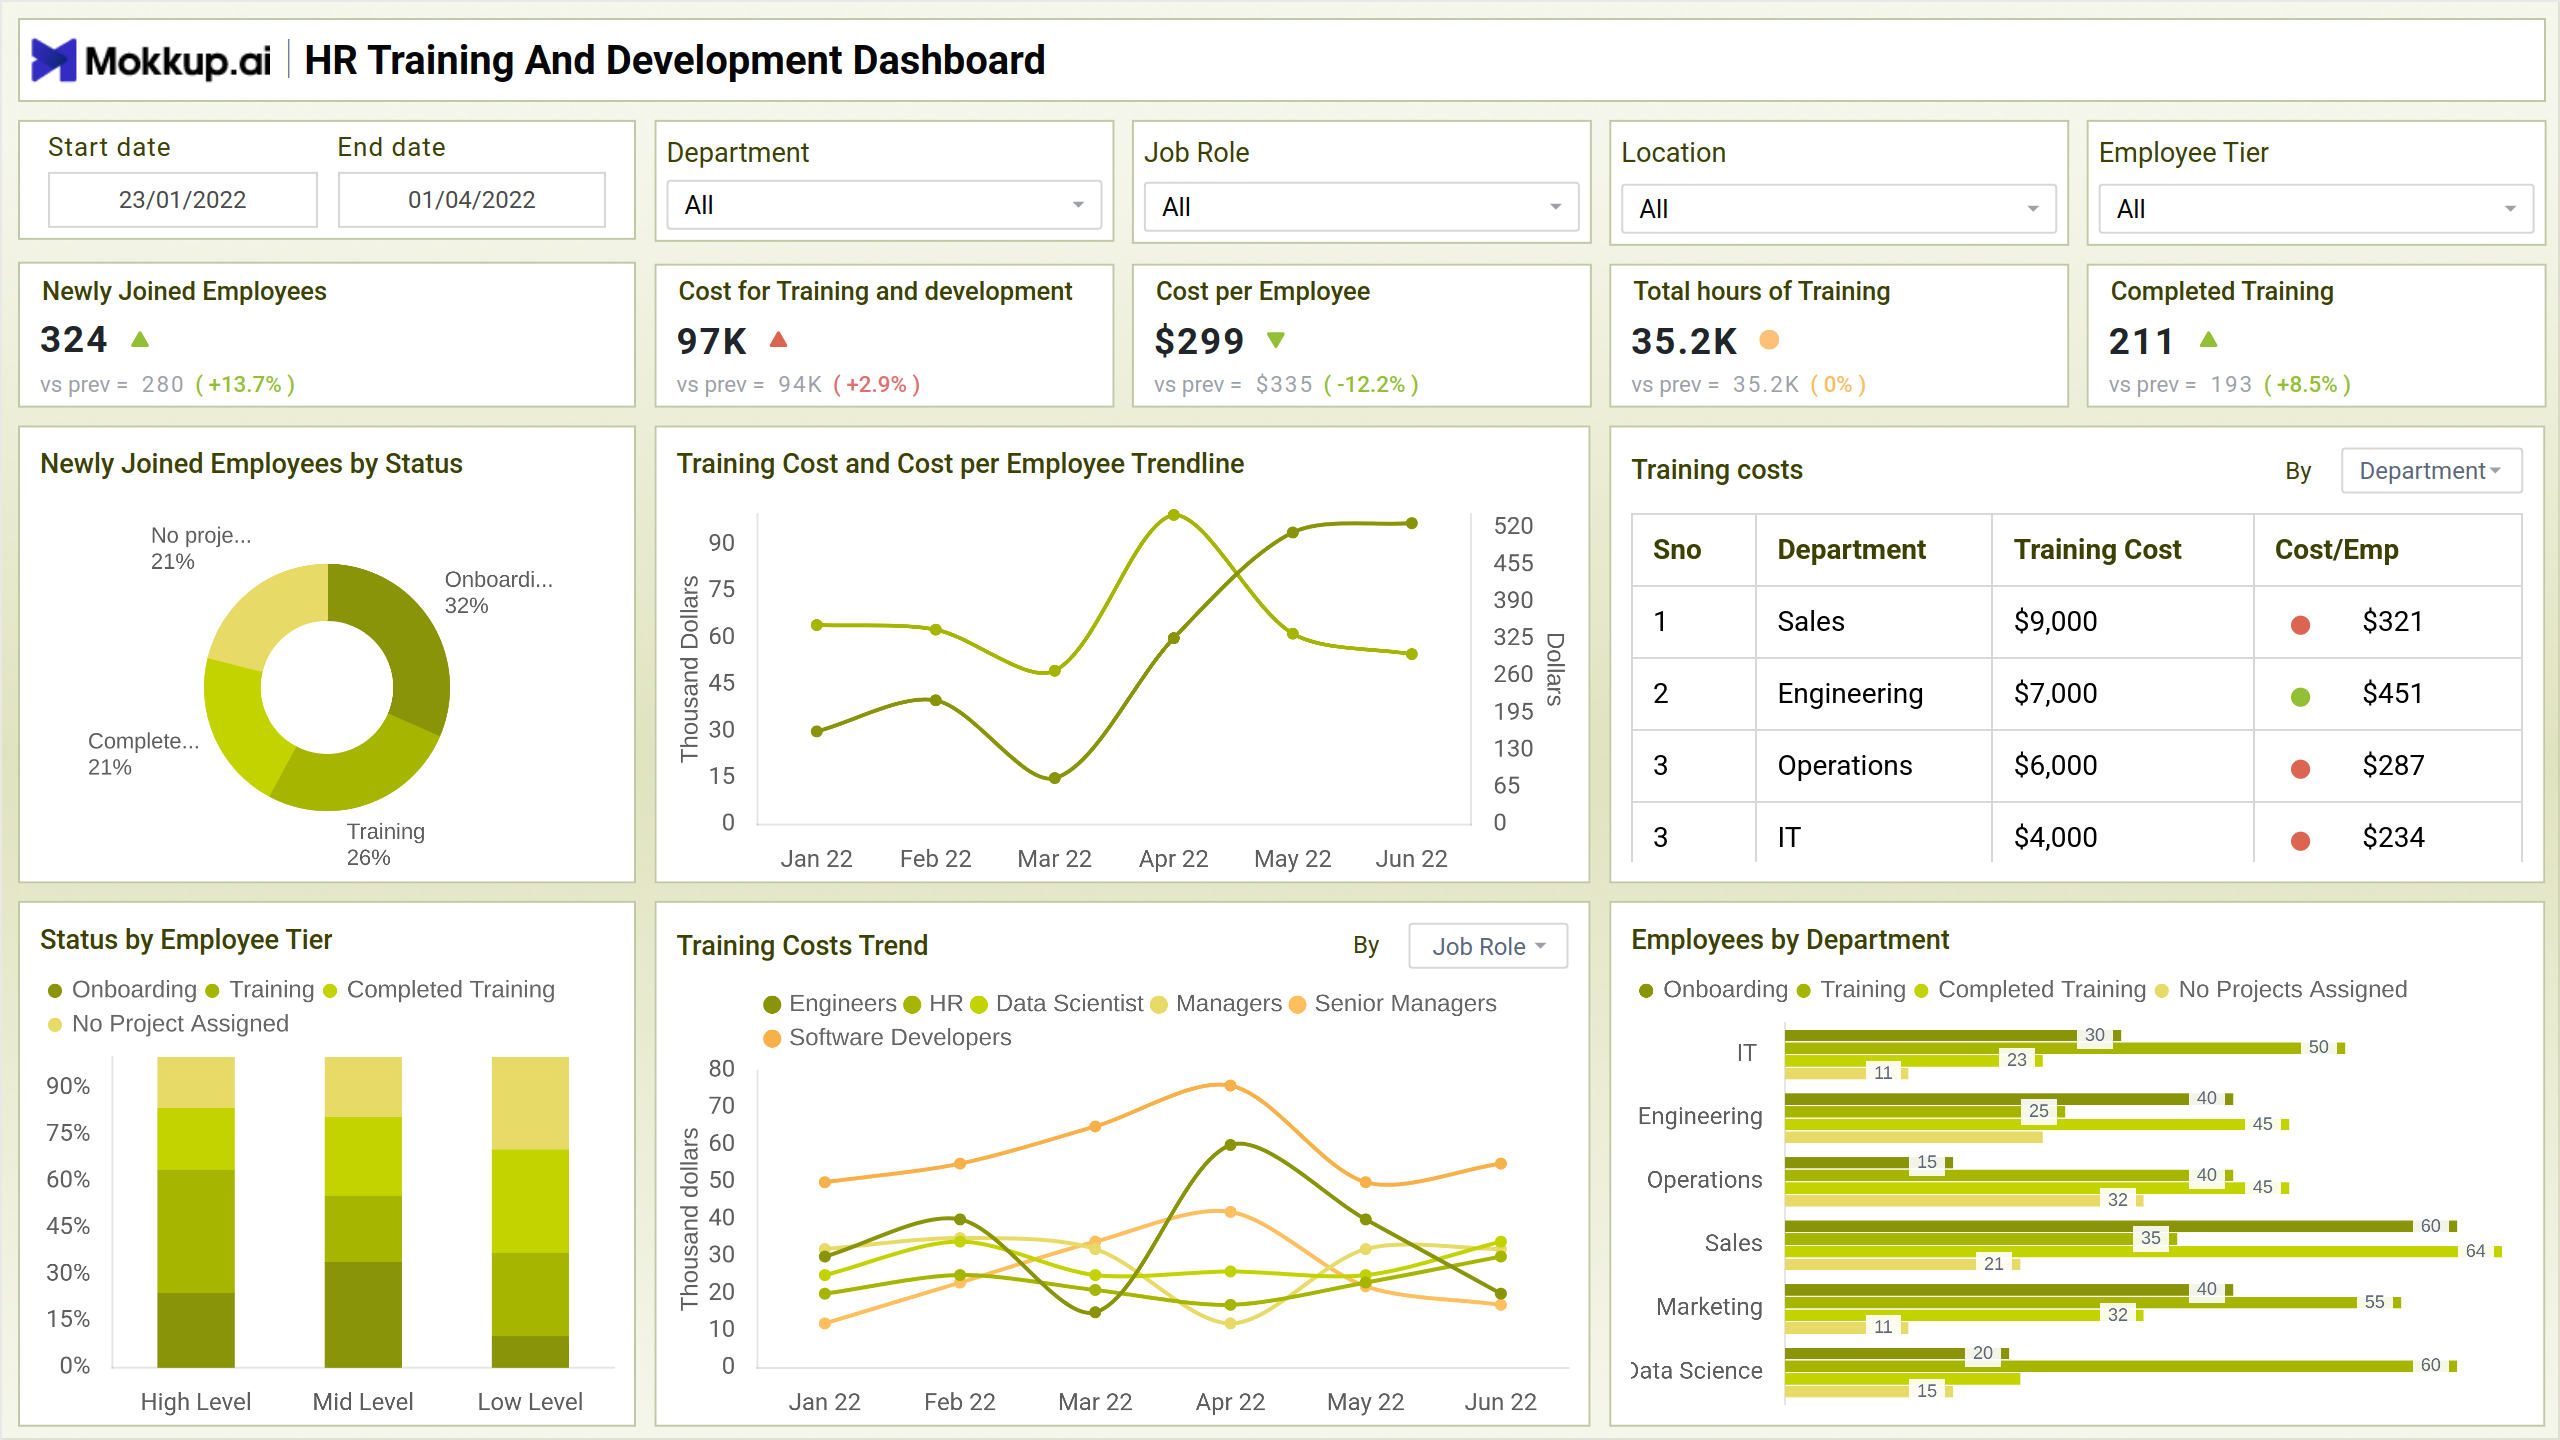
The Training and Development Dashboard by Mokkup.ai provides a unified view of workforce learning performance and financial investment across departments. It showcases key metrics such as Newly Joined Employees, Cost for Training and Development, Cost per Employee, and Completed Training—all presented through intuitive visual components. The dashboard utilizes pie charts, bar charts, and trendlines to represent complex HR data visually. For instance, the Training Cost and Cost per Employee Trendline helps HR leaders understand how expenses fluctuate over time, while the Employees by Department bar chart highlights participation and completion rates across different teams.
Each visualization is designed to make training insights actionable. The pie chart displaying Newly Joined Employees by Status (Onboarding, Training, Completed) quickly indicates learning progress. In contrast, the table view for Training Costs by Department reveals which teams have higher spending or work efficiency levels. Combined with KPIs such as total hours trained and ROI trends, this Learning and Development Dashboard enables HR professionals to monitor training effectiveness, optimize budgets, and make data-driven decisions for sustainable workforce growth.
How to Analyze Data in Training and Development Dashboards
When analyzing your Employee Training Dashboard, focus on trends that highlight learning efficiency and workforce engagement. Here’s how to interpret the data effectively:
- Review KPIs regularly – Track metrics like cost per employee, completed training, and total hours to assess progress.
- Compare trends across time – Use the line charts to see how training investment and performance evolve month by month.
- Segment by department or role – Identify which teams are receiving more training funds and how that impacts outcomes.
- Track onboarding and completion ratios – The pie chart and bar charts help gauge learning progress across new hires.
- Evaluate ROI – Link training investments with productivity improvements or retention rates using Training ROI analytics.
Benefits of Training and Development Dashboards
This learning progress dashboard has the following benefits:
- Centralized Learning Insights: Consolidate all training-related metrics into a single platform.
- Improved Decision-Making: Identify which learning programs deliver the highest ROI.
- Enhanced Employee Experience: Track skill development progress through visual reports.
- Resource Optimization: Allocate training funds more effectively by analyzing departmental costs.
- Compliance Monitoring: Ensure that required training is completed within deadlines.
- Customizable Reports: Tailor dashboard visuals based on job roles, departments, and employee tiers.
KPIs to Track in Training and Development Dashboards
Tracking the right KPIs ensures you capture meaningful workforce development insights. Some key performance indicators include:
- Newly Joined Employees by Status: Understand the onboarding, training, and completion stages of new hires.
- Cost for Training and Development: Track total budget spent on employee learning.
- Cost per Employee: Identify per-person training expenditure to manage budgets efficiently.
- Status by Employee Tier: This metric tracks the training status of employees by employee tier, including managers, executives, and hourly workers.
- Funds Used for Training/Development: Monitor how allocated funds are distributed and utilized.
- Training Cost per Employee by Location: Compare learning costs across different branches or regions.
- Completed Training Percentage: Measure workforce participation and program completion rates.
- Total Hours Committed for Training/Development: Summarize the collective hours dedicated to training and development activities.
Frequently Asked Questions
1. How does this dashboard improve workforce performance?
By providing insights into completion rates, training costs, and skill gaps, it enables better resource allocation and targeted training programs.
2. How often should HR teams review dashboard data?
Ideally, teams should review the data monthly to track performance trends and adjust training budgets accordingly.
3. Why use Mokkup.ai for building HR dashboards?
Mokkup.ai simplifies dashboard creation with pre-built templates, drag-and-drop visualization tools, and customization options—saving time and improving design efficiency.