What is an Eye Hospital Operations Dashboard?
An Eye Hospital Operations Dashboard template is a specialized data visualization tool designed for ophthalmology hospital administrators and clinical operations teams. This dashboard wireframe centralizes hospital performance metrics, patient flow analytics, resource utilization, and healthcare operational efficiency into an interactive interface. Teams use the dashboard to monitor real-time clinical operations, track key performance indicators (KPIs), manage surgical procedures, admissions, and recovery rates, and identify trends affecting patient care delivery.
How to Create an Eye Hospital Operations Dashboard
You don’t need to build your report from scratch—just start with a ready-to-use Eye Hospital Operations dashboard template from Mokkup. Add in your data and export it however you like. Here’s how to do it:
1. Create or Log in to Your Mokkup Account
Start by signing up on Mokkup.ai using your email. If you already have an account, just log in, and you’ll be good to go.
2. Choose and Customize Your Dashboard Template
Find the Eye Hospital Operations Dashboard template in the Templates section. Use the drag-and-drop editor to adjust KPIs, edit filters, or add elements based on your data.
3. Export to Your BI Tool
Once your dashboard wireframe is ready, use the BI Tool Export feature to send it directly to Power BI or Tableau for further analysis and enhancements. You can also download the dashboard as a PDF, PNG, or JPEG, embed it on a platform, or invite your team to collaborate.
Note: This is a Pro template. You’ll need a Pro subscription on Mokkup to use and customize this dashboard wireframe. Upgrade anytime to unlock full access.
Eye Hospital Operations Dashboard Example
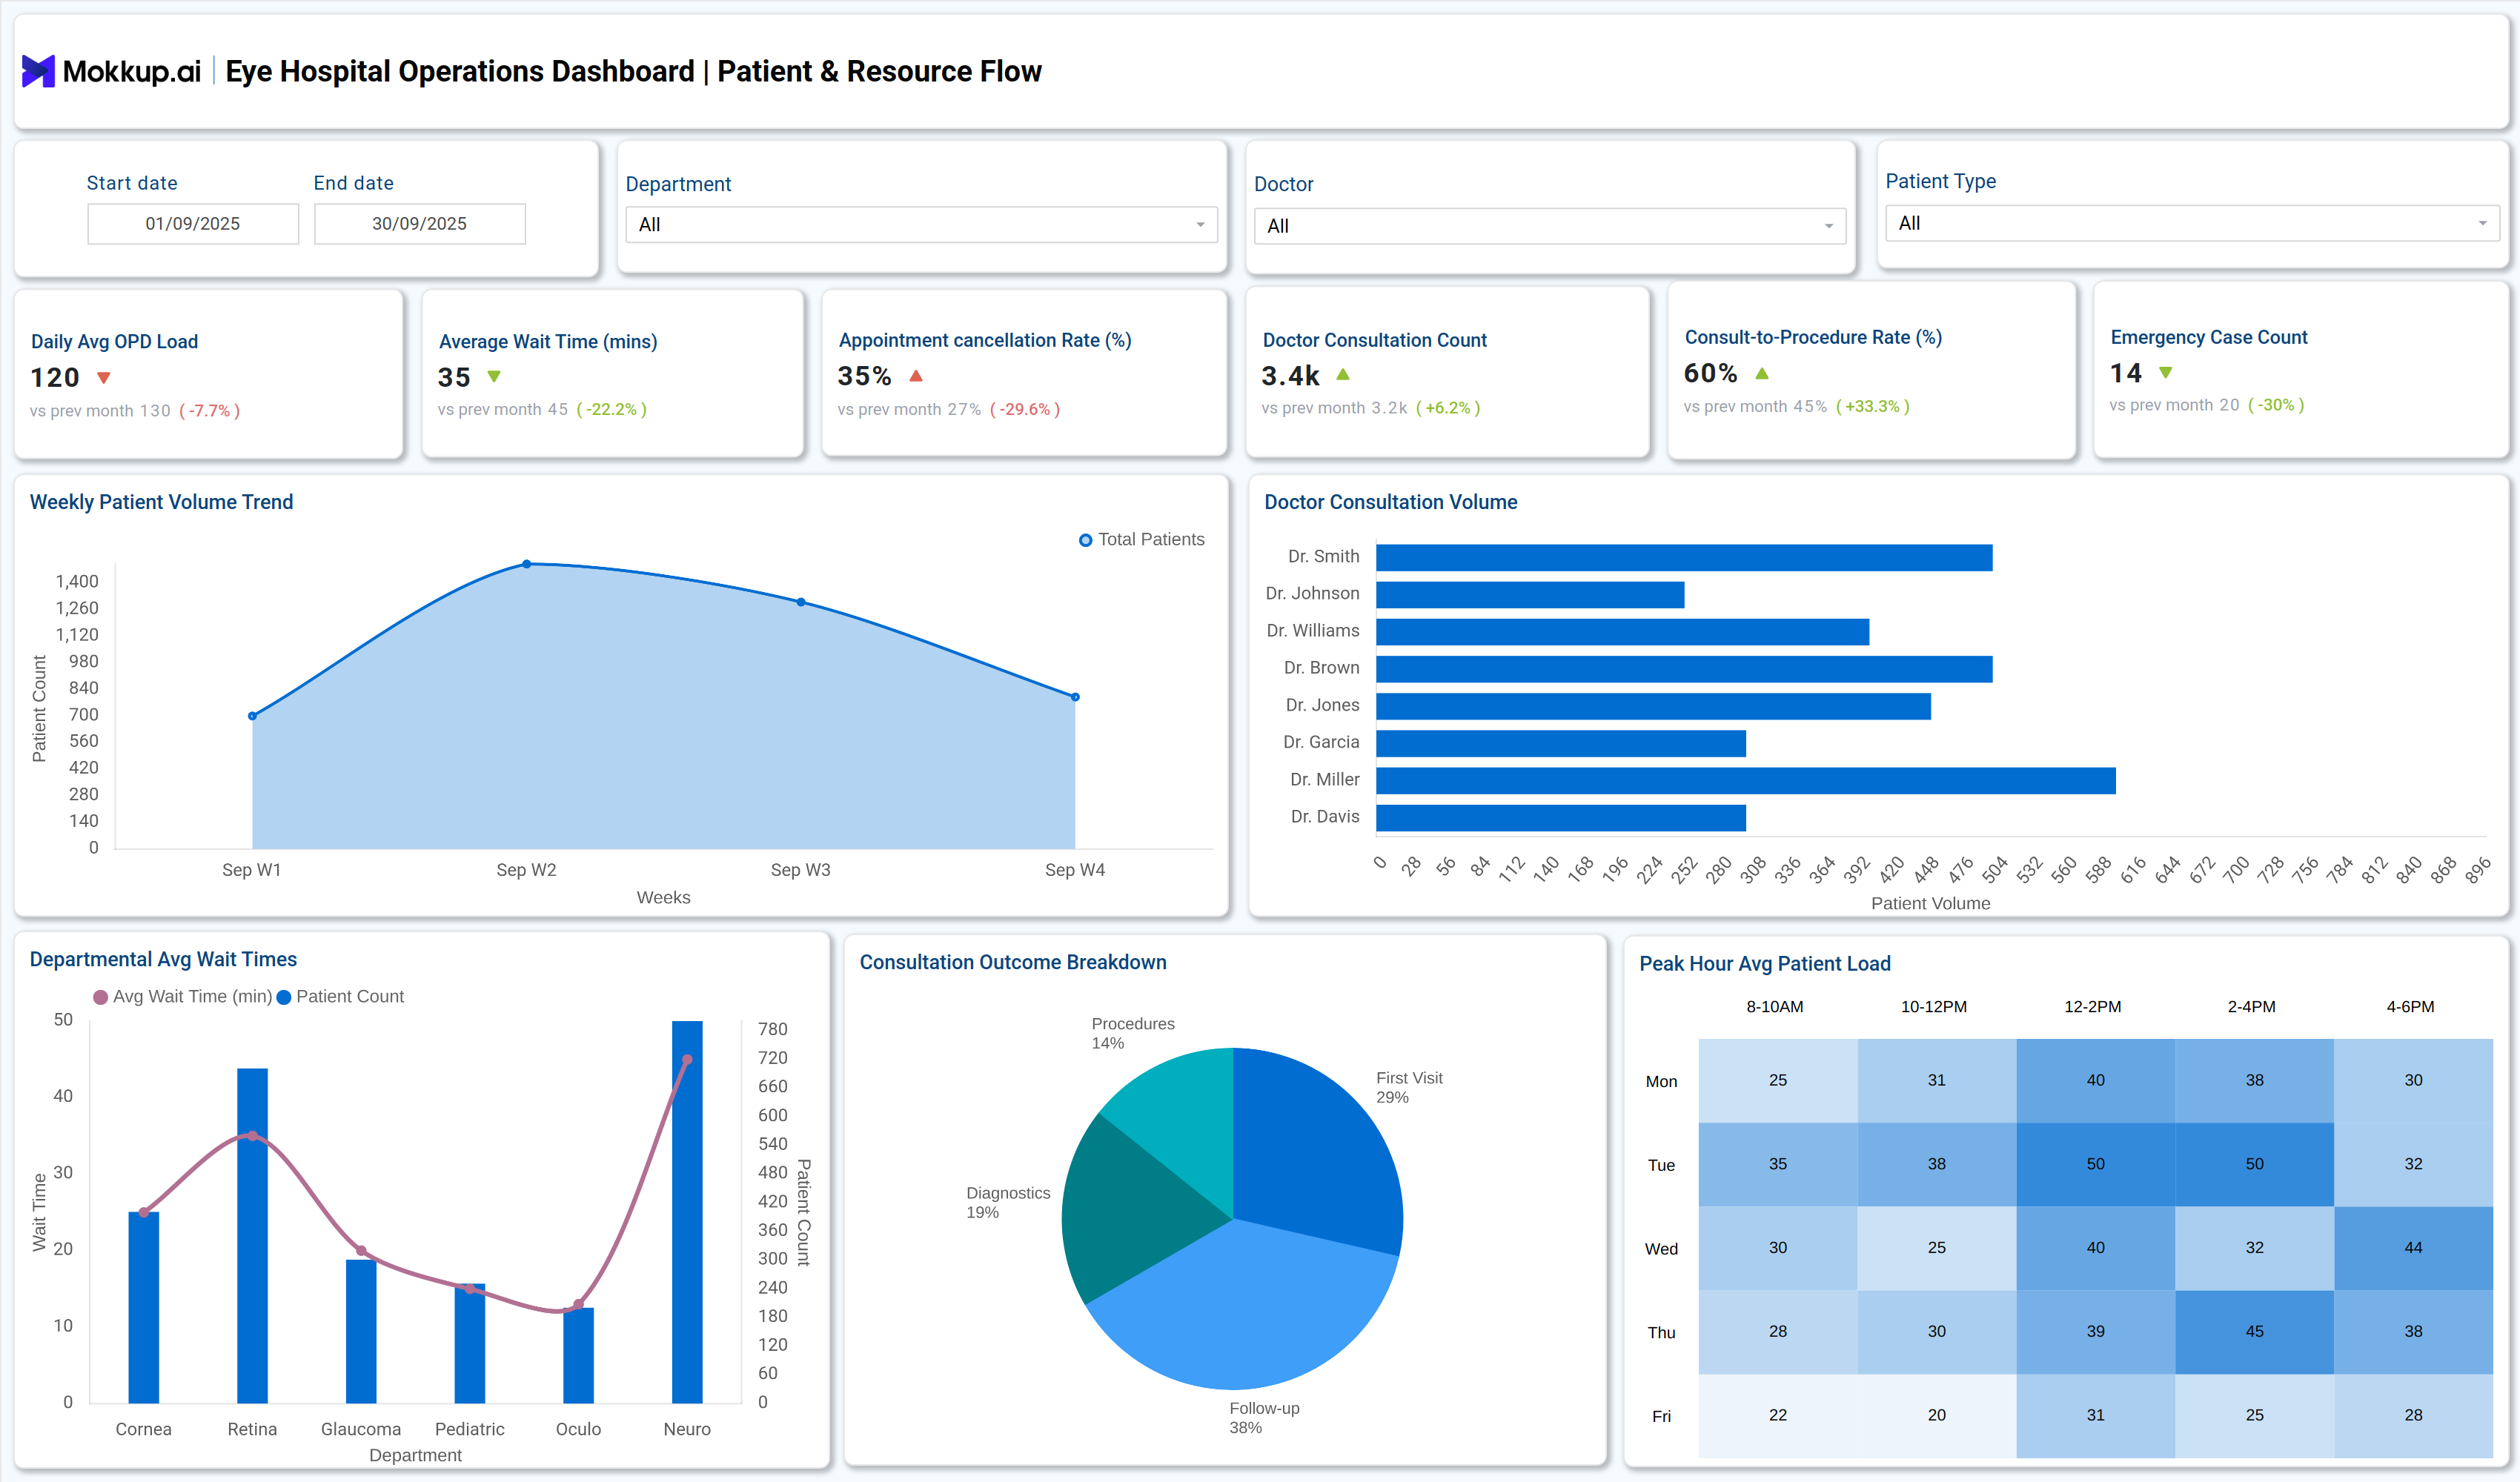
A modern Eye Hospital Operations Dashboard visualizes comprehensive data, including total admissions, surgical procedure counts, OT (Operating Theatre) utilization rates, complication rates, and average recovery times.
For example, a typical dashboard might display real-time data on patient admissions trends, breakdowns of surgical volume by procedure type (such as cataract, retina, glaucoma, and LASIK), complication rates specific to surgery types, and department-level recovery distribution.
Interactive visualizations help teams quickly spot spikes in patient volume, track progress on key operational KPIs, and instantly identify areas requiring intervention. Decision-makers can use these visual data insights to manage daily operations, respond rapidly to emerging clinical challenges, and plan resource allocation based on up-to-date hospital KPI dashboard metrics.
How to Analyze Data in Eye Hospital Operations Dashboards
Before diving into advanced analytics, it’s important to understand the key metrics influencing patient flow, hospital capacity, and surgical outcomes. Analyzing these dashboards allows administrators to connect the dots between clinical efficiency and patient care quality.
- Start by tracking total admissions and surgical procedure counts to gauge patient intake volume and departmental activity.
- Monitor OT utilization (%) to assess operating room efficiency and identify bottlenecks in clinical workflows.
- Analyze complication rate (%) and emergency procedure rate (%) to evaluate surgical safety and identify risk trends.
- Use the admissions trend and surgical volume by type visuals to understand weekly fluctuations and plan resource allocation.
- Review average recovery times and patient distribution histograms for effective discharge planning and aftercare resource management.
- Drill down into procedure-specific complication analytics (e.g., cataract vs. retina surgeries) to target quality improvement initiatives.
- Leverage surgical flow visuals to map the patient journey from admission to recovery, supporting process optimization.
- Integrate operational data with hospital resource management dashboards for a comprehensive view of staff, OT, and bed utilization.
Benefits of Eye Hospital Operations Dashboards
When properly designed, these dashboards transform complex hospital operations into clear, actionable insights. They not only support day-to-day decision-making but also contribute to long-term efficiency and patient care improvements.
- Enables real-time monitoring of hospital performance and clinical operations.
- Improves patient flow and bed management through visual tracking of admissions, surgeries, and recoveries.
- Supports data-driven resource allocation for OT scheduling, staff deployment, and inventory control.
- Reduces error and response times with actionable alerts on KPI deviations and operational inefficiencies.
- Enhances transparency for administrators and stakeholders by consolidating all healthcare analytics metrics in one dashboard.
- Boosts hospital reporting accuracy and compliance by automating KPI data aggregation.
- Drives measurable improvements in healthcare operational efficiency and patient care quality.
KPIs to Track in Eye Hospital Operations Dashboards
Focusing on the right KPIs ensures that hospital operations align with clinical outcomes and patient experience. These are the most critical metrics to monitor:
- Total Admissions (count): Tracks hospital patient inflow over a specified timeframe.
- Surgical Procedures (count): Monitors volume and distribution of clinical operations by surgery type.
- OT Utilization (%): Measures operating theater resource use to identify underused time slots.
- Complication Rate (%): Flags patient safety risks across procedures and supports risk mitigation efforts.
- Average Recovery Time (days): Guides discharge planning and aftercare resource allocation.
- Emergency Procedure Rate (%): Highlights urgent care needs and resource readiness.
Frequently Asked Questions
Q1. What makes an Eye Hospital Operations Dashboard different from a regular hospital dashboard?
An Eye Hospital Operations Dashboard focuses exclusively on ophthalmology metrics such as surgery types, complication rates specific to eye procedures, and recovery trends, supporting clinical and operational decisions unique to eye care facilities.
Q2. How can dashboards help optimize hospital performance metrics?
Dashboards compile real-time hospital KPI data, helping administrators monitor patient flow, resource utilization, and compliance, which enables process improvement and more informed hospital management.
Q3. Can Eye Hospital Operations Dashboards be customized for multi-site hospital chains?
Yes, modern healthcare analytics dashboard solutions support multi-department and multi-site customization, allowing users to compare KPIs and resource management across locations.