
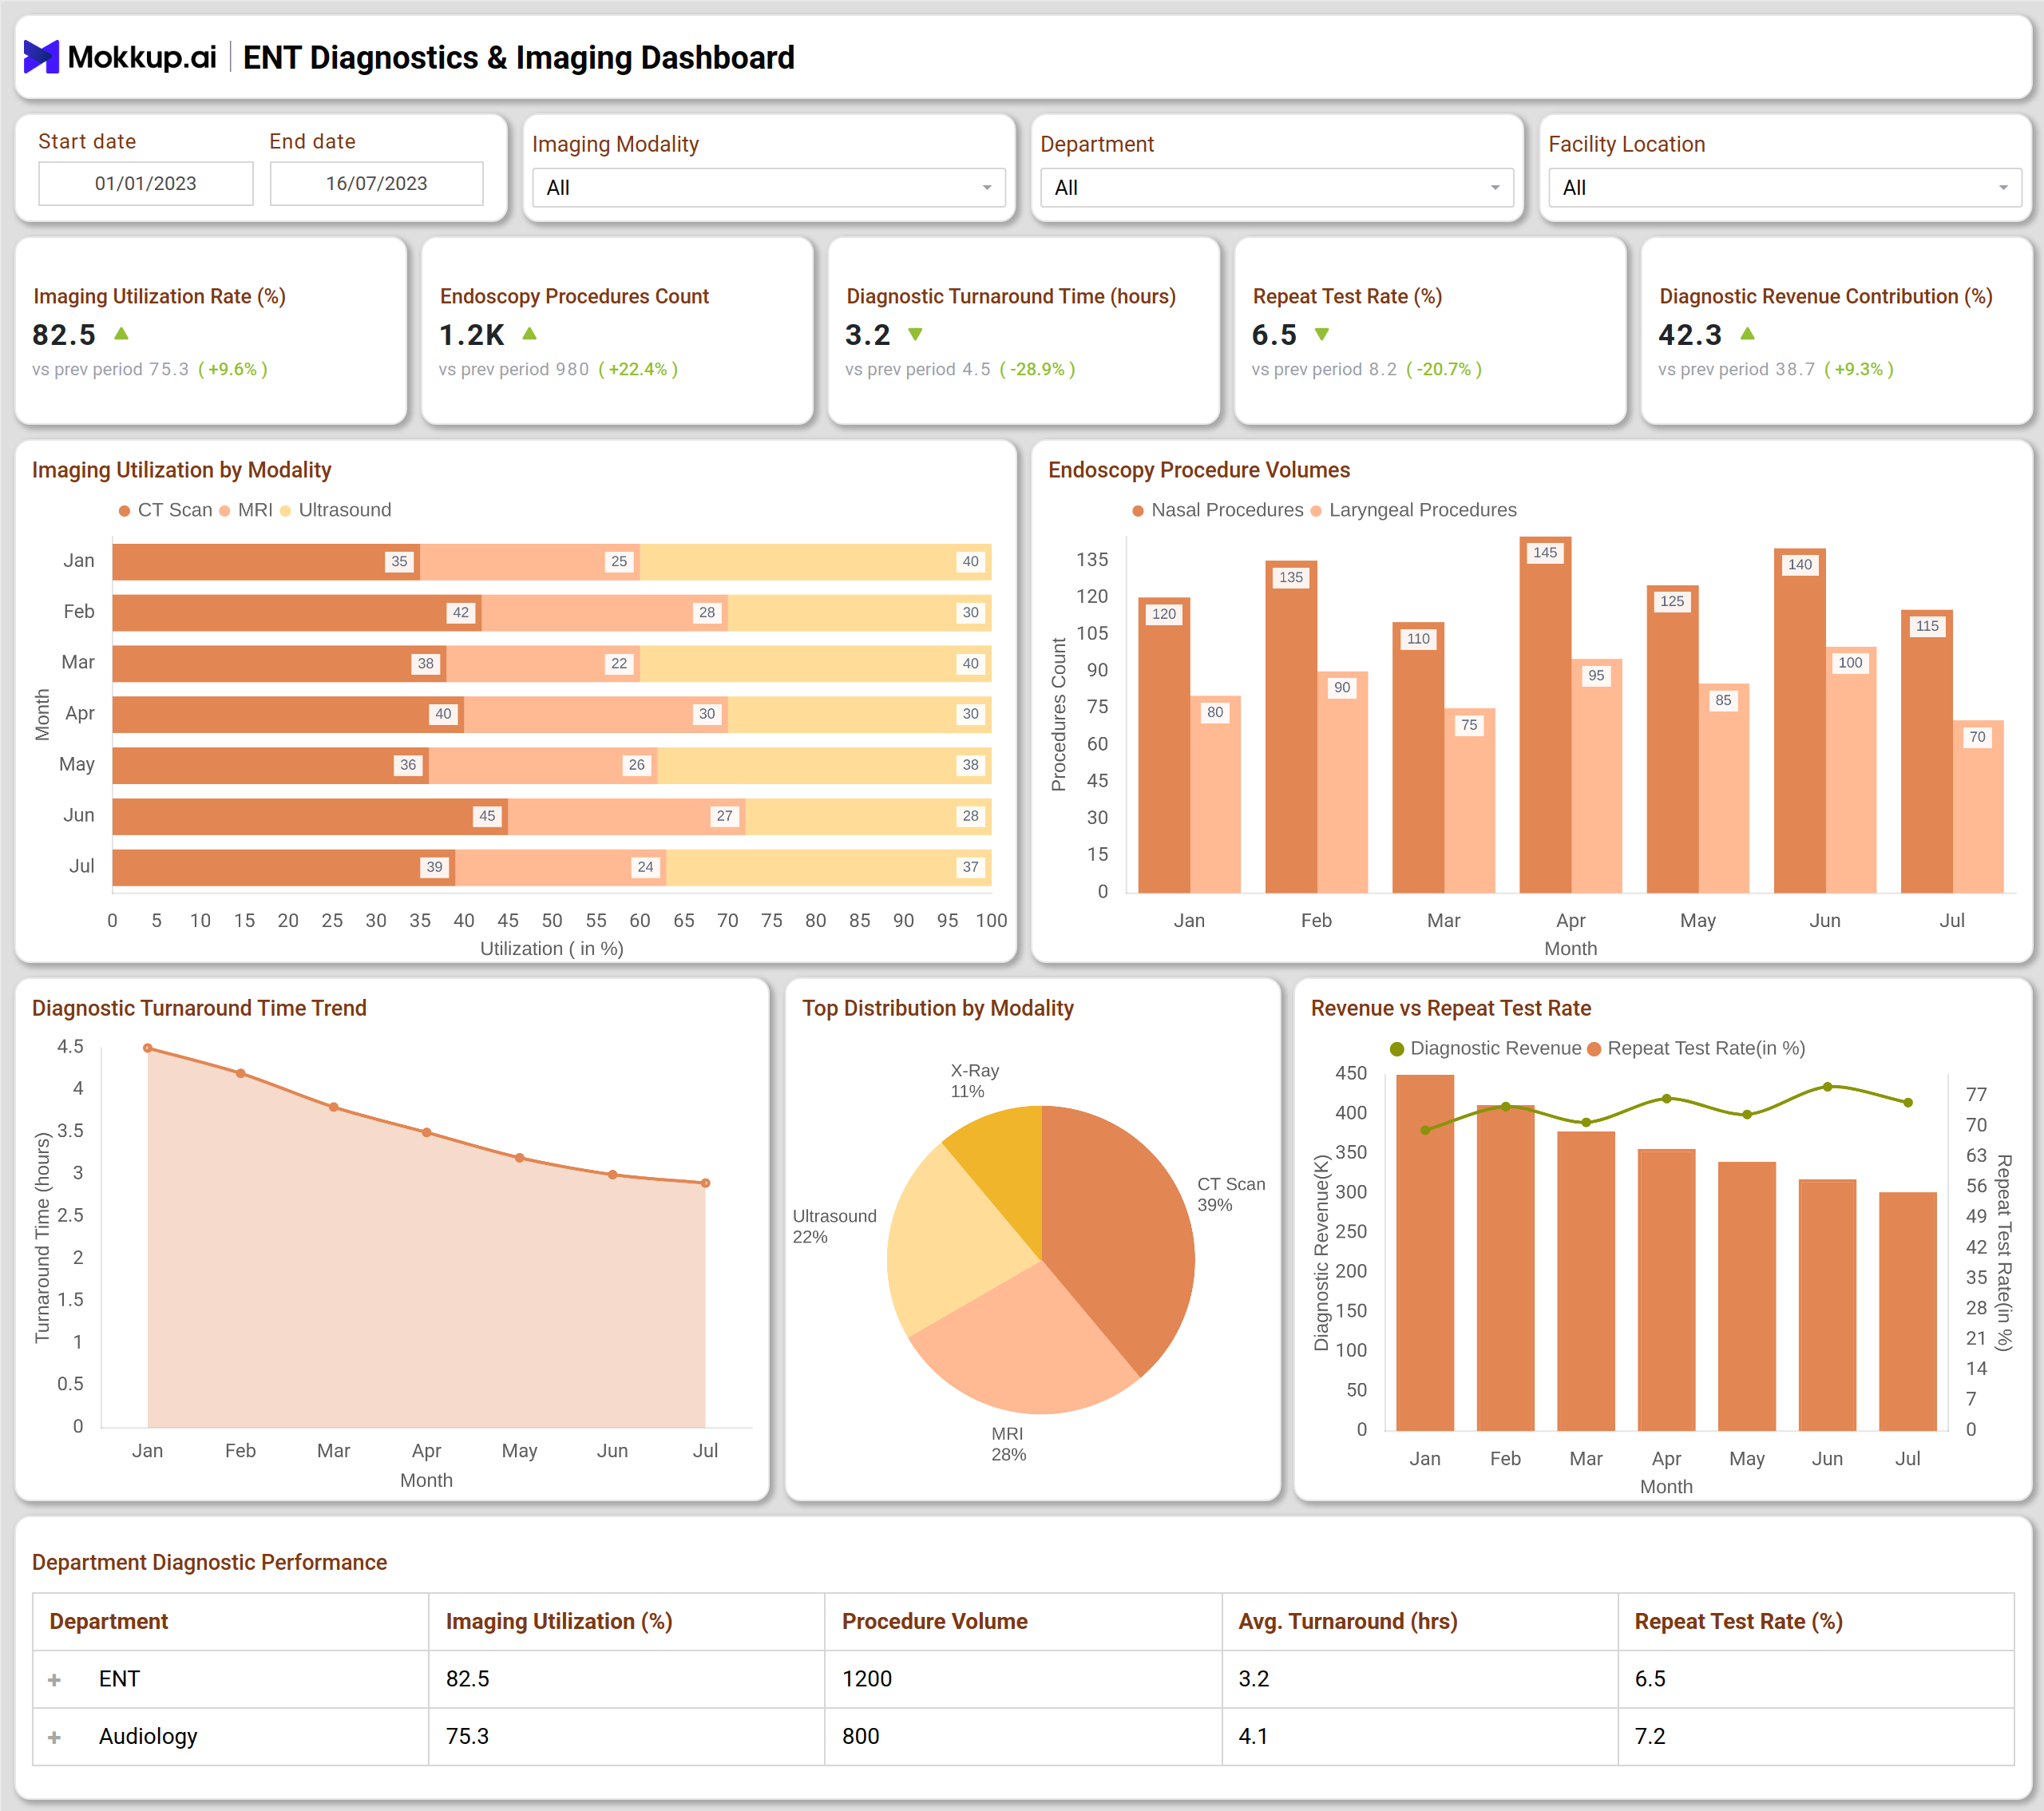
What is an ENT Diagnostics & Imaging Dashboard?
An ENT Diagnostics & Imaging Dashboard is a healthcare performance and analytics tool that consolidates key diagnostic metrics into a single, easy-to-understand visual interface. It provides valuable insights into Imaging Utilization Rate (%), Diagnostic Turnaround Time (hours), Repeat Test Rate (%), Endoscopy Procedure Counts, and Diagnostic Revenue Contribution (%).
The ENT diagnostics dashboard template helps hospitals and ENT departments monitor the performance of imaging operations, evaluate equipment usage, and optimize diagnostic processes. By integrating real-time data from multiple imaging modalities such as CT, MRI, Ultrasound, and Endoscopy, this dashboard empowers healthcare providers to enhance diagnostic accuracy, streamline workflows, and improve patient care efficiency. Such an approach forms a robust Medical Imaging Analytics framework that supports evidence-based decision-making.
The diagnostic performance dashboard also enables early identification of inefficiencies and repeat test trends, allowing for timely interventions and improved machine uptime — essential for delivering faster, more reliable diagnostic results.
How To Create ENT Diagnostics & Imaging Dashboards
You don’t need to build your report from scratch—just start with a ready-to-use sample ENT Diagnostics & Imaging Dashboard template from Mokkup. Plug in your own data and export it however you like. Here’s how to do it:
1. Create or Log in to Your Mokkup Account
Start by signing up on Mokkup.ai using your email. Already have an account? Just log in, and you’re good to go.
2. Choose and Customize Your Dashboard Template
Find the ENT Diagnostics & Imaging Dashboard template in the Templates section. Use the drag-and-drop editor to adjust KPIs, edit filters, or add elements based on your data.
3. Export to Your BI Tool
Once your dashboard is ready, use the BI Tool Export feature to send it directly to Power BI or Tableau for further analysis and enhancements. You can also download the dashboard as a PDF, PNG, or JPEG, embed it on a platform, or invite your team to collaborate.
Note: This is a Pro template. To use and customize this dashboard wireframe, you’ll need a Pro subscription on Mokkup. Upgrade anytime to unlock full access.
ENT Diagnostics & Imaging Dashboard Example
Create your personalized ENT Diagnostics & Imaging Dashboard, bringing all diagnostic KPIs into one unified visual framework. The Mokkup ENT Diagnostics & Imaging Dashboard wireframe provides a well-structured layout to monitor imaging utilization, turnaround time, and departmental efficiency.
You can modify elements and filters — such as Modality, Department, or Facility Location —in your ENT Imaging Utilization Dashboard to align with your organization’s reporting needs.
This approach allows healthcare professionals to seamlessly transform static reports into interactive healthcare analytics dashboards that deliver insights on Imaging Utilization, Diagnostic Turnaround, Endoscopy Volume, and Revenue Contribution. It is the perfect solution for hospitals looking to enhance diagnostic efficiency, patient satisfaction, and financial performance.
How to Analyze Data in ENT Diagnostics Dashboards
To extract maximum value from your ENT diagnostics dashboard, focus on analyzing:
- Imaging Utilization Rate: Identify which machines (CT, MRI, Ultrasound) are under- or overused.
- Turnaround Time Efficiency: Review diagnostic report delivery times to minimize patient waiting.
- Repeat Test Rate: Detect inconsistencies or quality issues leading to re-tests.
- Revenue vs. Performance: Correlate test volume and profitability by modality.
- Endoscopy Procedures Trend: Monitor ENT-specific diagnostic workload and performance variations.
These insights ensure that your ENT diagnostics and imaging dashboard supports better scheduling, maintenance planning, and patient service delivery.
Benefits of ENT Diagnostics & Imaging Dashboard
Implementing an ENT diagnostics dashboard template offers multiple advantages for healthcare organizations:
- Enhanced Operational Efficiency: Improve utilization of CT, MRI, and Ultrasound equipment.
- Reduced Diagnostic Delays: Accelerate report turnaround times for faster patient care.
- Better Quality Control: Identify repeat test causes and address equipment reliability.
- Increased Profitability: Monitor revenue contribution and reduce operational costs.
- Data-Driven Decision-Making: Provide actionable insights to administrators and clinicians.
With its structured visuals and real-time updates, the ENT diagnostics dashboard helps improve diagnostic accuracy and resource utilization across departments.
KPIs to Track in ENT Diagnostics & Imaging Dashboards
Here are the key performance indicators to track using your ENT diagnostics dashboard template:
- Imaging Utilization Rate (%): Measures how effectively diagnostic equipment is being used.
- Endoscopy Procedures Count: Tracks procedure volume across ENT diagnostic services.
- Diagnostic Turnaround Time (hours): Monitors the time between imaging and report delivery.
- Repeat Test Rate (%): Evaluates the frequency of repeated diagnostics due to quality issues.
- Diagnostic Revenue Contribution (%): Shows the financial impact of imaging and endoscopy services.
Together, these KPIs enable hospitals to maintain high diagnostic accuracy and optimize clinical operations.
Frequently Asked Questions
1. Why is an ENT Diagnostics & Imaging Dashboard important?
It helps hospitals monitor diagnostic efficiency, turnaround times, and machine utilization, ensuring improved operational and clinical performance.
2. Who can use this dashboard?
This dashboard is ideal for ENT departments, hospital administrators, and diagnostic center managers who aim to optimize imaging workflows and performance metrics.
3. Which KPIs does the ENT Diagnostics & Imaging Dashboard focus on?
The dashboard focuses on key diagnostic and operational KPIs, including Imaging Utilization Rate (%), Diagnostic Turnaround Time (hours), Repeat Test Rate (%), Endoscopy Procedure Counts, and Diagnostic Revenue Contribution (%). Tracking these metrics helps hospitals optimize workflows, improve patient care, and maximize equipment efficiency.