What is a Dental Imaging & Diagnostics Dashboard?
A Dental Imaging & Diagnostics Dashboard is a digital solution that centralizes dental diagnostic data, imaging scans, operational performance, and reporting for clinics and dental departments. This dashboard template brings together dental X-ray data, radiology scan results, diagnostic workflow, patient analytics, and follow-up metrics into an interactive platform, streamlining the entire imaging process.
How to Create a Dental Imaging & Diagnostics Dashboard
You don’t need to build your report from scratch—just start with a ready-to-use Dental Imaging & Diagnostics dashboard template from Mokkup. Add in your data and export it however you like. Here’s how to do it:
1. Create or Log in to Your Mokkup Account
Start by signing up on Mokkup.ai using your email. If you already have an account, just log in, and you’ll be good to go.
2. Choose and Customize Your Dashboard Template
Find the Dental Imaging & Diagnostics Dashboard template in the Templates section. Use the drag-and-drop editor to adjust KPIs, edit filters, or add elements based on your data.
3. Export to Your BI Tool
Once your dashboard wireframe is ready, use the BI Tool Export feature to send it directly to Power BI or Tableau for further analysis and enhancements. You can also download the dashboard as a PDF, PNG, or JPEG, embed it on a platform, or invite your team to collaborate.
Note: This is a Pro template. You’ll need a Pro subscription on Mokkup to use and customize this dashboard wireframe. Upgrade anytime to unlock full access.
Dental Imaging & Diagnostics Dashboard Example
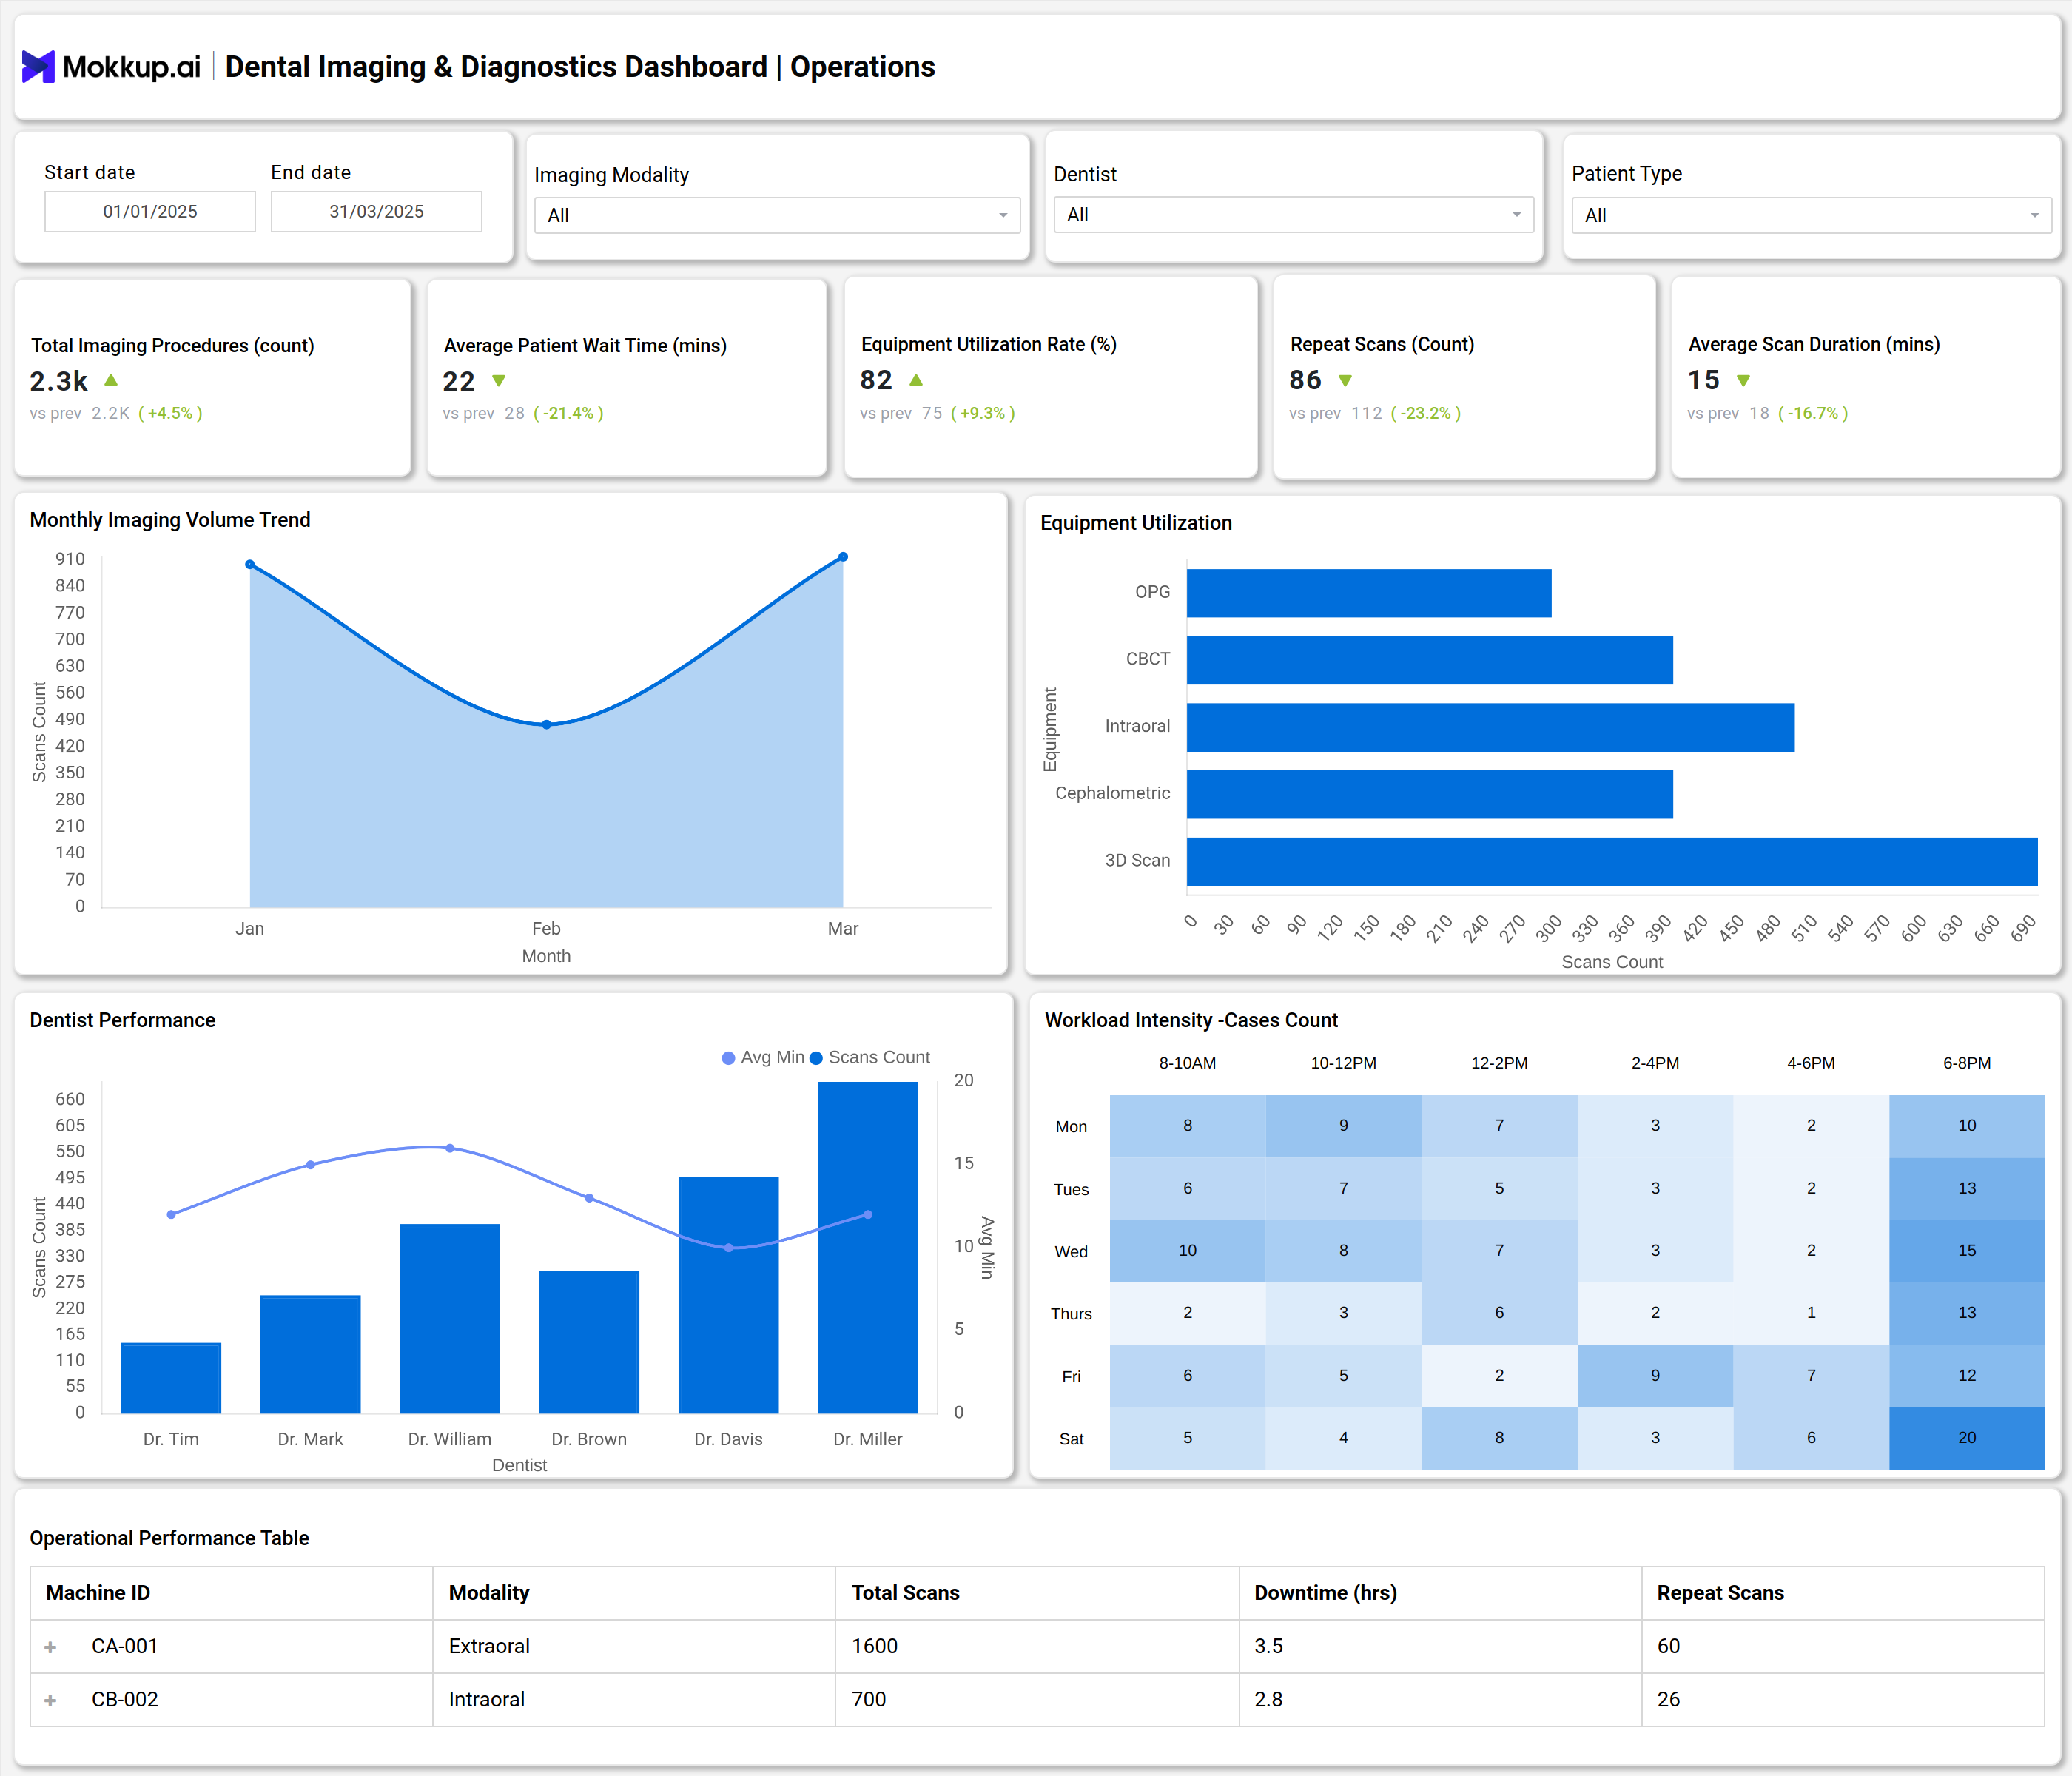
A standard dashboard template captures all the core functions of dental imaging operations. The example includes sections for total dental imaging procedures, average patient wait time, equipment and modality utilization rates, scan duration, and repeat scan counts. It features imaging modality analytics for X-ray, CBCT, intraoral, cephalometric, and 3D scan types.
Performance widgets highlight the efficiency of radiology staff, displaying average report turnaround, accuracy index, and patient follow-up rates. The dashboard supports workflow optimization by monitoring diagnosis distribution, case volumes per modality, and radiologist performance scores. It surfaces specialized dental imaging reports and scan analytics that are essential for clinical audit, patient care tracking, and operational improvement.
How to Analyze Data in Dental Imaging & Diagnostics Dashboards
Analyzing dental imaging and diagnostics data helps clinics improve efficiency, ensure accurate reporting, and maintain high-quality patient care through optimized use of imaging technologies:
- Monitor Turnaround Time & Accuracy: Evaluate how quickly and accurately diagnostic reports are generated to measure operational efficiency.
- Track Diagnostic Yield per Modality: Identify high-performing imaging technologies and areas needing improvement.
- Evaluate Radiologist Performance: Use performance scores to maintain quality assurance in diagnostic interpretation.
- Review Diagnosis Distribution: Spot trends, workflow bottlenecks, or underdiagnosed conditions for better planning.
- Assess Equipment Utilization: Measure usage rates to guide resource allocation and capital expenditure.
- Analyze Repeat Scan Rates: Track repeat scans for quality control and patient safety benchmarking.
- Examine Patient Follow-Up Rates: Ensure continuity of care and confirm the effectiveness of diagnostic reporting.
Benefits of Dental Imaging & Diagnostics Dashboards
A dental imaging dashboard streamlines diagnostics, boosts operational accuracy, and empowers clinics with actionable insights for better patient management:
- Optimized Imaging Workflow: Reduces turnaround time and improves diagnostic efficiency.
- Enhanced Report Accuracy: Centralized analytics help maintain high-quality imaging outcomes.
- Data-Driven Resource Planning: Tracks equipment utilization to guide procurement and scheduling decisions.
- Improved Compliance & Audits: Simplifies reporting with customizable audit-ready diagnostic summaries.
- Actionable Clinical Insights: Enables dental teams to enhance treatment planning and patient outcomes.
- Reduced Errors & Repeat Scans: Promotes safety through process tracking and validation mechanisms.
KPIs to Track in Dental Imaging & Diagnostics Dashboards
Tracking the right KPIs ensures dental imaging operations remain efficient, accurate, and aligned with patient care goals:
- Report Turnaround Time: Measures how quickly diagnostic reports are delivered.
- Report Accuracy Index: Tracks the percentage of accurate imaging diagnostics generated.
- Referral Conversion Rate: Shows the proportion of external referrals resulting in clinical actions.
- Diagnostic Yield per Modality: Assesses diagnostic output for each imaging technology or modality.
- Patient Follow-up Rate: Indicates the percentage of patients actively followed up after diagnostics.
- Total Imaging Procedures: Counts the number of dental scans performed in a specified period.
Frequently Asked Questions
Q1.What is a dental imaging dashboard used for?
Dental imaging dashboards are used to monitor, analyze, and optimize the operational and clinical aspects of dental imaging and diagnostics, including scan procedures, staff performance, and equipment usage.
Q2. Who benefits from using this dashboard?
Dental clinics, radiology departments, and healthcare administrators benefit by improving diagnostic efficiency, patient experience, and resource utilization.
Q3. How does the Dental Imaging & Diagnostics Dashboard improve patient care?
By tracking report accuracy, follow-ups, and equipment utilization, the dashboard helps clinics reduce errors, ensure timely diagnostics, and enhance overall patient outcomes.