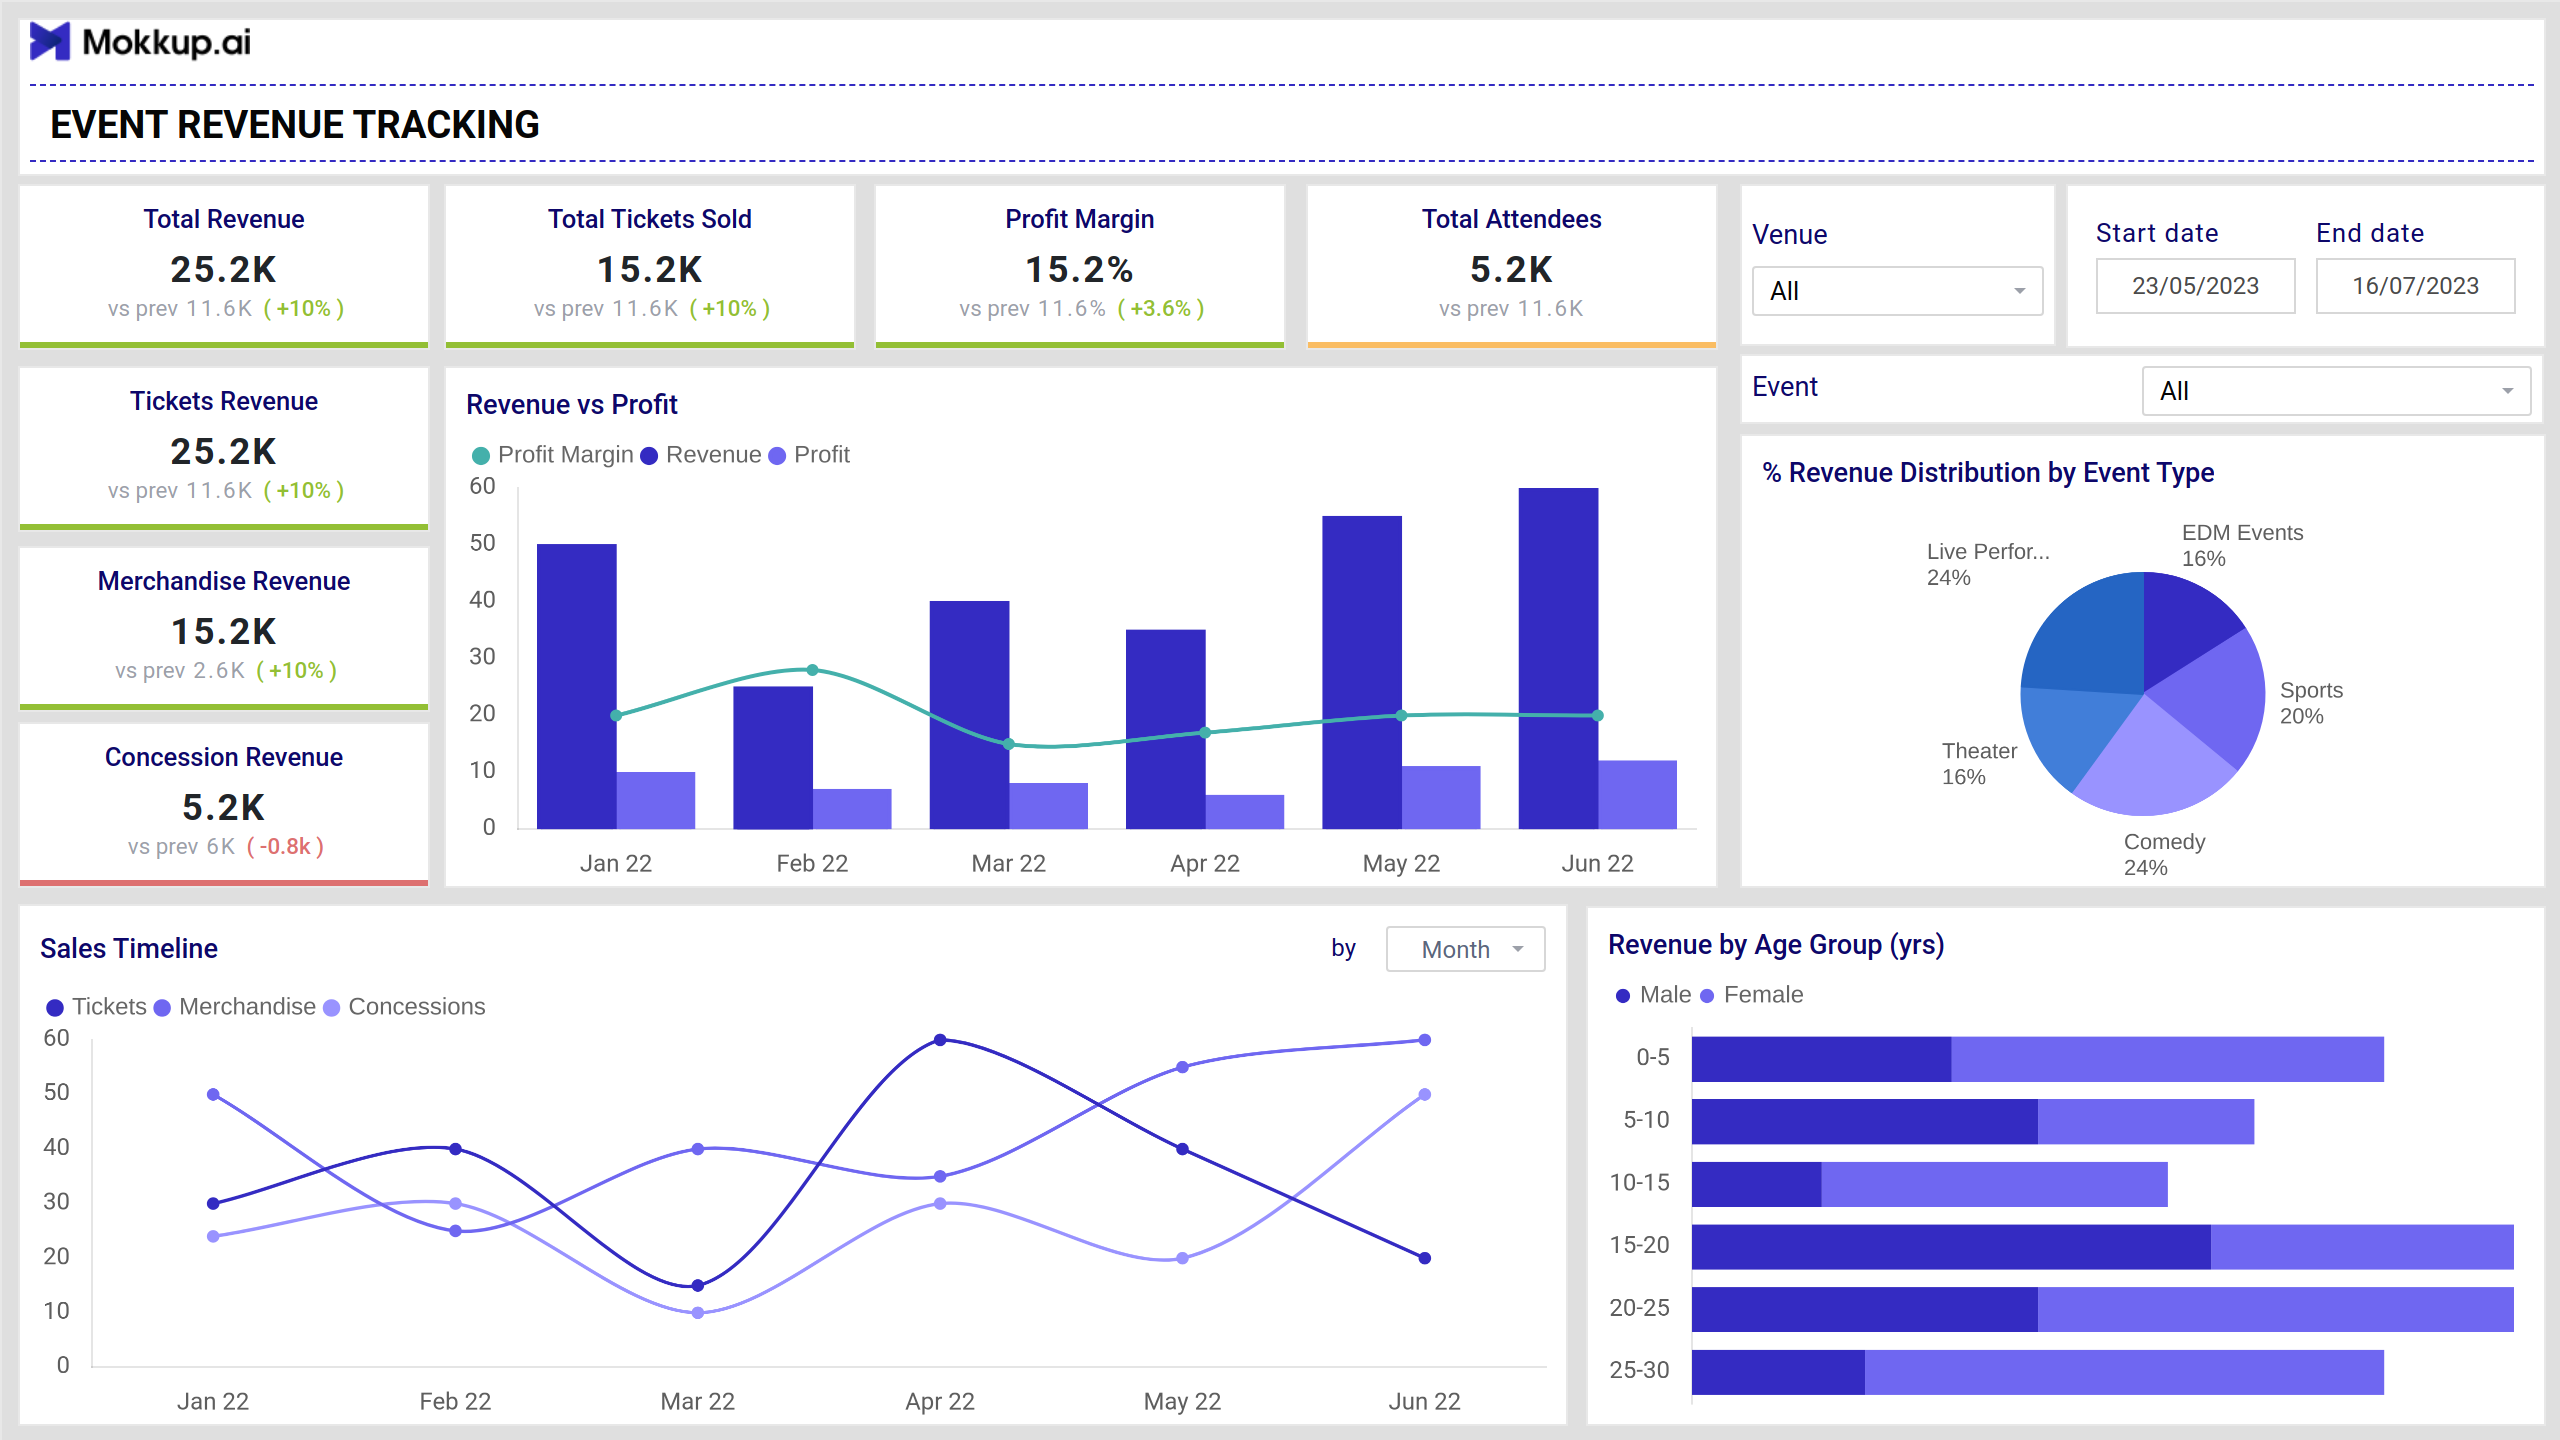
This event profitability dashboard gives a clear view of event performance across several metrics. It displays metrics like total attendees, profit margin, merchandise revenue, etc. With this event revenue breakdown, you can monitor ticket purchases monthly by filtering start date, end date, and venues. This can be integrated into your CRM system, allowing you to get real insights to crush more deals.
Event Revenue Tracking
This template tracks the revenue performance for events by consolidating financial metrics and data points that are catalysts for analyzing the performance of events. Along with a clear breakdown of revenues or income sources, this customizable dashboard template gives transparent financial visibility by elaborating on merchandise, concessions, and tickets. Such live updates will embrace quick decision-making.
Plus, the revenue by age and revenue by event type will make your visualization much more relevant so that you are lagging behind the opportunities for cross-selling and upselling.
Key Terms to Know:
- Profit Margin: This is the profit margin incurred by the event planner after accounting for all associated expenses.
- Ticket Yield: This KPI measures the percentage of revenues earned by selling each ticket.
- Ticket Revenue: The revenue is generated by selling tickets for an event or a venue.
- Merchandise Revenue: This metric evaluates the revenue earned after selling physical products during the event. This includes exclusive items sold to attendees.
- Concession Revenue: It will measure the revenues generated from selling refreshments to attendees during the event.
Sponsorship Details
This dashboard views sponsorship performance and key metrics, including agreements and financial contributions. The line and bar graphs represent net impressions and net conversions, helping sponsors evaluate event ROI (return on investment).
Key Terms to Know:
- Sponsorship Revenue: The income is associated with the partnerships made in the events for sponsoring some activity.
- Net Impressions: This metric evaluates the number of times the advertisement is viewed by the individual.
- Net Conversions: It will calculate the number of conversions after invalid transactions, refunds, or cancellations.
- Event ROI: A measure of event profitability calculated by considering the revenue and cost associated with the event.
- Sponsorship Agreement: A legal contract between an event planner and a sponsor outlining the sponsorship's specifics, terms, and conditions.
Dashboard Template Insights
- Customizable wireframe template help in visualizing the event financial metrics in a centralized format.
- Get a close view of the high-performing events and underperforming aspects.
- Recognize revenue trends such as popular merchandise and peak ticket sales.
- Real-time data allows iterations to the pricing strategies.
- The dashboard helps in assessing the conversions and impressions achieved through sponsorship-branded materials.
- Tracks sponsorship contributions to analyze the impact on profitability and success.
Conclusion
The event revenue analysis dashboard is the turn-key solution that can empower event organizers to make real-time decisions. By measuring the key performance indicators of the event revenue, many financial decisions are simplified and can be a driving force for undertaking the desired business outcomes.