
What is an ENT Clinical Outcomes Dashboard?
An ENT Clinical Outcomes Dashboard is a specialized data visualization and performance-tracking tool designed for hospitals and clinics offering Ear, Nose, and Throat (ENT) services. It helps healthcare professionals monitor treatment outcomes, complication rates, patient satisfaction, and physician performance in one centralized view.
This ENT dashboard template combines clinical analytics with patient care insights, enabling decision-makers to evaluate treatment success rates (%), complication rates (%), readmission rates (%), and patient satisfaction scores (%). With its visual insights and performance KPIs, the clinical outcomes dashboard provides actionable intelligence to enhance care quality, reduce readmissions, and improve overall patient outcomes.
By utilizing this ENT treatment performance dashboard, healthcare organizations can pinpoint areas for improvement in clinical processes, evaluate physician-level performance, and align their strategies with patient-centered care objectives.
How To Create an ENT Clinical Outcomes Dashboard
You don’t need to build your report from scratch—just start with a ready-to-use sample ENT Clinical Outcomes dashboard template from Mokkup. Add in your data and export it however you like. Here’s how to do it:
1. Create or Log in to Your Mokkup Account
Start by signing up on Mokkup.ai using your email. If you already have an account, just log in, and you’ll be good to go.
2. Choose and Customize Your Dashboard Template
You can find the ENT Clinical Outcomes Dashboard template in the Templates section. Use the drag-and-drop editor to adjust KPIs, edit filters, or add elements based on your data.
3. Export to Your BI Tool
Once your dashboard wireframe is ready, use the BI Tool Export feature to send it directly to Power BI or Tableau for further analysis and enhancements. You can also download the dashboard as a PDF, PNG, or JPEG, embed it on a platform, or invite your team to collaborate.
Note: This is a Pro template. You’ll need a Pro subscription on Mokkup to use and customize this dashboard wireframe. Upgrade anytime to unlock full access.
ENT Clinical Outcomes Dashboard Example
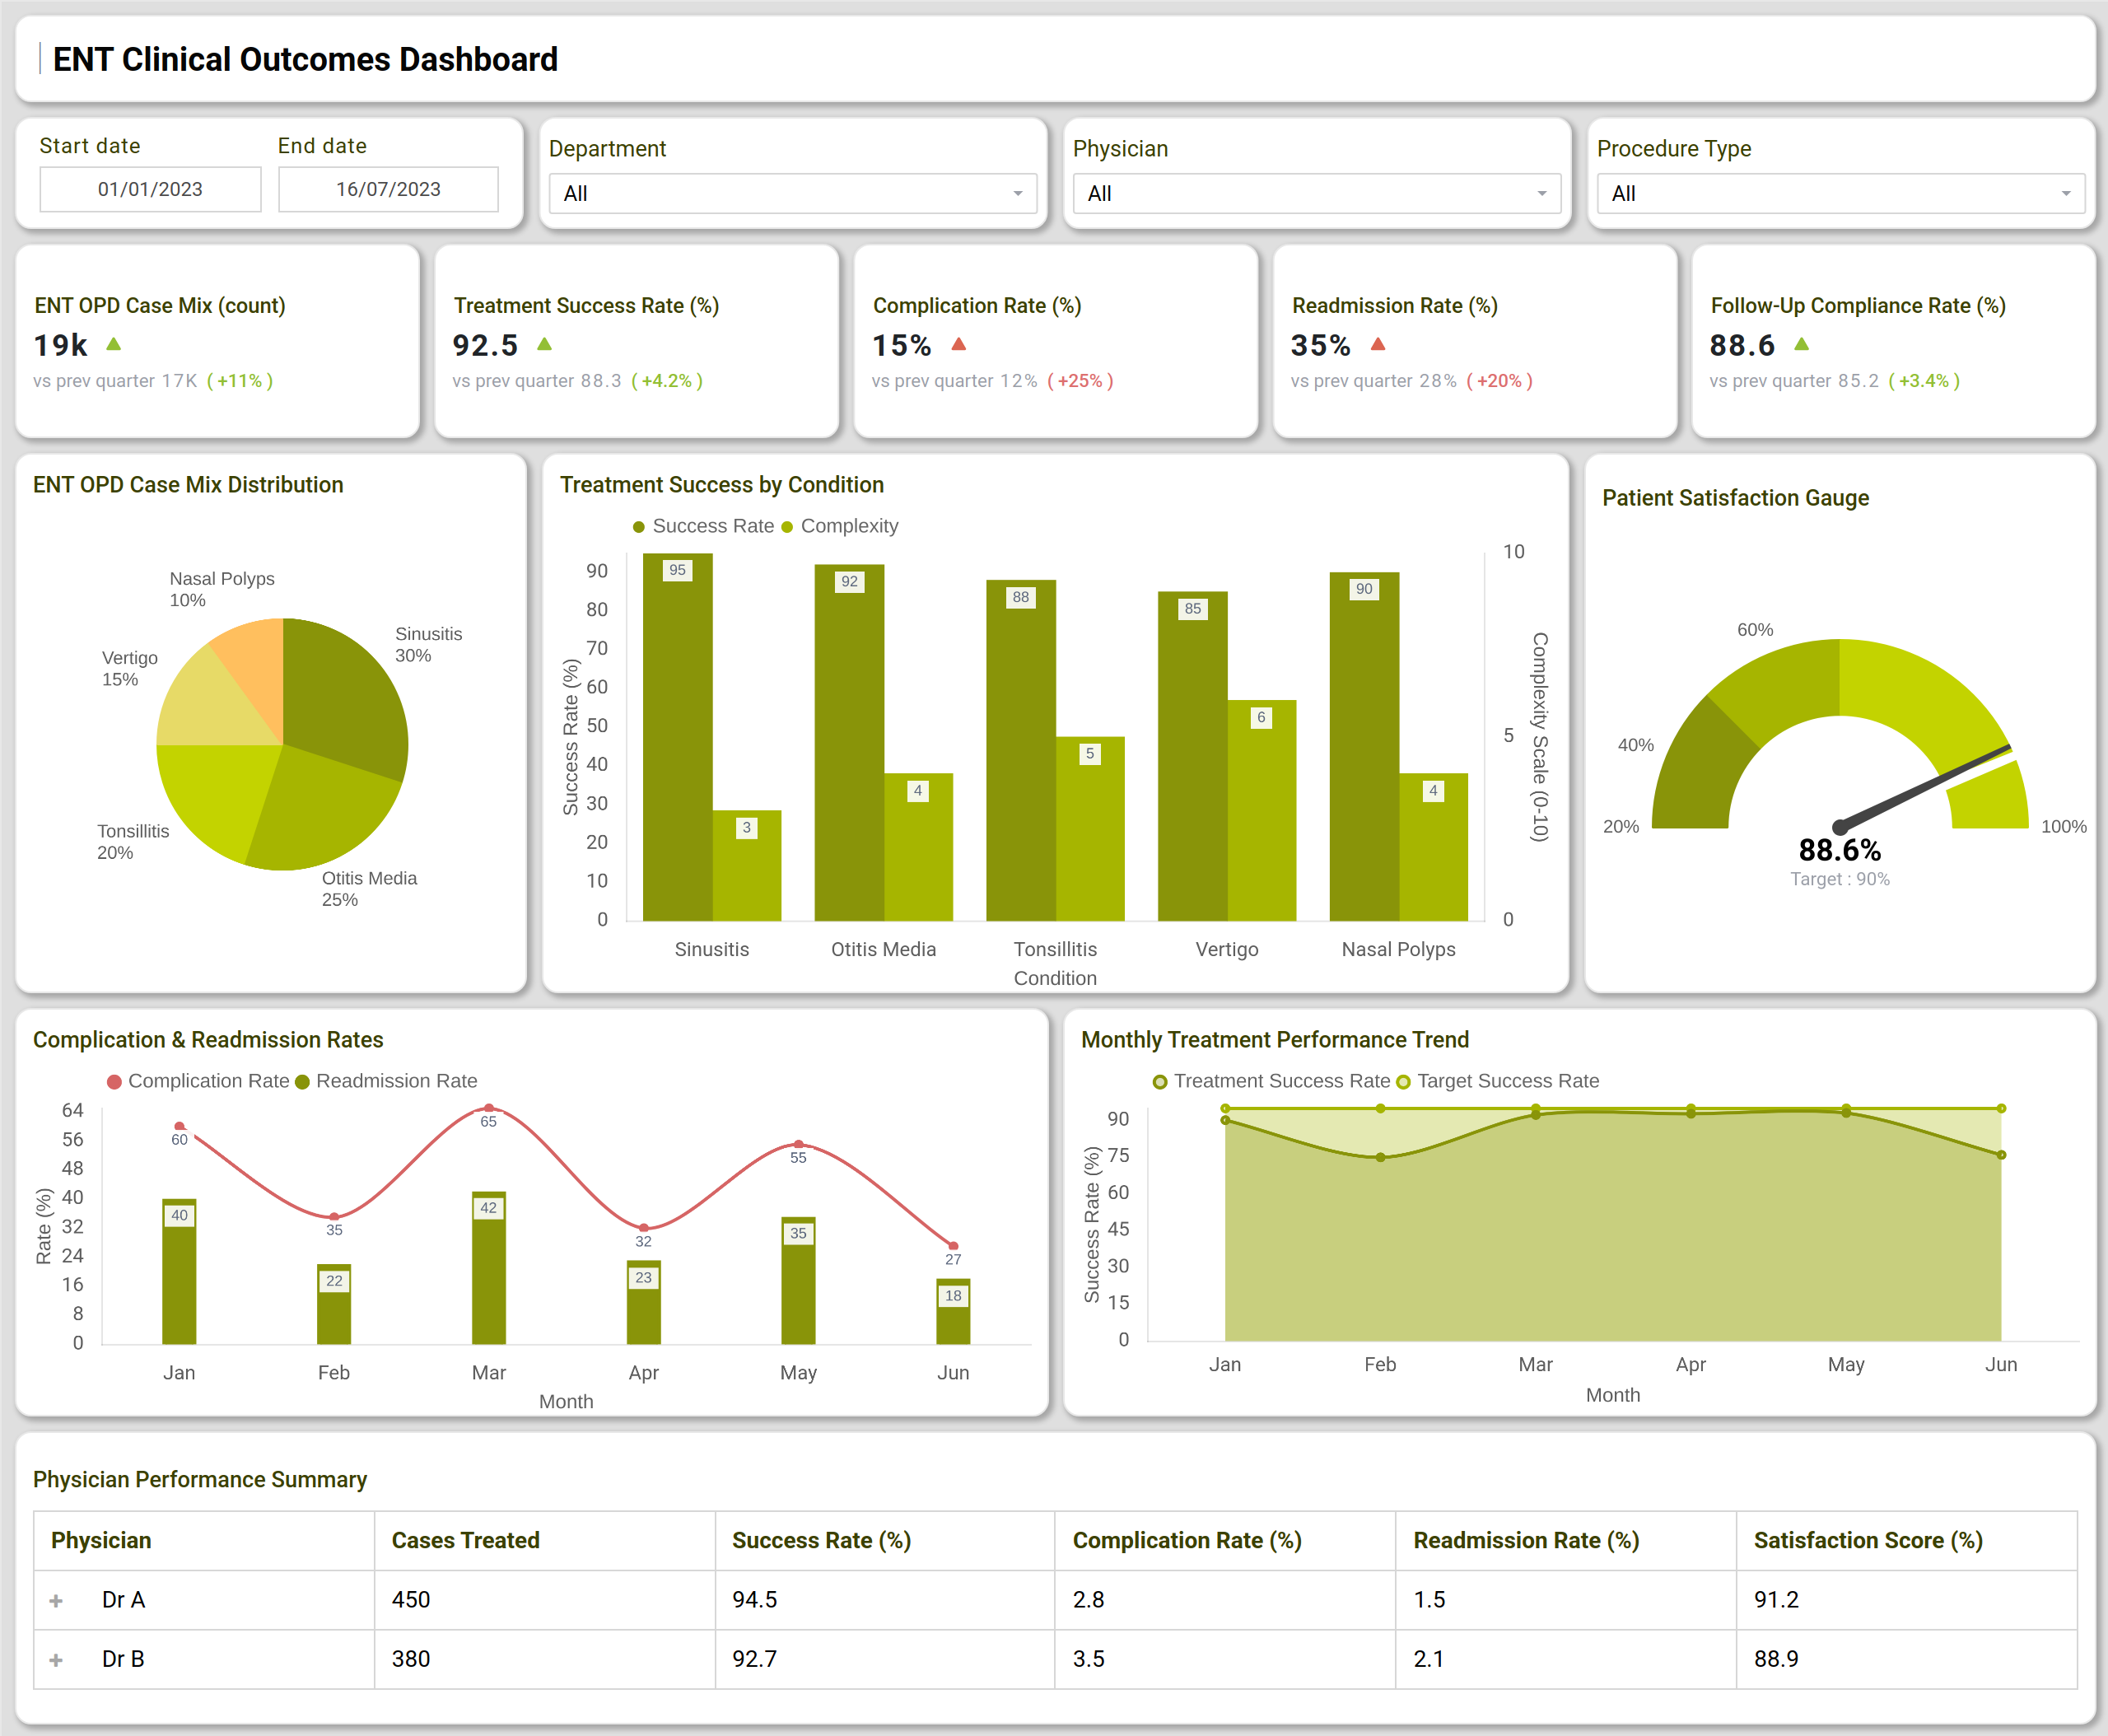
The example ENT Clinical Outcomes Dashboard provides a comprehensive view of ENT department performance, combining patient outcomes, treatment efficiency, and satisfaction data into a single, unified interface. The Treatment Success by Condition bar chart compares outcome success across ENT conditions, enabling performance benchmarking between different treatment types. This is particularly useful for identifying procedures that require better care pathways for undertaking ENT preventive measures. The Patient Satisfaction Gauge provides an at-a-glance view of satisfaction levels relative to a target benchmark, ensuring that patient experience remains a key performance metric within the department.
The Complication & Readmission Rates chart highlights monthly variations in clinical risks and readmissions, allowing care teams to pinpoint causes and implement corrective measures. Meanwhile, the Monthly Treatment Performance Trend tracks treatment success against target success rates to maintain consistent clinical excellence.
Altogether, this ENT clinical performance dashboard equips administrators and physicians with real-time analytics to drive quality care and operational improvement.
How to Analyze Data in an ENT Dashboard
To make the most of your ENT treatment performance dashboard, focus on analyzing these key aspects:
- Treatment Success Trends: Track variations in success rates by condition and physician.
- Complication Patterns: Identify recurring causes of post-treatment complications or readmissions.
- Patient Satisfaction Insights: Utilize satisfaction data to enhance care quality and improve the patient experience.
- Physician Benchmarking: Compare doctor-specific performance to maintain consistent clinical standards.
- Case Mix Distribution: Understand which ENT conditions dominate and optimize resources accordingly.
Benefits of Using an ENT Clinical Outcomes Dashboard
Using a clinical outcomes dashboard for ENT provides several measurable advantages:
- Improved Treatment Quality: Real-time tracking ensures higher clinical standards and timely interventions.
- Enhanced Patient Experience: Visibility into satisfaction data promotes continuous quality improvement.
- Reduced Complications & Readmissions: Data-driven decisions lead to lower clinical errors and fewer post-procedure returns.
- Performance Transparency: Facilitates objective comparison of physician performance metrics.
- Data-Driven Management: Supports resource allocation, operational optimization, and evidence-based decisions.
KPIs to Track in ENT Clinical Outcomes Dashboards
The key KPIs include:
- ENT OPD Case Mix (count) – Total ENT consultations or cases treated.
- Treatment Success Rate (%) – Overall patient recovery or treatment success ratio.
- Complication Rate (%) – Monitors incidents post-treatment to evaluate clinical safety.
- Readmission Rate (%) – Tracks patients returning for repeat procedures or follow-ups.
- Patient Satisfaction Score (%) – Reflects the overall experience and quality of care delivered.
Frequently Asked Questions
1. Why is an ENT Clinical Outcomes Dashboard important?
It helps hospitals measure and improve treatment success, patient satisfaction, and physician efficiency in ENT care.
2. Can the dashboard track physician-level outcomes?
Yes, the ENT dashboard includes a physician performance section that compares cases, success, and satisfaction scores.
3. Is this dashboard customizable for different ENT procedures?
Absolutely. The clinical outcomes analytics dashboard supports all ENT treatments, such as sinusitis, otitis media, and tonsillitis, with flexible data filters.