What is an ENT Preventive & Screening Dashboard?
An ENT Preventive & Screening Dashboard is a specialized data analytics template designed for hospitals and healthcare institutions to monitor and improve ear, nose, and throat (ENT) screening outcomes. This dashboard wireframe provides insights into screening coverage, referral follow-ups, diagnostic confirmation, and treatment initiation.
Hospitals use this ENT preventive and screening dashboard template to ensure effective outreach, enhance patient engagement, and improve care delivery across diverse populations.
The template functions as a preventive ENT health data analytics tool, helping decision-makers assess both program efficiency and population health impact. It transforms complex ENT screening data into clear visual metrics that enable faster, evidence-based action.
How to Create an ENT Preventive & Screening Dashboard
You don’t need to build your report from scratch—just start with a ready-to-use ENT Preventive Care & Screening dashboard template from Mokkup. Add in your data and export it however you like. Here’s how to do it:
1. Create or Log in to Your Mokkup Account
Start by signing up on Mokkup.ai using your email. If you already have an account, just log in, and you’ll be good to go.
2. Choose and Customize Your Dashboard Template
Find the ENT Preventive & Screening Dashboard template in the Templates section. Use the drag-and-drop editor to adjust KPIs, edit filters, or add elements based on your data.
3. Export to Your BI Tool
Once your dashboard wireframe is ready, use the BI Tool Export feature to send it directly to Power BI or Tableau for further analysis and enhancements. You can also download the dashboard as a PDF, PNG, or JPEG, embed it on a platform, or invite your team to collaborate.
Note: This is a Pro template. You’ll need a Pro subscription on Mokkup to use and customize this dashboard wireframe. Upgrade anytime to unlock full access.
ENT Preventive & Screening Dashboard Example
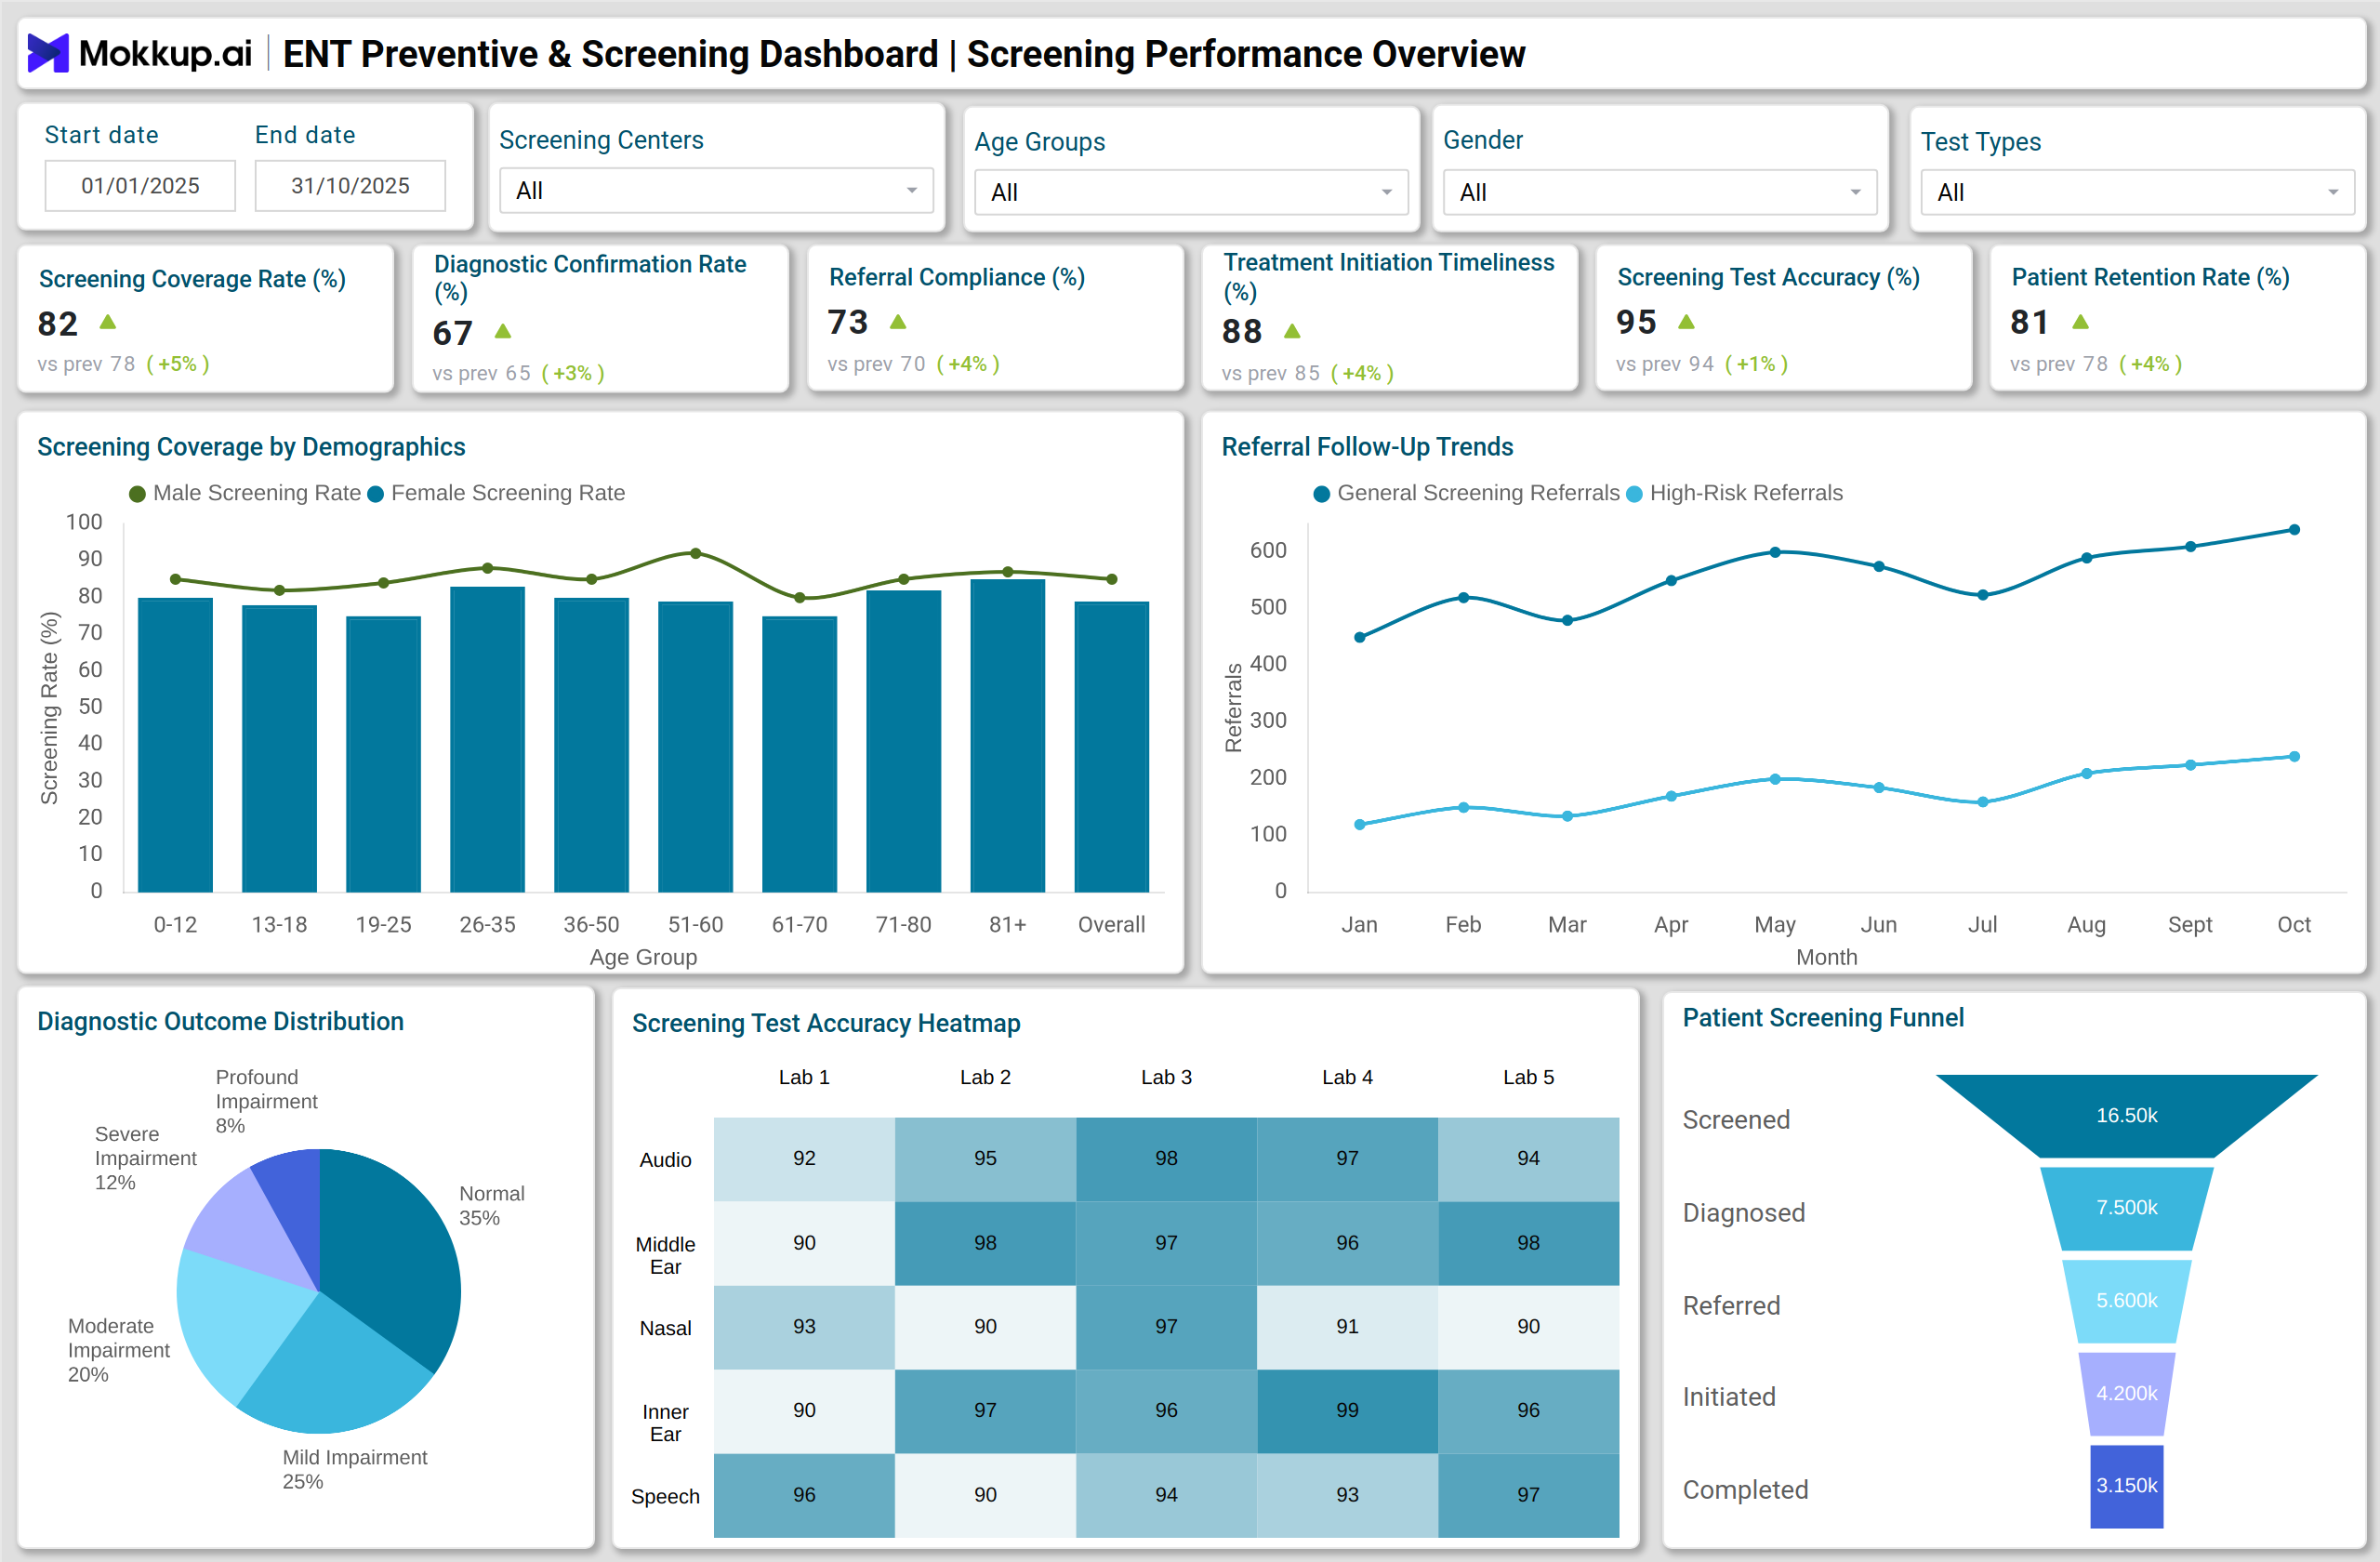
A practical ENT and audiology performance tracking dashboard integrates multiple data visualizations to provide a complete picture of screening and preventive performance. For instance, a stacked column chart can display screening coverage segmented by age group and gender to highlight demographic participation. A line chart comparing general versus high-risk referral follow-up rates reveals compliance trends over time. Pie charts can show diagnostic outcomes distribution, offering insight into the proportions of normal, mild, or severe impairment detected.
A heatmap visualizes test accuracy variations across centers and test types, helping identify where quality improvement is needed. Similarly, a funnel chart illustrates how patients progress from screening to treatment initiation, exposing potential drop-off points. Additional visuals, such as area charts and gauge charts, measure ongoing community engagement and outreach effectiveness. This setup enables hospital administrators to use the ENT screening and referral compliance dashboard as a single, unified platform for monitoring patient flow and program success.
How to Analyze Data in ENT Preventive & Screening Dashboards
ENT preventive care and screening dashboards help hospitals and clinics monitor program effectiveness, patient follow-up, and community outreach. By analyzing key metrics, healthcare teams can improve service delivery and patient outcomes:
- Track Screening Coverage: Assess population reach by age, gender, and location to ensure equitable access to preventive programs.
- Monitor Diagnostic Accuracy: Review test accuracy by center and test type to maintain diagnostic reliability.
- Evaluate Referral Compliance: Analyze referral and follow-up rates to improve care continuity and reduce patient loss.
- Assess Treatment Timeliness: Measure time from diagnosis to treatment initiation to optimize patient management.
- Analyze Community Engagement: Use engagement metrics to evaluate participation in preventive ENT programs.
- Compare Performance Across Locations: Use visual comparisons to identify high-performing centers and replicate success models.
Benefits of ENT Preventive & Screening Dashboards
A well-designed ENT dashboard provides hospitals with actionable insights to improve preventive care, optimize resources, and enhance patient outcomes:
- Enhanced Program Visibility: Centralized view of screening and referral activities across facilities.
- Data-Driven Decisions: Real-time insights enable faster operational and clinical interventions.
- Improved Referral Compliance: Continuous tracking minimizes patient drop-offs between screening and treatment.
- Better Resource Utilization: Identifies areas needing staff, equipment, or outreach reinforcement.
- Quality Assurance: Supports performance benchmarking through diagnostic and accuracy metrics.
- Community Engagement Optimization: Measures and boosts participation in preventive care initiatives.
KPIs to Track in ENT Preventive & Screening Dashboards
Monitoring the right KPIs ensures the effectiveness of ENT preventive programs and patient care continuity:
- Screening Coverage Rate (%): Percentage of the target population screened within a period.
- Diagnostic Confirmation Rate (%): Proportion of screenings accurately confirmed with follow-up tests.
- Referral and Follow-Up Compliance (%): Measures patient adherence to recommended referrals.
- Treatment Initiation Timeliness (%): Tracks how quickly patients receive treatment after diagnosis.
- Screening Test Accuracy (%): Evaluates the reliability of diagnostic tests across centers.
- Patient Retention Rate (%): Percentage of patients who complete the entire care pathway.
- Outreach Program Coverage (%): Assesses participation in community preventive initiatives.
These KPIs allow hospitals to convert raw screening data into measurable outcomes, supporting better management of preventive ENT programs and aligning with national healthcare quality standards.
Frequently Asked Questions
Q1. Who should use an ENT Preventive & Screening Dashboard?
This dashboard can be used by healthcare administrators, ENT specialists, and public health program managers to monitor preventive screening activities, referrals, and outcomes.
Q2. How does this dashboard improve patient care?
It provides visibility into screening and referral performance, helping reduce delays in diagnosis and treatment while improving patient retention.
Q3. What makes this dashboard suitable for ENT and audiology programs?
It focuses on ENT-specific parameters, screening accuracy, referral timeliness, and outreach efficiency, allowing hospitals to track clinical and community outcomes effectively.
Q4. How often should data be reviewed?
Monthly reviews are recommended to assess trends and adjust screening strategies for higher efficiency and outreach coverage.