
What is a Dental Clinical Performance Dashboard?
A Dental Clinical Performance Dashboard is a comprehensive digital template that enables dental clinics to track, visualize, and evaluate key clinical metrics related to patient care and treatment effectiveness. By consolidating data on dental patient outcomes analytics, treatment completion rates, and care quality, this dashboard wireframe provides clinics with a clear understanding of their clinical performance.
How to Create a Dental Clinical Performance Dashboard
You don’t need to build your report from scratch—just start with a ready-to-use Dental Clinical Performance dashboard template from Mokkup. Add in your data and export it however you like. Here’s how to do it:
1. Create or Log in to Your Mokkup Account
Start by signing up on Mokkup.ai using your email. If you already have an account, just log in, and you’ll be good to go.
2. Choose and Customize Your Dashboard Template
Find the Dental Clinical Performance Dashboard template in the Templates section. Use the drag-and-drop editor to adjust KPIs, edit filters, or add elements based on your data.
3. Export to Your BI Tool
Once your dashboard wireframe is ready, use the BI Tool Export feature to send it directly to Power BI or Tableau for further analysis and enhancements. You can also download the dashboard as a PDF, PNG, or JPEG, embed it on a platform, or invite your team to collaborate.
Note: This is a Pro template. You’ll need a Pro subscription on Mokkup to use and customize this dashboard wireframe. Upgrade anytime to unlock full access.
Dental Clinical Performance Dashboard Example
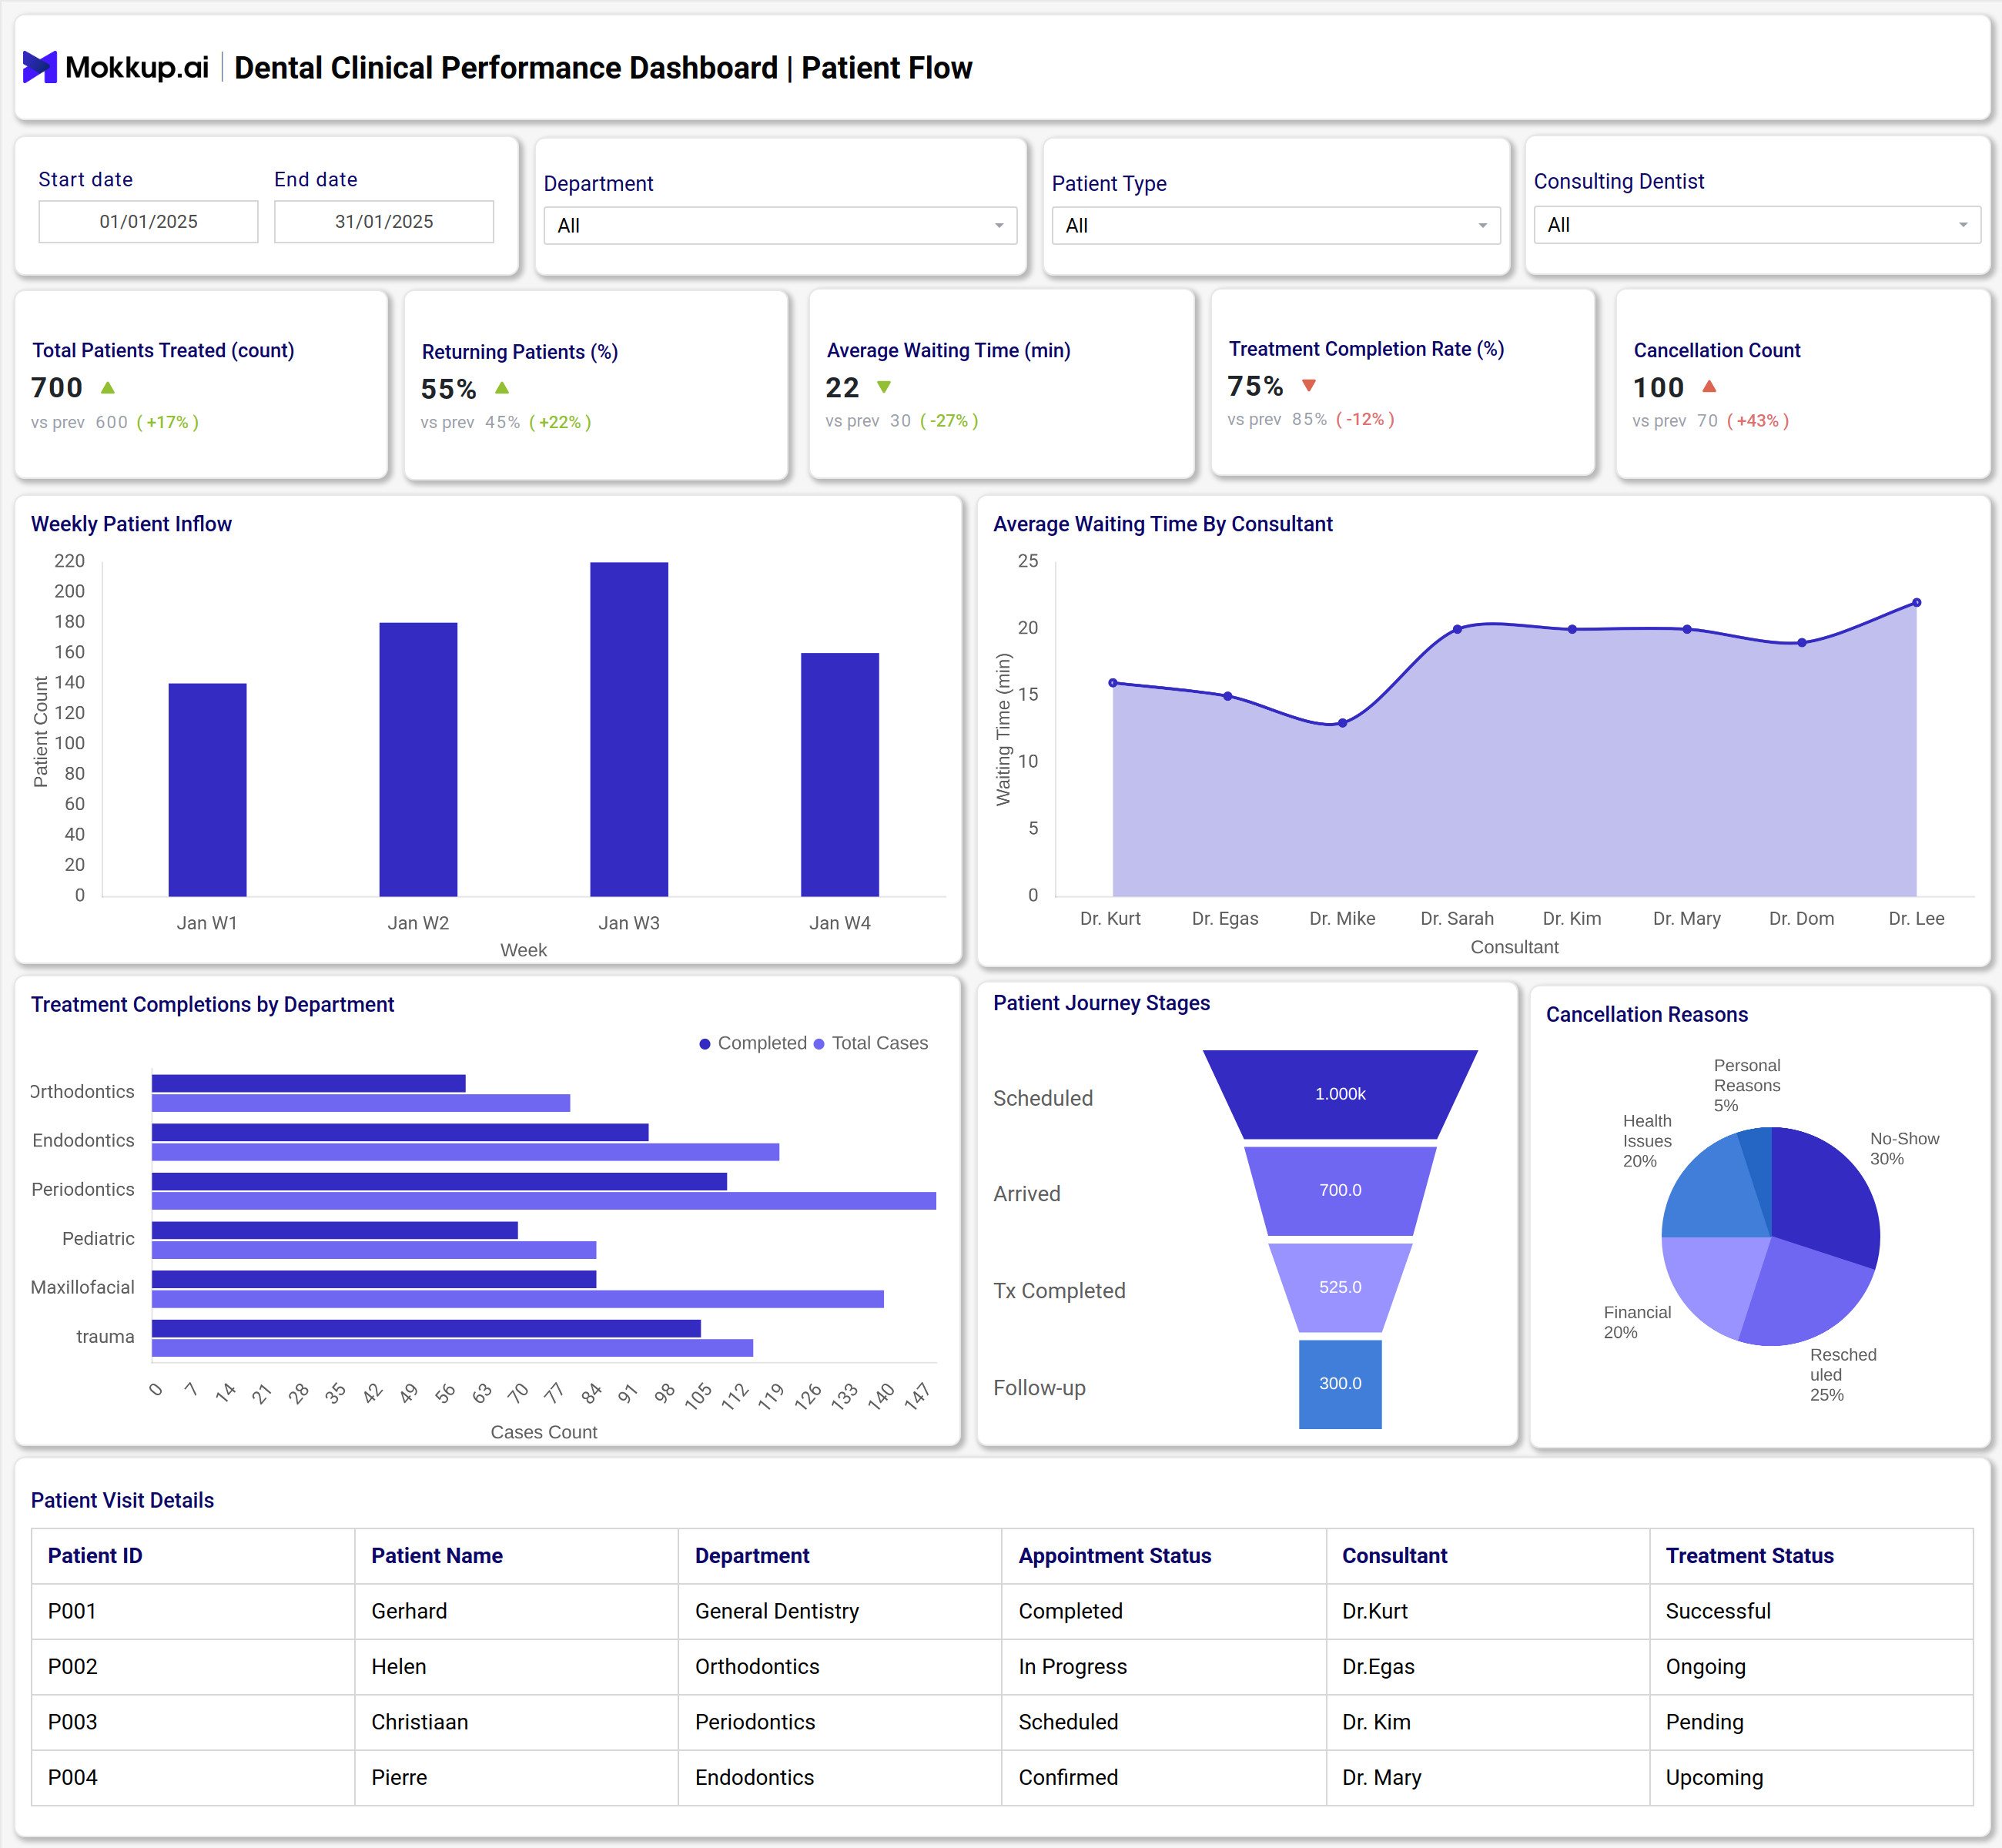
This dashboard wireframe offers a unified view of operational and clinical metrics by combining patient flow analytics and treatment effectiveness tracking into a single, user-friendly interface. Users can easily filter data by date, department, procedure type, or consulting dentist, making comparative analysis stress-free. For example, typical dashboards will present weekly patient inflow, percentage of returning patients, average waiting time, treatment completion rate, and cancellation counts.
Advanced sections break down treatment completions by department and reason for case cancellations, while other visualizations show outcome status, patient journey stages, patient follow-up distributions, and procedural performance across departments. With these features, dental practice outcomes analysis becomes accessible and actionable for teams looking to improve patient satisfaction and care efficiency.
How to Analyze Data in Dental Clinical Performance Dashboards
Analyzing dental performance data helps clinics identify operational bottlenecks, improve patient care, and ensure consistent clinical outcomes across departments:
- Review Patient Inflow & Waiting Time: Understand peak days and identify resource bottlenecks.
- Monitor Treatment Completion & Re-Treatments: Track department-wise performance and quality of care.
- Assess Patient Journey Stages: Identify drop-offs and uncover opportunities for patient engagement.
- Analyze Cancellation Reasons: Detect and address operational inefficiencies.
- Evaluate Procedure Success & Pain Scores: Measure treatment quality and patient satisfaction levels.
- Study Follow-Up & Root Canal Outcomes: Drive better clinical results through consistent tracking.
- Compare Performance Over Time: Monitor monthly or quarterly progress toward key clinical targets.
Benefits of Dental Clinical Performance Dashboards
A dental performance dashboard enables clinics to centralize patient and operational data, driving efficiency, quality, and informed decision-making:
- Centralized Clinical Data: Consolidates all dental metrics for actionable insights.
- Reduced Patient Wait Times: Identifies scheduling delays to improve patient experience.
- Improved Treatment Tracking: Monitors outcomes and re-treatments to uphold quality standards.
- Performance Evaluation: Enables clear assessment of departmental productivity and resource use.
- Compliance & Reporting Support: Simplifies automated dental health outcomes reporting.
- Enhanced Practice Analysis: Strengthens overall dental performance through effective data visualization.
KPIs to Track in Dental Clinical Performance Dashboards
Tracking key KPIs helps dental administrators measure patient flow, treatment quality, and operational efficiency:
- Total Patients Treated: Number of dental patients managed during the reporting period
- Returning Patients Percentage: Proportion of patients who revisit for further treatment
- Average Waiting Time: Mean minutes patients spend waiting for consultation
- Treatment Completion Rate: Percentage of treatments successfully completed out of total started
- Cancellation Count: Total number of cancelled appointments
- Root Canal Success Rate: Percentage of successful root canal procedures out of total performed
Frequently Asked Questions
Q1. Who should use a Dental Clinical Performance Dashboard?
Dental clinic managers, consultants, and administrative staff who want real-time insight into patient care metrics and treatment effectiveness.
Q2. Can this dashboard improve clinical decision-making?
Yes, it pinpoints trends in dental care quality, outcomes, and operational bottlenecks to support data-driven improvements.
Q3. Is technical knowledge needed to use the dashboard?
The dashboard template is designed for easy use, with intuitive visualizations and filters suitable for both clinicians and administrative staff.