
What is an ENT & Audiology Hospital & Institution Dashboard?
An Executive Dashboard for ENT & Audiology hospitals is a centralized platform for operational performance analytics, ENT education dashboard insights, and clinical outcomes tracking powered by Audiology training analytics. It monitors patient flow, resource utilization, surgical volume, bed occupancy, clinical quality metrics, and patient satisfaction. This dashboard empowers hospital executives to enhance operational efficiency, reduce bottlenecks, and ensure treatment excellence. By integrating hospital operations and clinical outcome insights, leaders can make real-time strategic decisions to optimize patient experience, capacity utilization, and overall hospital performance.
How to Create an ENT & Audiology Hospital & Institution Dashboard?
You don’t need to build your report from scratch-just start with a ready-to-use dashboard template from Mokkup. Add your data and export it as needed. Here’s how to do it:
1. Create or Log in to Your Mokkup Account
Start by signing up on Mokkup.ai using your email. If you already have an account, simply log in, and you’ll be all set.
2. Choose and Customize Your Dashboard Template
Find the ENT & Audiology Hospital & Institution Dashboard template in the Templates section. Use the drag-and-drop editor to adjust KPIs, edit filters, or add elements based on your data.
3. Export to Your BI Tool
Once your dashboard wireframe is ready, use the BI Tool Export feature to send it directly to Power BI or Tableau for further analysis and enhancements. You can also download the dashboard as a PDF, PNG, or JPEG, embed it on a platform, or invite your team to collaborate.
Note: This is a Pro template. You’ll need a Pro subscription on Mokkup to use and customize this dashboard wireframe. Upgrade anytime to unlock full access.
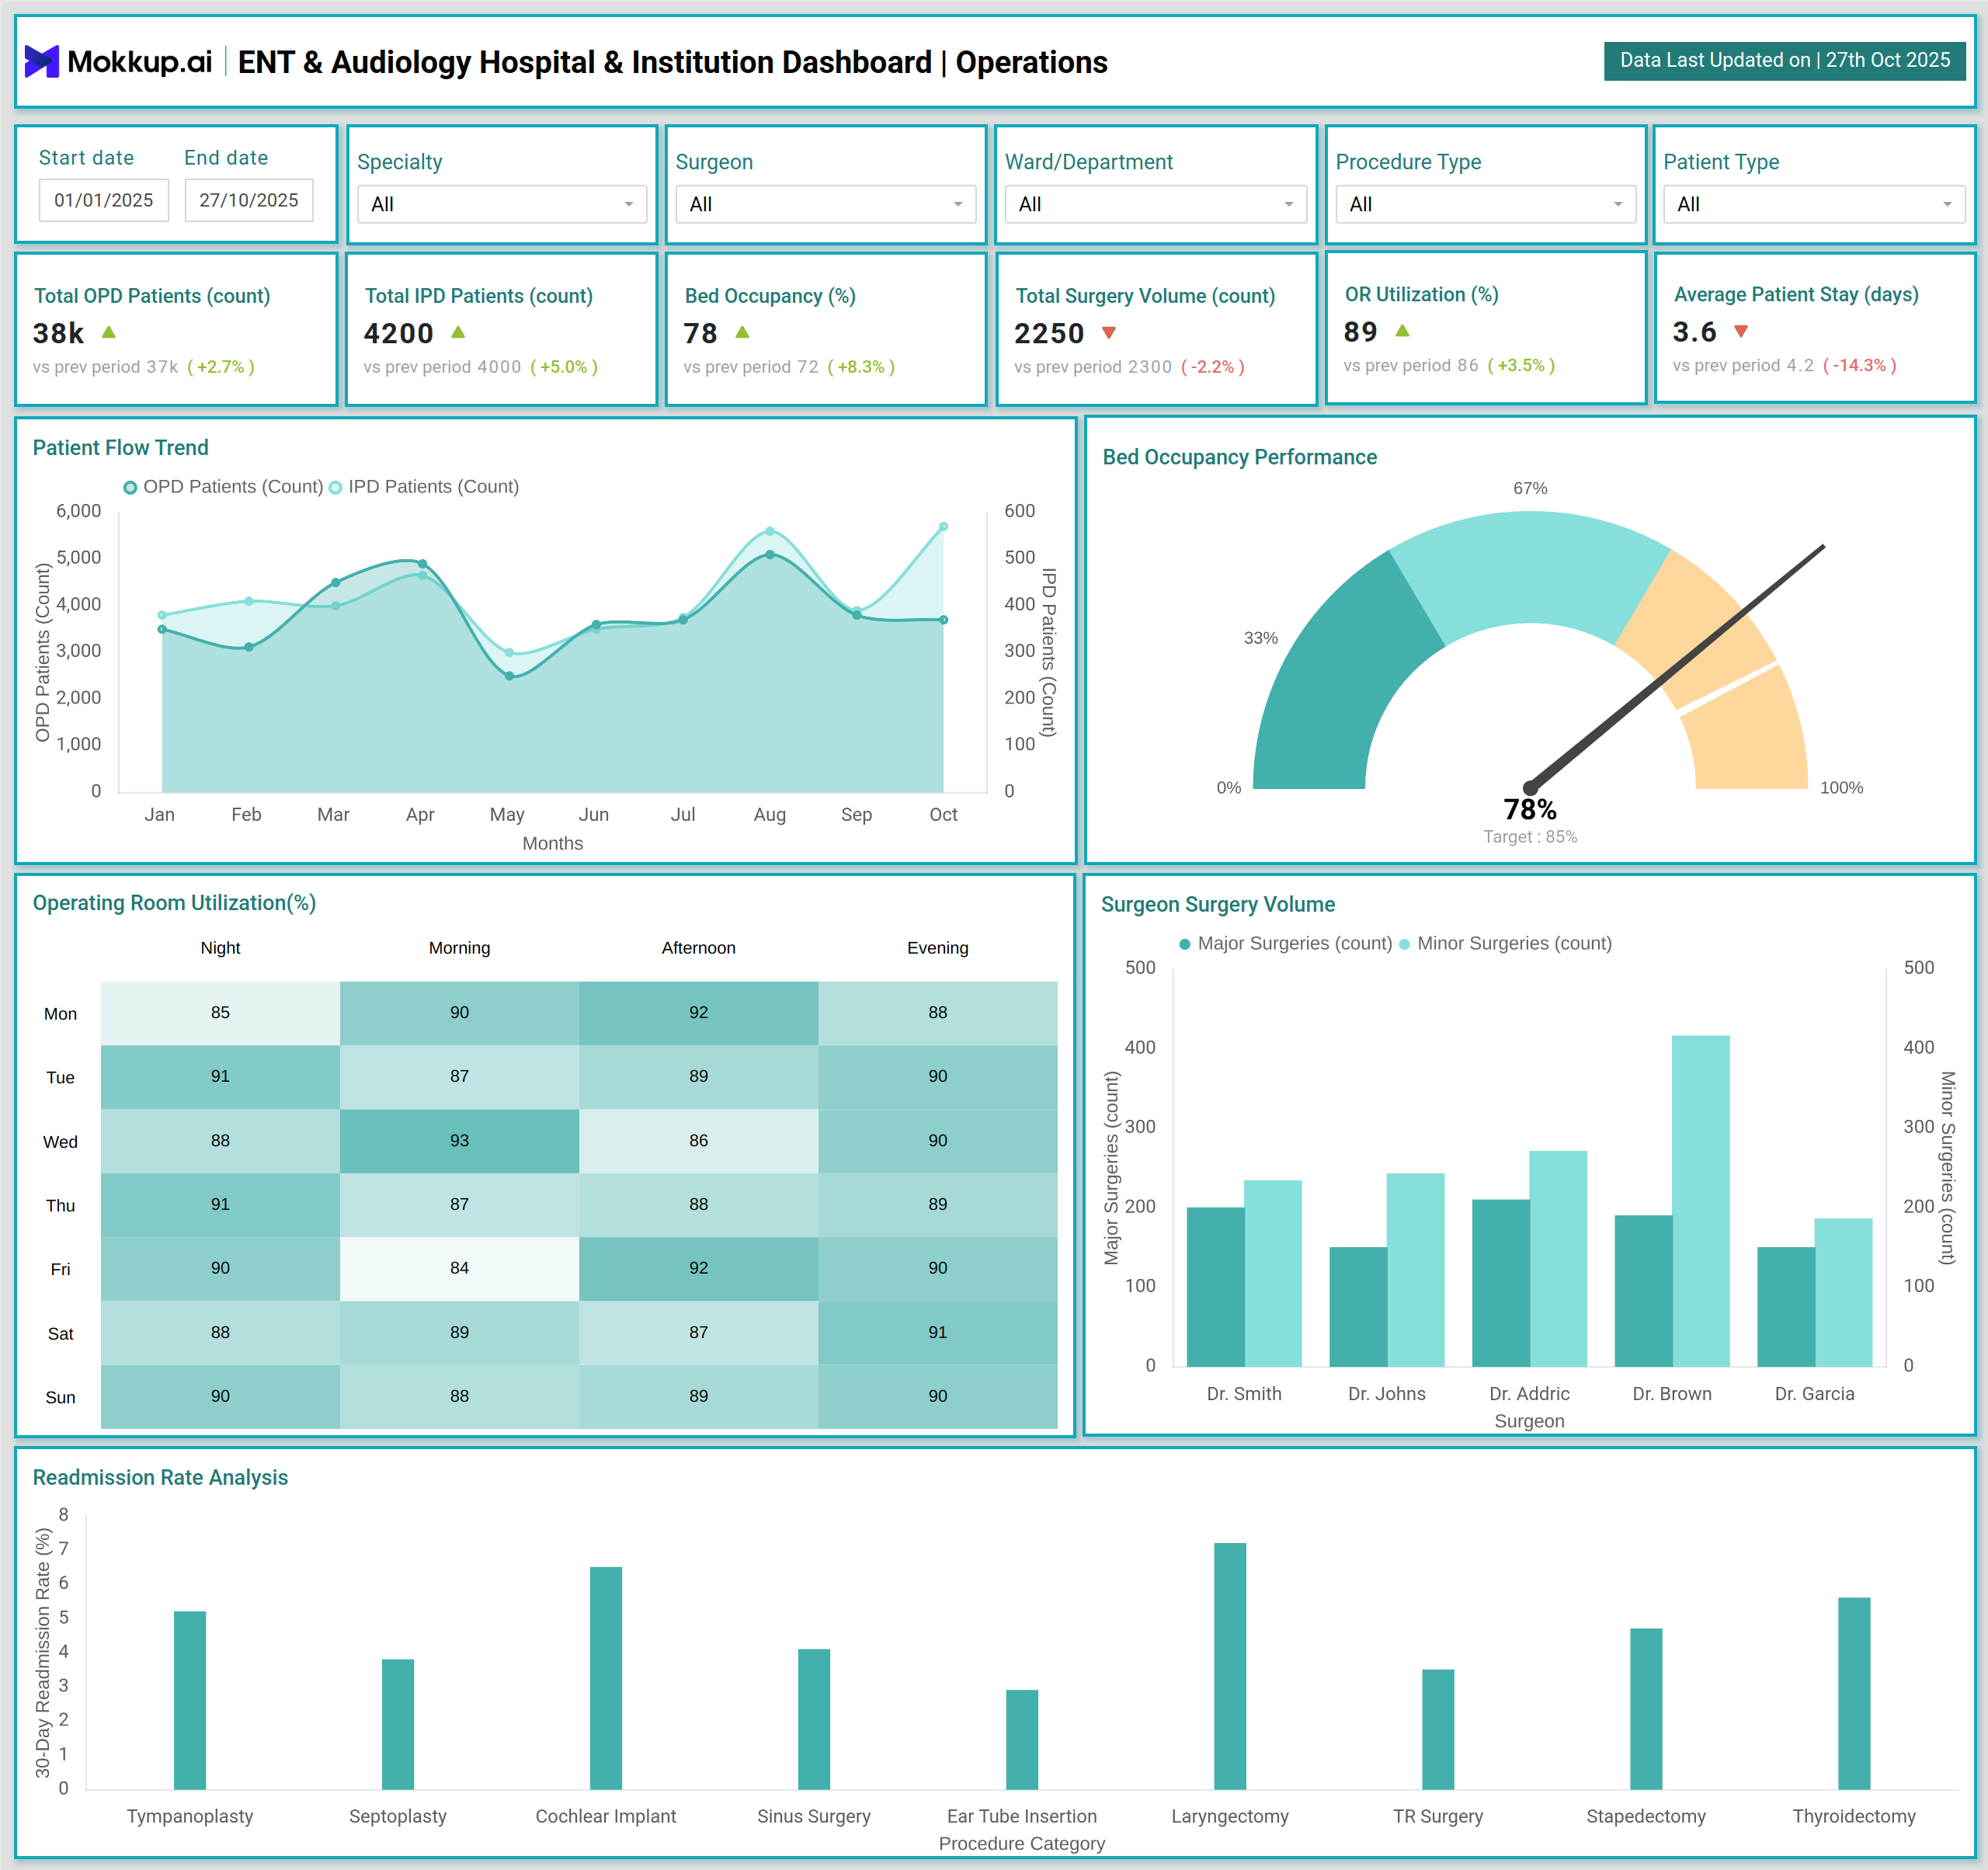
ENT & Audiology Hospital & Institution Dashboard Example
The Hospital Operations view focuses on tracking medical education performance, along with OPD/IPD patient volumes, bed occupancy, surgeries, OR utilization, and LOS efficiency. This supports stronger operational decision-making, demand forecasting, and optimal resource planning while maintaining service quality. Meanwhile, the Clinical Outcomes Performance view emphasizes clinical exposure monitoring, patient satisfaction, treatment success, readmissions, and audiology-specific care metrics to ensure consistent treatment quality, detect care gaps early, and enhance overall patient outcomes.
How to Analyse Data in an ENT & Audiology Hospital & Institution Dashboard?
Here is how you can analyze data from this dashboard wireframe:
- Start with KPIs: Monitor demand, capacity, surgery volume, LOS variance, and incorporate faculty workload analytics for better governance.
- Assess Efficiency: Quickly identify operational bottlenecks across wards, OR schedules, and high-risk procedures to streamline care delivery.
- Track Cost & Resource Utilization: Optimize staffing, bed usage, and surgical slot allocation through data-driven planning.
- Analyze Patient Flow Trends: Compare OPD vs. IPD performance by time period, specialty, and physician to enhance patient movement.
- Detect High-Risk Indicators: Drill into readmissions and patient satisfaction by demographics or region using a research productivity dashboard to support evidence-based improvements.
Benefits of an ENT & Audiology Hospital & Institution Dashboard
These are some of the benefits of using this dashboard:
- Real-time monitoring of operational & clinical performance enables early insights into treatment efficiency, clinical exposure monitoring, and quality of care delivery.
- Improved OR scheduling, bed utilization, and patient flow ensure optimized resource allocation and reduced intra-facility congestion, facilitating timely treatment.
- Reduction in readmissions and care delays through proactive tracking of recovery progress and early warning indicators in patient journeys.
- Better resource allocation and workload balancing support efficient staff deployment and maintain instructional strength through academic competency insight.
- Supports executive-level decision-making with centralized analytics combining operational KPIs and clinical outcome trends.
- Strengthens accountability across departments by utilizing transparent performance dashboards that are aligned with governance and compliance standards.
- Enhances patient experience and outcomes by identifying care gaps, improving service processes, and ensuring consistent clinical excellence.
KPIs to Track in ENT & Audiology Hospital & Institution Dashboard
- Total OPD Patients -Tracks outpatient visit load to support medical education performance tracking and operational demand forecasting in the ENT education dashboard.
- Total IPD Patients -Measures admitted patient volume to evaluate bed pressure, care timelines, and clinical exposure monitoring for trainees.
- Bed Occupancy % - Assesses how efficiently inpatient beds are used and highlights constraints affecting care delivery and teaching rounds.
- Audiology Tests Performed (Count) -Indicates auditory diagnostic throughput and supports audiology training analytics for practical skill development.
- Hearing Aid Fittings (Count) -Reflects effectiveness in hearing rehabilitation services and aids performance governance in ENT & audiology programs.
- Patient Satisfaction Score (NPS/%) -Evaluates perceived care quality and service impact, supporting holistic outcomes monitoring for both patients and clinical learners.
Frequently Asked Questions
1. Who should use an ENT & Audiology Hospital & Institution Dashboard?
This dashboard is designed for healthcare leaders, academic directors, clinical managers, and ENT specialists responsible for performance evaluation and teaching governance. It supports decision-making across hospital operations, clinical outcomes, and medical education monitoring.
2. How does this dashboard improve both hospital operations and clinical quality?
By integrating KPIs like OPD/IPD volumes, bed occupancy, OR utilization, audiology throughput, and patient satisfaction, the dashboard enables early detection of efficiency gaps and treatment risks. Administrators can simultaneously improve capacity planning, optimize staff workload, and enhance care outcomes.
3. Can this dashboard support ENT education and Audiology training insights?
Yes -medical education performance tracking and audiology training analytics are built in. Metrics such as case exposure, diagnostic test counts, and faculty workload help ensure that students maintain the required clinical competency while hospitals maintain high-quality service delivery.