What is a Dental Academic Dashboard?
A Dental Academic Dashboard is a data visualization tool designed specifically for dental schools and institutions to monitor and improve clinical and academic performance. It centralizes crucial metrics such as case volume, student clinical hours, procedure types, treatment outcomes, and satisfaction scores using real-time data.
Using a dashboard, dental educators and administrators get a clear view of dental hygiene education, curriculum tracking, and student performance metrics in one place. This dashboard provides actionable insights for decision-making, compliance, accreditation, and continuous improvement in dental education.
How to Create a Dental Academic Dashboard
You don’t need to build your report from scratch—just start with a ready-to-use dashboard template from Mokkup. Add in your data and export it however you like. Here’s how to do it:
1. Create or Log in to Your Mokkup Account
Start by signing up on Mokkup.ai using your email. If you already have an account, just log in, and you’ll be good to go.
2. Choose and Customize Your Dashboard Template
Find the Dental Academic Dashboard template in the Templates section. Use the drag-and-drop editor to adjust KPIs, edit filters, or add elements based on your data.
3. Export to Your BI Tool
Once your dashboard wireframe is ready, use the BI Tool Export feature to send it directly to Power BI or Tableau for further analysis and enhancements. You can also download the dashboard as a PDF, PNG, or JPEG, embed it on a platform, or invite your team to collaborate.
Note: This is a Pro template. You’ll need a Pro subscription on Mokkup to use and customize this dashboard wireframe. Upgrade anytime to unlock full access.
Dental Academic Dashboard Example
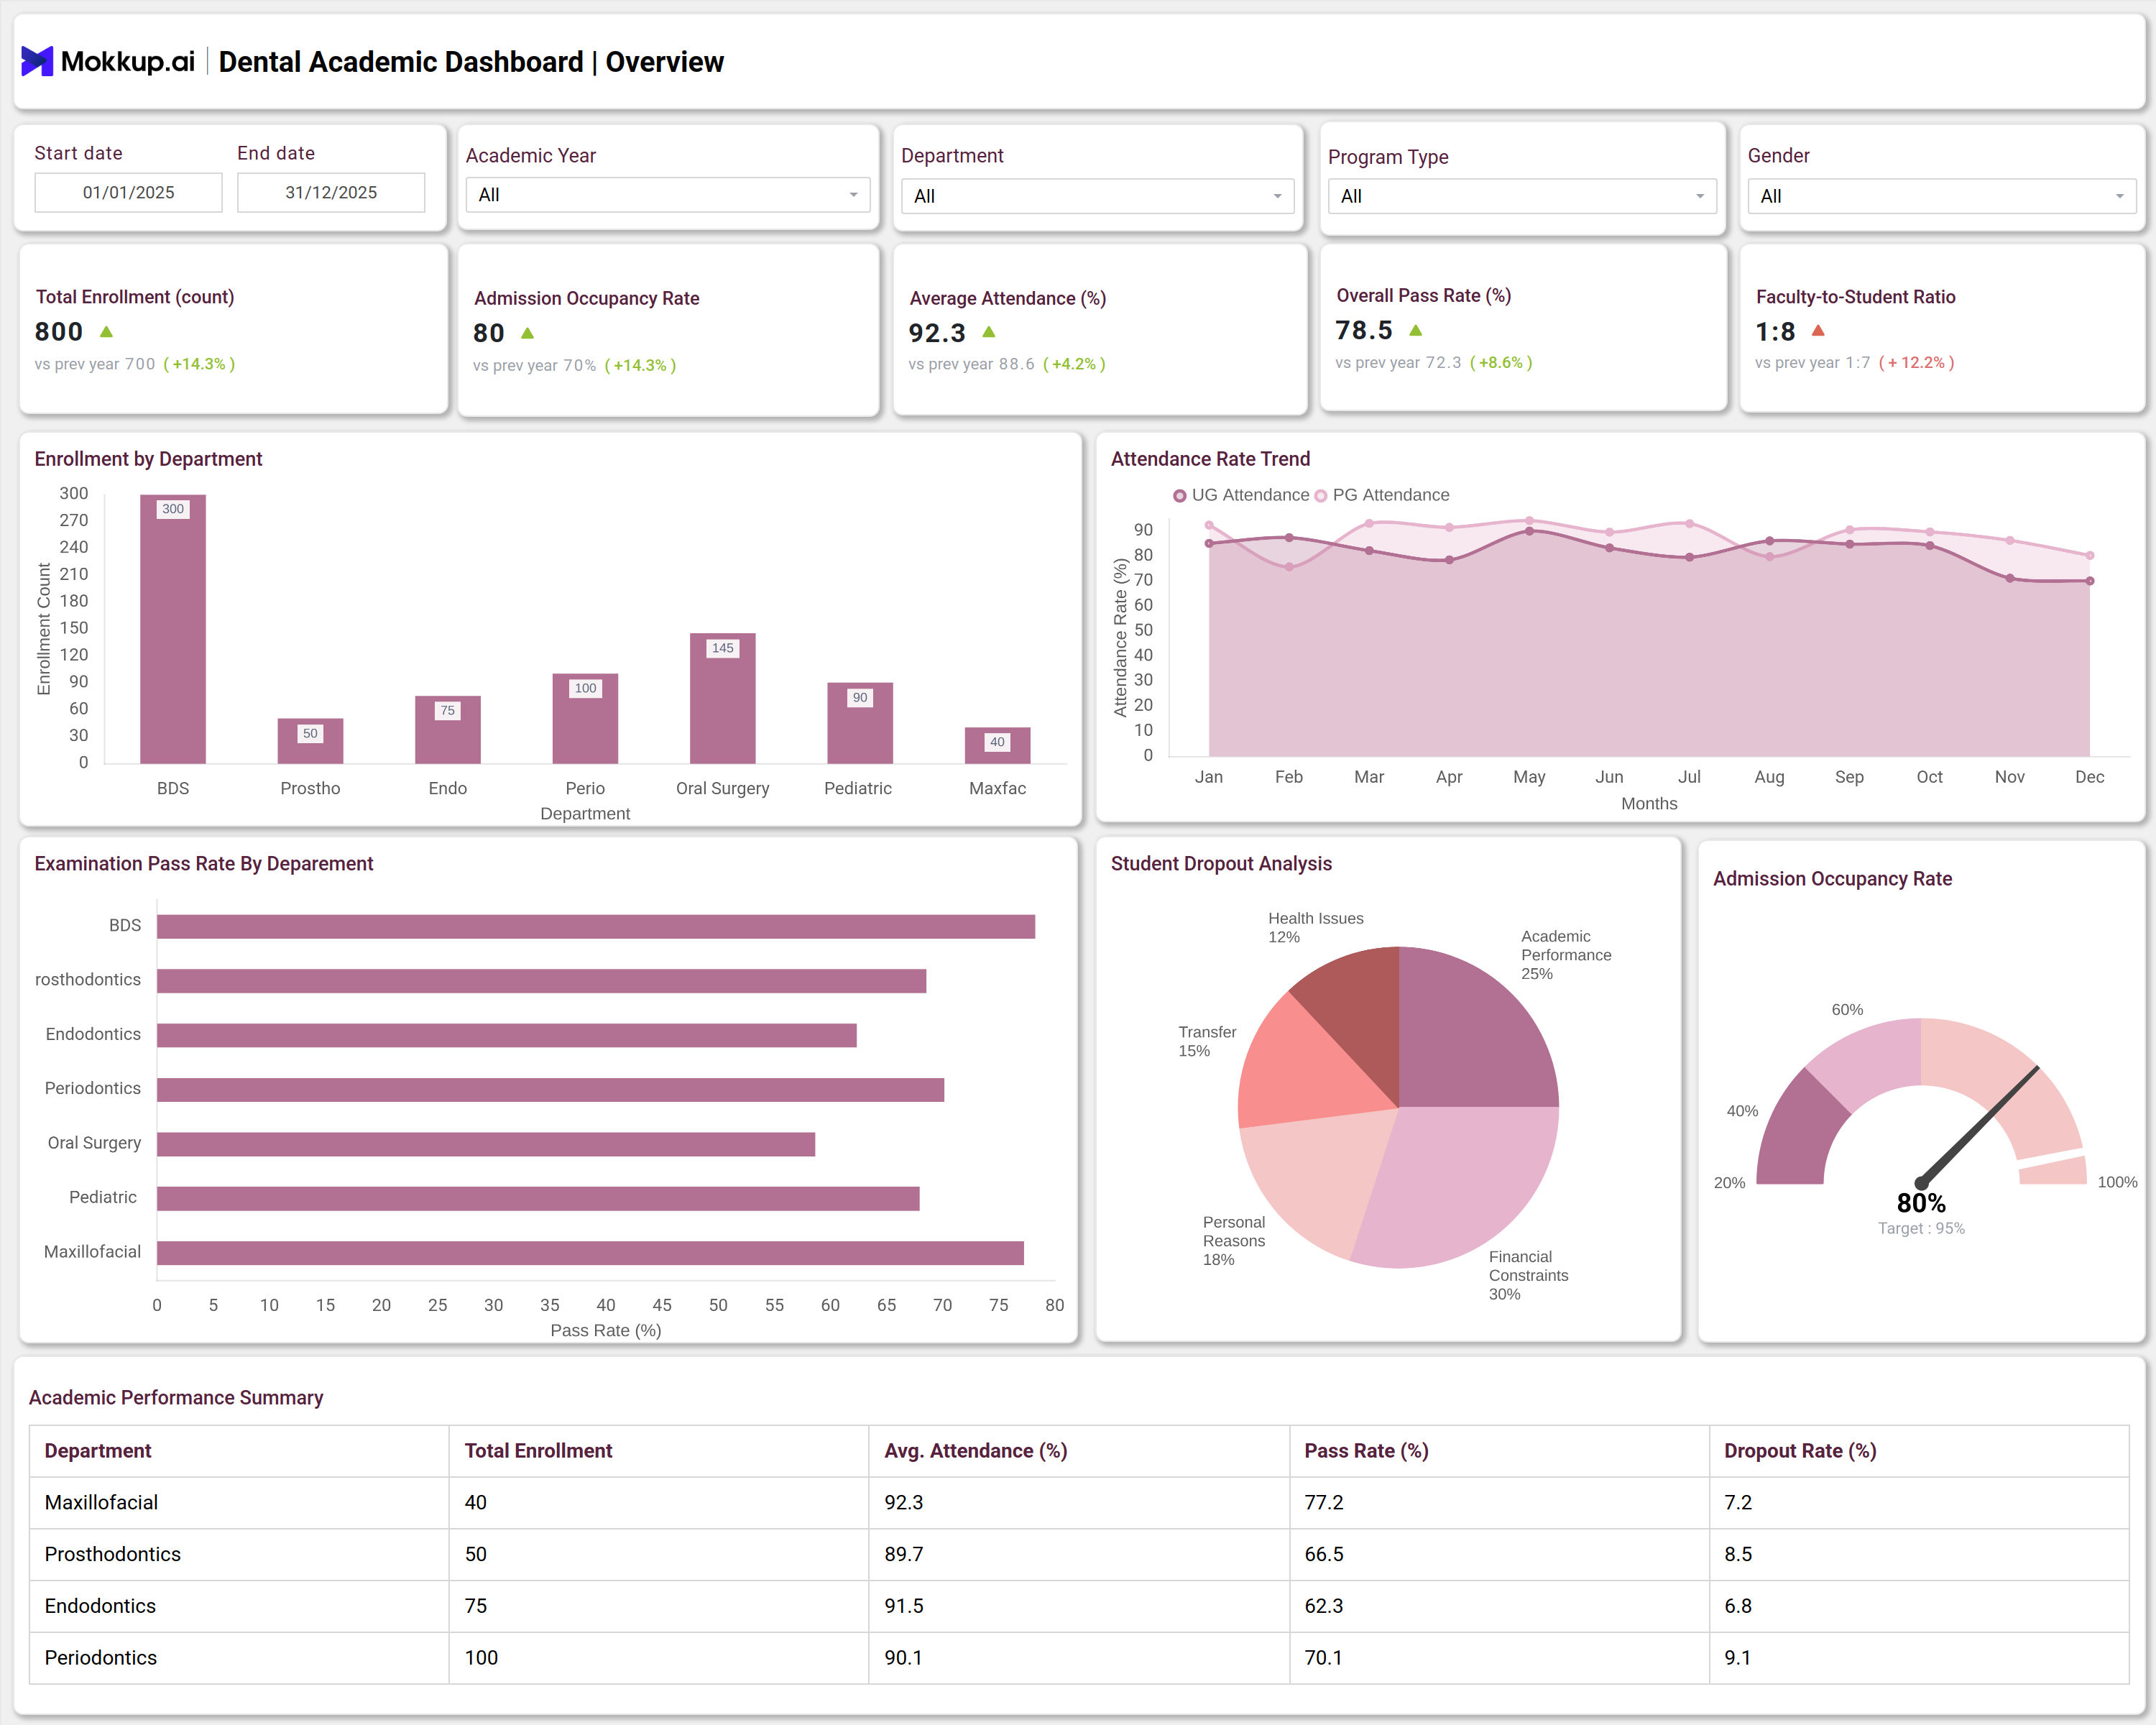
A Dental Academic Dashboard typically displays clinical and academic KPIs tailored to the requirements of dental schools. For instance, users can filter data by department, treatment type, or year of study. Key panels display the total number of clinical cases, the average number of instances per student, treatment success rates, patient satisfaction, and the average daily clinical hours.
Visuals, such as bar graphs, pie charts, and trend lines, present information on department-wise case distribution, treatment type breakdown, patient satisfaction, and case handling time. Academic overview panels include enrollment by department, pass rates, faculty-to-student ratios, and dropout analysis. These visualizations enable faculty to monitor student progress, identify gaps in clinical training, and ensure curriculum compliance. This type of dashboard streamlines reporting, supports curriculum improvement, and enhances the overall quality of dental school operations.
How to Analyze Data in Dental Academic Dashboards
Track the data in the Dental school dashboard in the following ways:
- Track total clinical cases and case type distributions for evaluating department workload.
- Monitor the average number of cases per student to assess student clinical engagement and practical exposure.
- Analyze treatment success rates to pinpoint strengths and address clinical weaknesses.
- Measure patient satisfaction to improve service quality and patient-centric training.
- Review monthly clinical trends to identify seasonal shifts and training workflow bottlenecks.
- Check department performance by reviewing detailed breakdowns of case volume, student involvement, and clinical hours.
- Utilize dropout and attendance statistics to address issues related to retention and academic engagement.
Benefits of Dental Academic Dashboards
This dashboard can be used by dental hospitals, offering benefits like:
- Improves real-time visibility into clinical and academic metrics.
- Supports data-driven decision-making for educators and administrators.
- Centralizes student performance metrics, academic engagement, and curriculum outcomes.
- Simplifies compliance and reporting for accreditation and regulatory standards.
- Identifies bottlenecks in training and clinical workload distribution.
- Enhances dental education analytics and curriculum tracking with intuitive visuals.
KPIs to Track in Dental Academic Dashboards
You can track the following dental student performance metrics from this dashboard:
- Total Clinical Cases: Number of cases managed by students to track practical experience.
- Average Cases per Student: Indicates individual student clinical activity.
- Treatment Success Rate: Measures the percentage of successful treatments, highlighting clinical quality.
- Patient Satisfaction: Reflects feedback from patients on care provided by students.
- Average Clinical Hours per Day: Tracks time spent by students in clinical training.
- Enrollment by Department: Monitors the number of students in each dental specialty.
Frequently Asked Questions
1. What types of institutions need a Dental Academic Dashboard?
A Dental Training Dashboard is valuable for dental schools, universities, teaching hospitals, and continuing education centers focusing on dental hygiene education and clinical training.
2. Can dental dashboards be customized for specific departments?
Yes, dashboards can be customized to track and visualize KPIs for specific departments such as orthodontics, periodontics, oral surgery, and pediatric dentistry.
3. How do dashboards help with dental curriculum tracking?
Dashboards consolidate curriculum milestones, student progress, and certification requirements in one platform, making it easier to manage and audit academic compliance.