
What is an ENT & Audiology Healthcare Finance Dashboard?
An ENT & Audiology Healthcare Finance Dashboard is a centralized platform designed to monitor financial performance, patient volume, and operational efficiency. It allows hospital administrators, finance managers, and executives to track revenue streams, cost structures, and profitability trends. By combining patient footfall data, billing, claims, and service-specific revenue, it ensures data-driven decision-making. The dashboard also supports financial performance tracking for specialized ENT hospitals, enabling monitoring of profit margins, cost recovery, and departmental efficiency. Overall, it empowers hospitals to optimize financial health, reduce wastage, and enhance operational decision-making.
How to Create an ENT & Audiology Healthcare Finance Dashboard
You don’t need to build your report from scratch-just start with a ready-to-use dashboard template from Mokkup. Add your data and export it as needed. Here’s how to do it:
1. Create or Log in to Your Mokkup Account
Start by signing up on Mokkup.ai using your email. If you already have an account, simply log in, and you’ll be all set.
2. Choose and Customize Your Dashboard Template
Find the ENT & Audiology Healthcare Finance Dashboard template in the Templates section. Use the drag-and-drop editor to adjust KPIs, edit filters, or add elements based on your data.
3. Export to Your BI Tool
Once your dashboard wireframe is ready, use the BI Tool Export feature to send it directly to Power BI or Tableau for further analysis and enhancements. You can also download the dashboard as a PDF, PNG, or JPEG, embed it on a platform, or invite your team to collaborate.
Note: This is a Pro template. You’ll need a Pro subscription on Mokkup to use and customize this dashboard wireframe. Upgrade anytime to unlock full access.
ENT & Audiology Healthcare Finance Dashboard Example
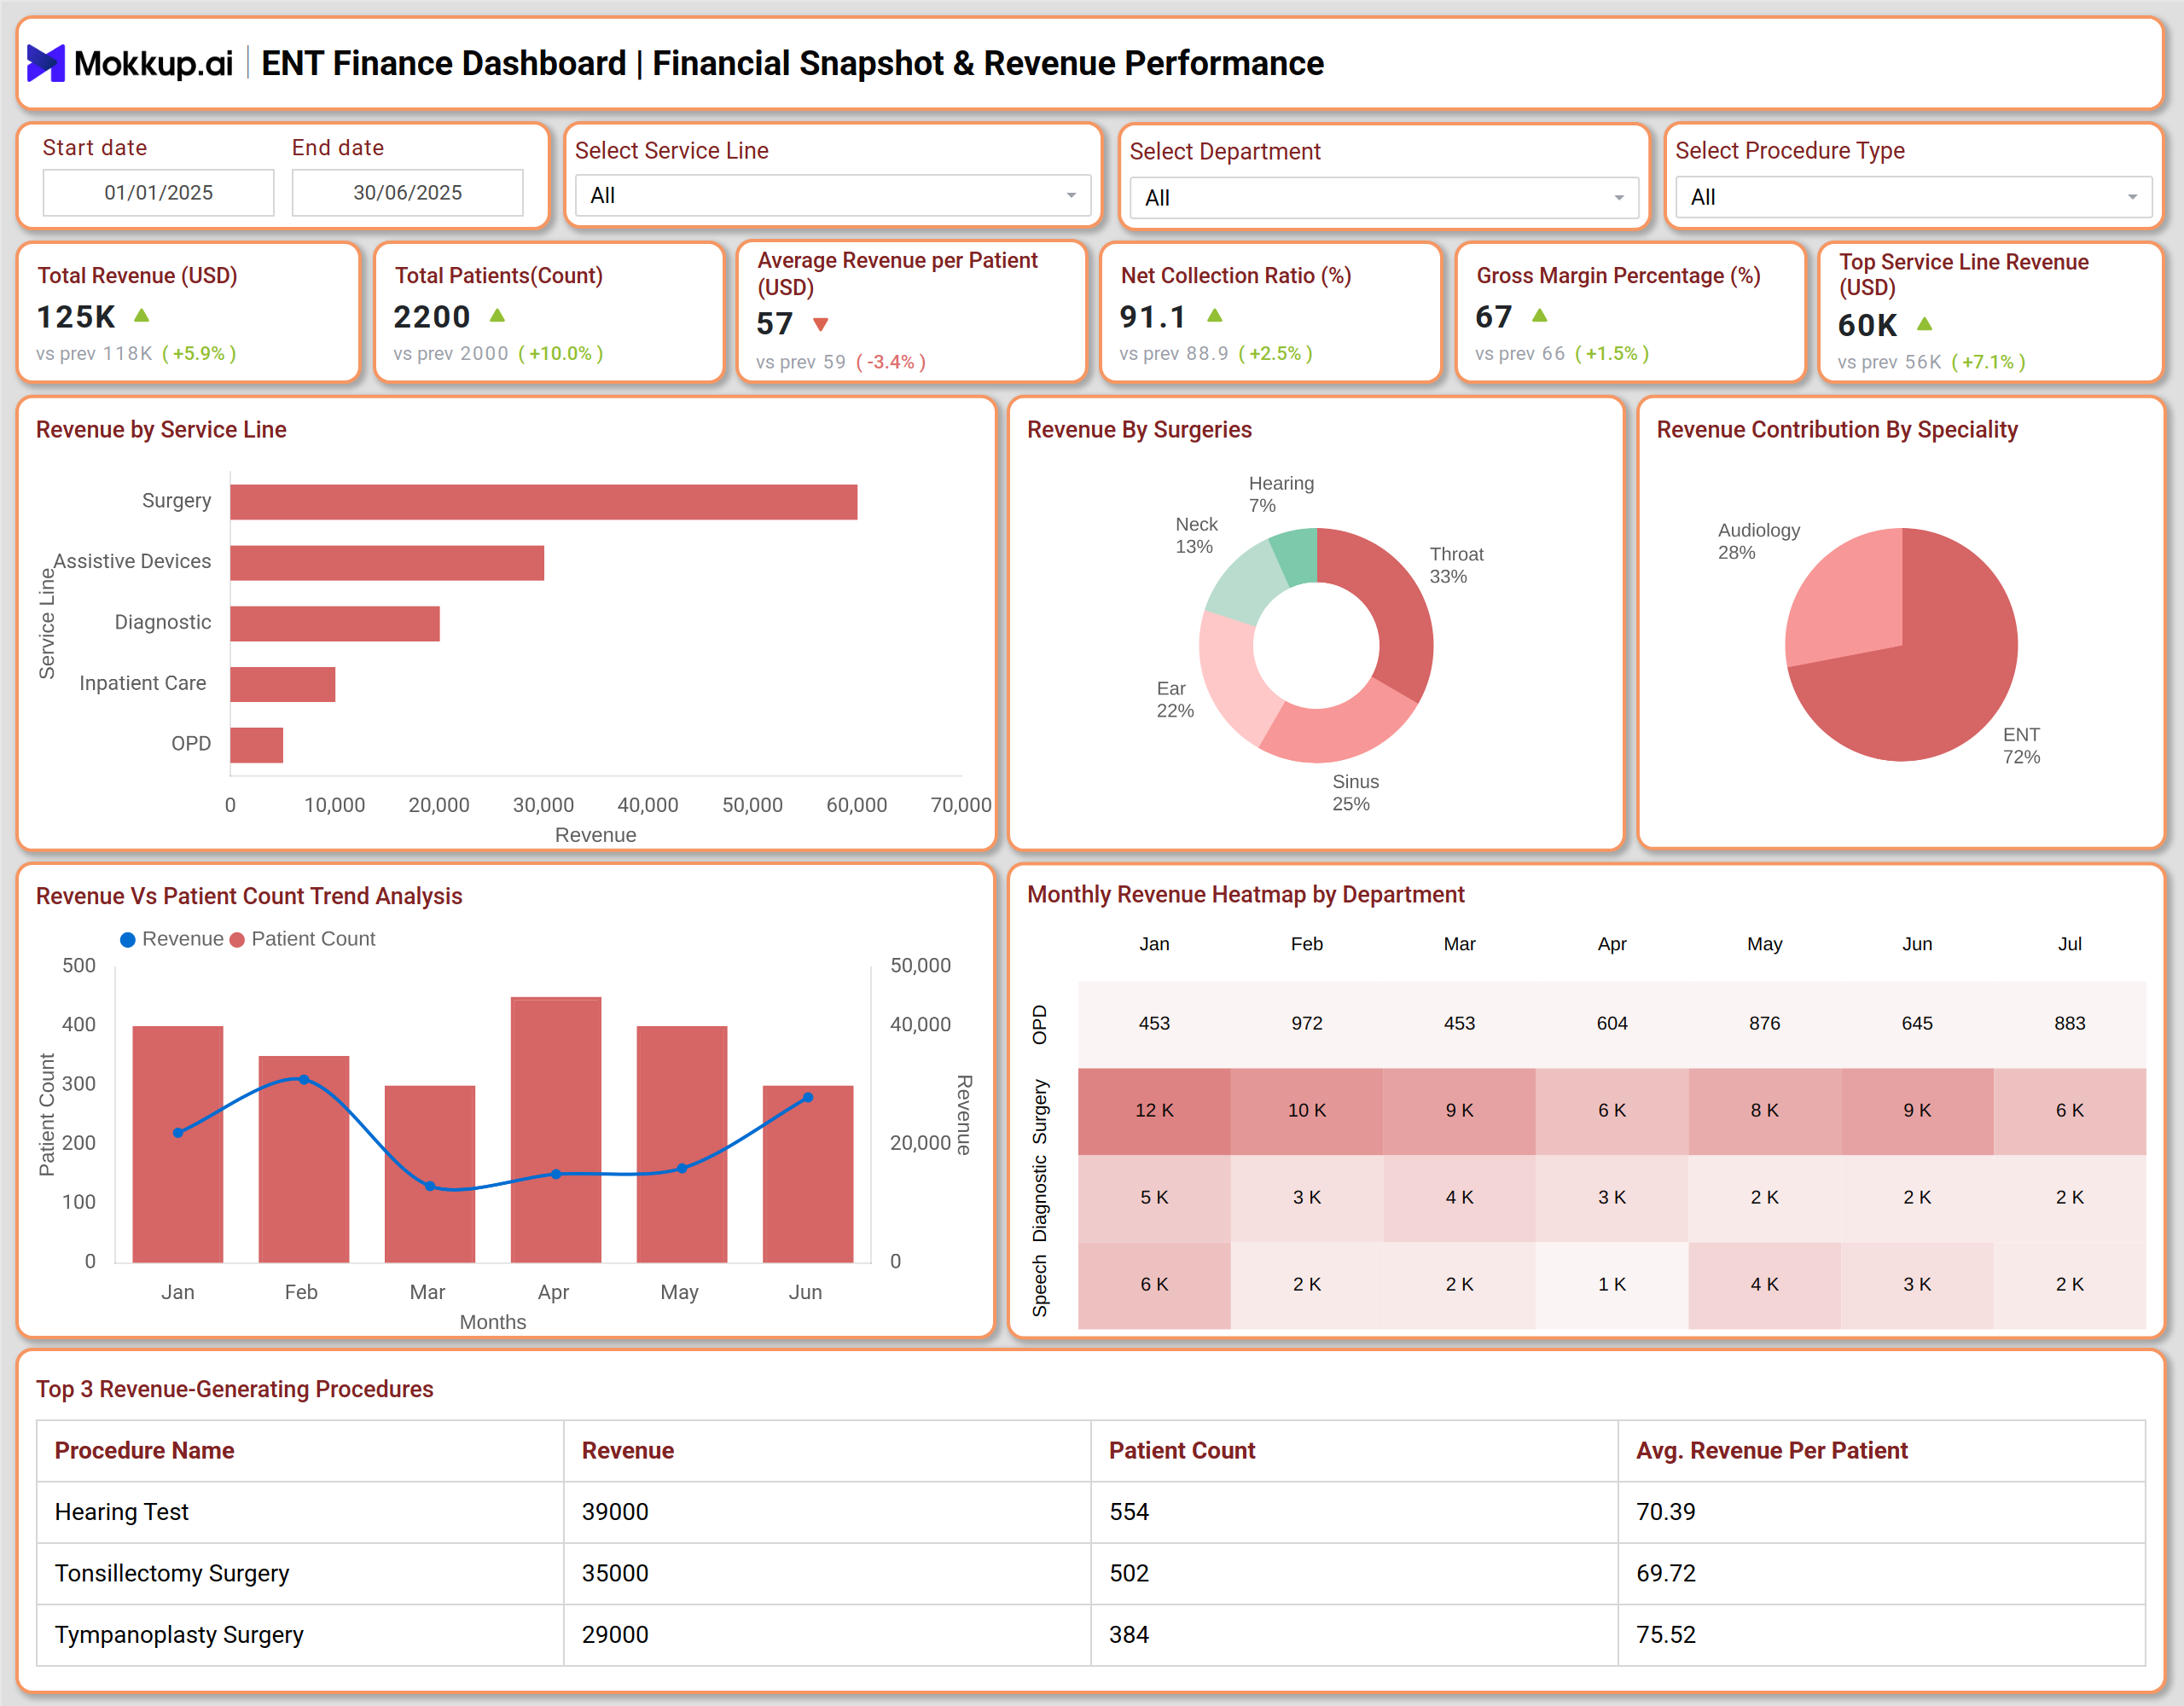
The dashboard provides a comprehensive view of hospital financial performance by tracking overall revenue, patient-to-revenue conversion, and top services driving financial health. It monitors operating costs, profit margins, and departmental efficiency to highlight both high-cost and high-margin services. Additionally, it analyzes patient volume, billing patterns, and claim rejections to support operational planning, revenue optimization, and cost management, making it especially valuable for improving profitability in audiology healthcare centers.
How to Analyse Data in an ENT & Audiology Healthcare Finance Dashboard
- Start with KPIs - Evaluate Total Revenue, average revenue per Patient, Net Collection, and Gross Margin to understand financial health and track financial performance for specialized ENT hospitals.
- Assess Cost Efficiency -Compare operating costs, Cost per Patient, and OER across departments to identify inefficiencies and apply cost management and profitability analysis in audiology healthcare centers.
- Track Profit Trends -Use profit margin and cost recovery metrics to monitor high-performing vs low-margin services and evaluate revenue optimization strategies for ENT and Audiology hospitals.
- Patient & Billing Insights -Analyze patient volume trends, claim rejections, and outstanding payments to optimize collections, following best practices for billing and collections in ENT & Audiology clinics.
- Identify Patterns & Anomalies -Apply filters by service line, department, or time period to detect underperforming programs or high-cost areas. This also supports healthcare finance management solutions for ENT institutions.
Benefits of an ENT & Audiology Hospital Finance Dashboard
- Real-time insights on revenue, costs, and patient volume -Provides instant visibility into financial and operational metrics.
- Enables data-driven decision-making for financial and operational efficiency -Supports informed choices to improve hospital performance.
- Optimizes departmental resource allocation and cost management -Helps assign resources effectively while controlling expenses.
- Enhances billing, claims tracking, and cash collection efficiency -Streamlines revenue cycle processes for faster collections.
- Highlights high-value procedures and underperforming areas, identifying profitable services and areas that need improvement.
- Strengthens transparency and trust among executives and stakeholders -Builds confidence through precise, accessible financial data.
KPIs to Track in ENT & Audiology Hospital Finance Dashboard
- Total Revenue & Avg Revenue per Patient -Shows overall income and revenue earned per patient.
- Gross Margin % & Net Collection Ratio -Measures profitability and efficiency of cash collections.
- Total Operating Cost & Cost Recovery Ratio -Tracks total expenses and how much cost is recovered from revenue.
- Net Profit / Surplus & Profit Margin % -Indicates actual earnings and profitability percentage.
- Patient Footfall & Claim Rejection Rate -Monitors patient visits and insurance claim denials.
Frequently Asked Questions
1. How can comparing revenue vs patient volume trends improve service planning?
It identifies services where patient foot traffic is high, but revenue is low, helping managers optimize pricing or service packages.
2. How does equipment cost distribution affect departmental profitability?
Understanding equipment-related costs helps allocate high-cost devices efficiently and prioritize high-margin procedures.
3. Why is service-line specific cost and revenue analysis critical for ENT hospitals?
It allows administrators to identify which services are highly profitable or underperforming, aiding cost management and profitability analysis in audiology healthcare centers.