
What is an Employee Billable Time & Utilization Dashboard?
A consultant billable time and utilization dashboard is a data-driven analytics tool designed to monitor, analyze, and optimize how consulting firms track employee productivity, billable hours, and project profitability. Unlike generic time tracking systems, this dashboard consolidates billable hours, non-billable work, paid time off (PTO), and utilization rates into a single view, enabling firms to identify inefficiencies, improve resource allocation, and maximize revenue. For professional services firms, whether management consulting, financial advisory, or IT consulting. Every hour spent on client work directly impacts profitability. This best dashboard for consultant time and billing analysis helps leaders compare billable vs. non-billable hours, track utilization trends, and assess project performance by consultant, department, or client. By integrating data from time tracking software, project management tools, and HR systems, the dashboard provides actionable insights to reduce revenue leakage, optimize staffing, and enhance client delivery.
How to Create an Employee Billable Time & Utilization Dashboard
You don’t need to build your report from scratch, just start with a ready-to-use dashboard template from Mokkup. Add in your data and export it however you like. Here’s how to do it:
1. Create or Log in to Your Mokkup Account
Start by signing up on Mokkup.ai using your email. If you already have an account, just log in, and you’ll be good to go.
2. Choose and Customize Your Dashboard Template
Find the Employee Billable Time & Utilization Dashboard template in the Templates section. Use the drag-and-drop editor to adjust KPIs, edit filters, or add elements based on your data.
3. Export to Your BI Tool
Once your dashboard wireframe is ready, use the BI Tool Export feature to send it directly to Power BI or Tableau for further analysis and enhancements. You can also download the dashboard as a PDF, PNG, or JPEG, embed it on a platform, or invite your team to collaborate.
Note: This is a Pro template. You’ll need a Pro subscription on Mokkup to use and customize this dashboard wireframe. Upgrade anytime to unlock full access.
Employee Billable Time & Utilization Dashboard Example
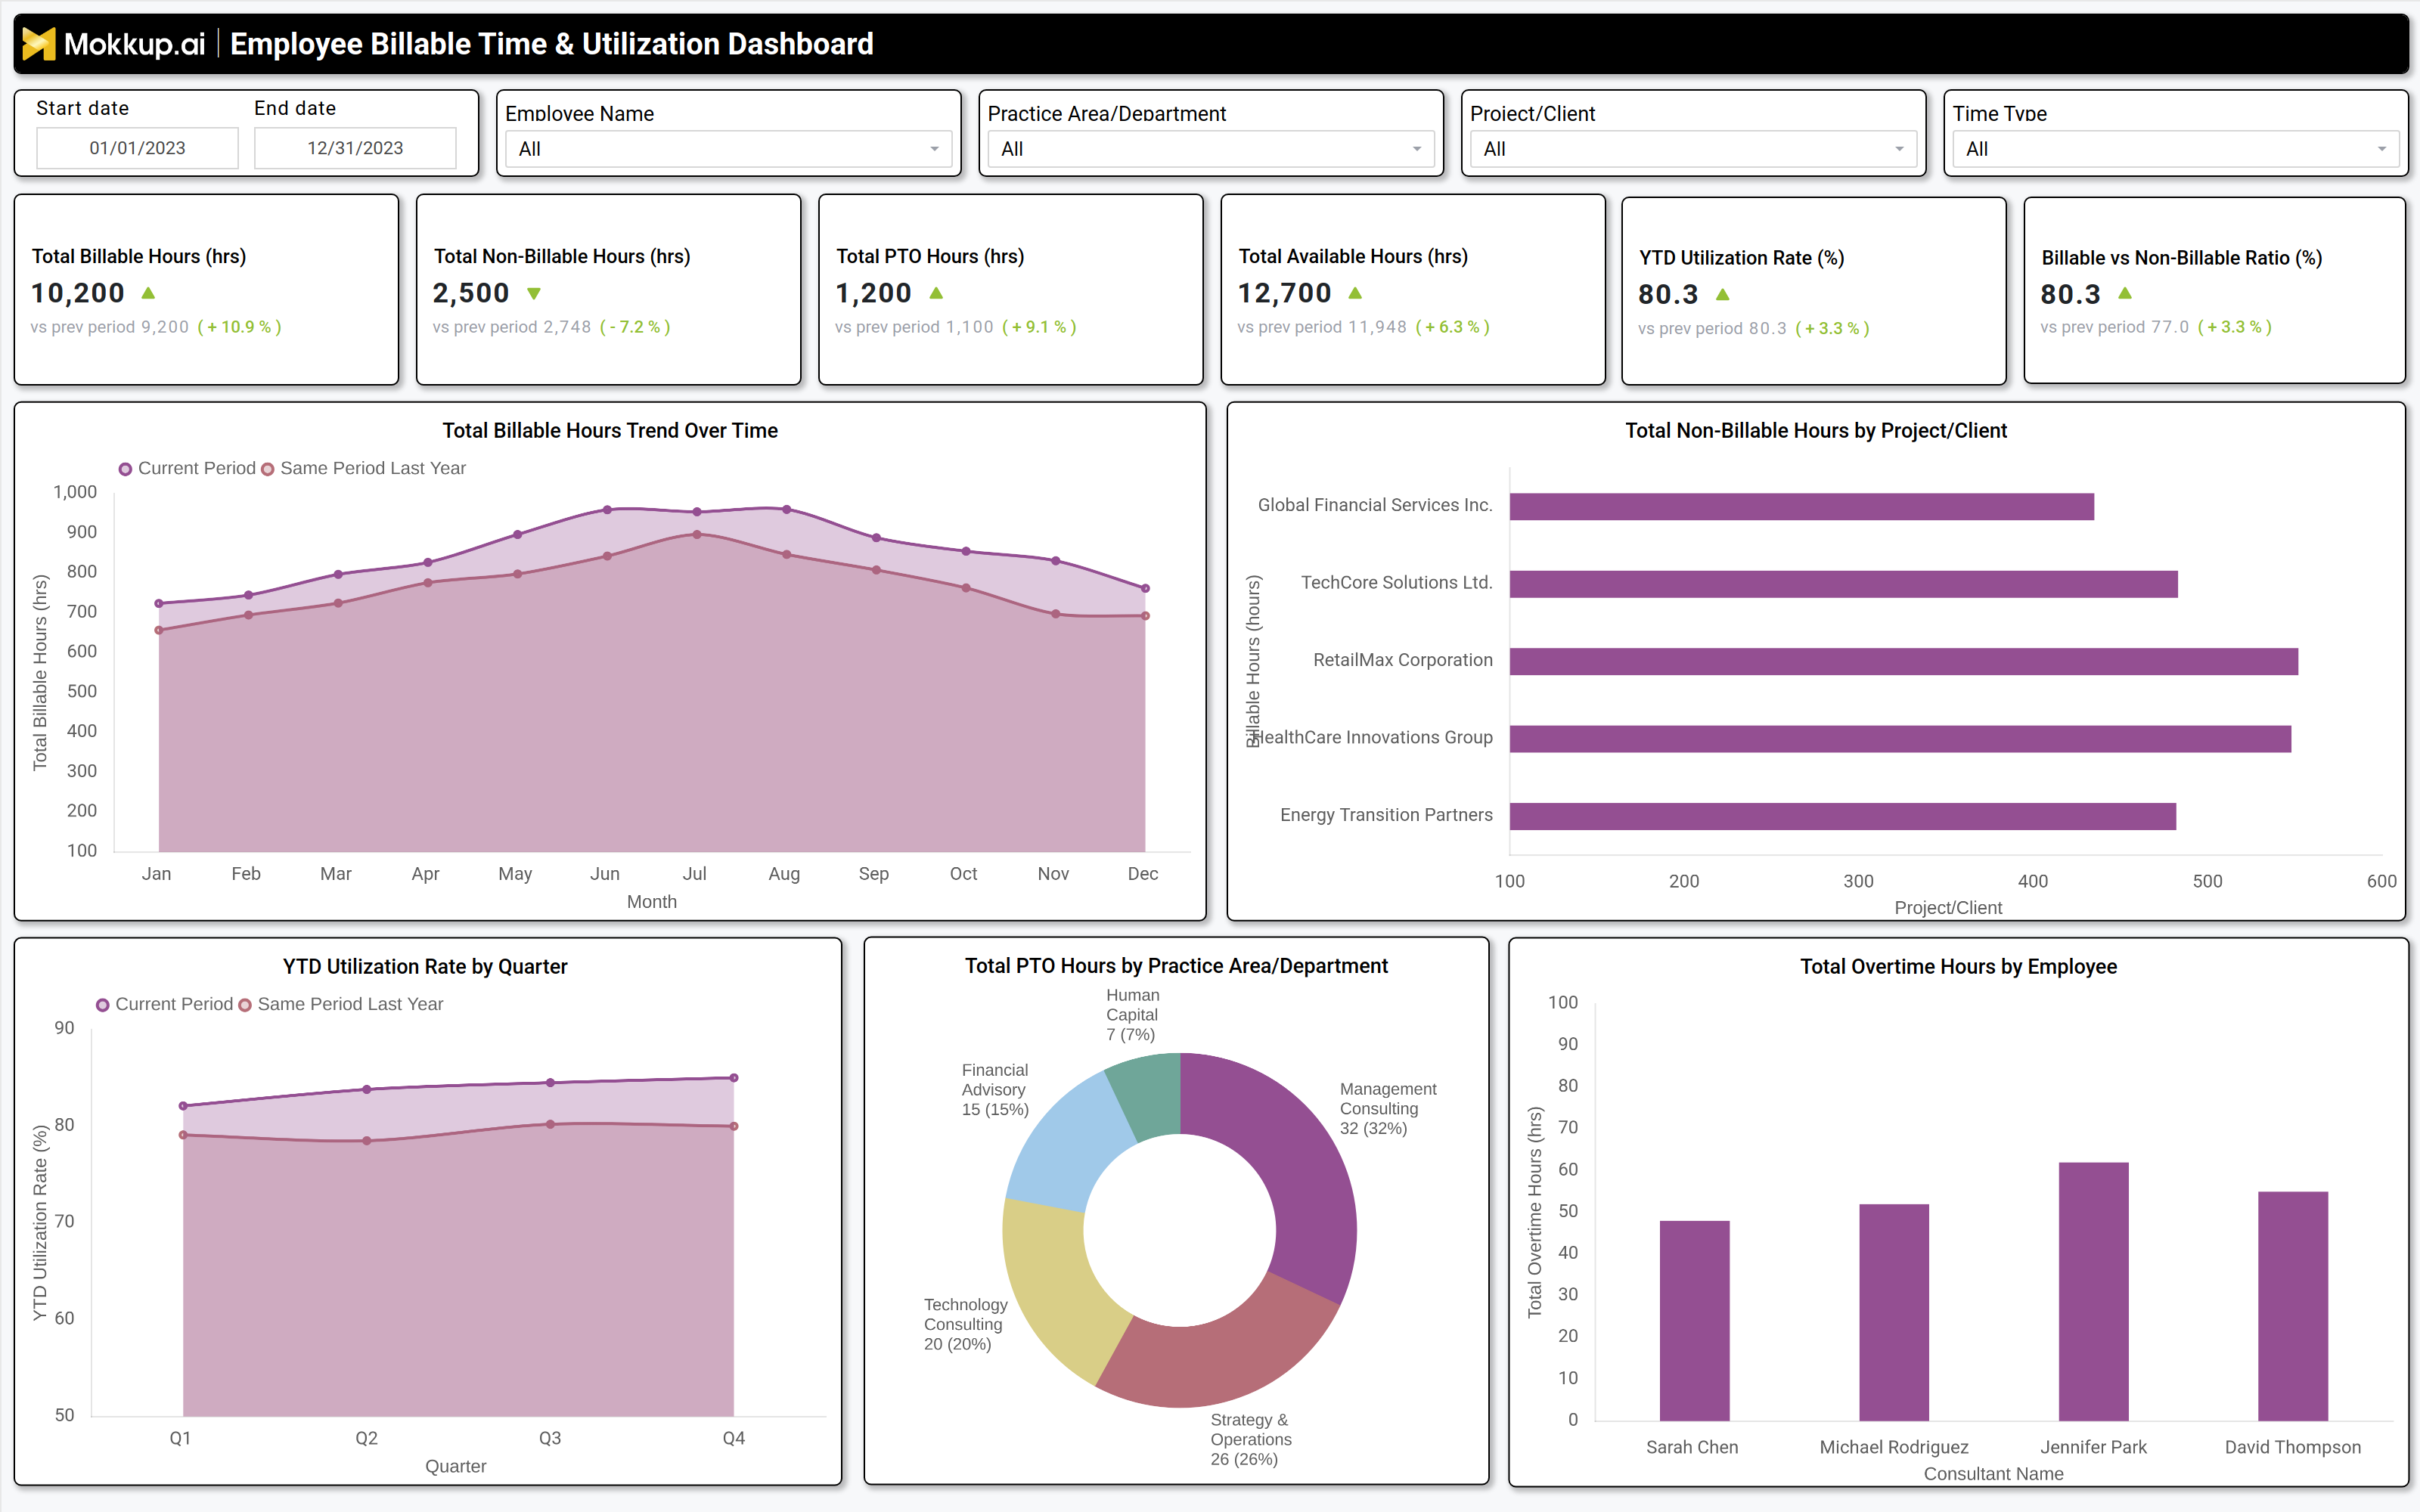
A well-structured advisory services utilization rate dashboard template includes interactive filters for date ranges, consultant names, practice areas, and project types, allowing users to drill down into specific metrics. Key performance tiles display total billable hours, non-billable hours, PTO, available hours, year-to-date (YTD) utilization rate, and billable vs. non-billable ratios, with comparisons against previous periods to highlight trends. Trend charts display billable hours over time, enabling firms to identify seasonal fluctuations or project delays. A breakdown of non-billable hours by client or project reveals where time is being spent on internal work, training, or administrative tasks. The dashboard also includes utilization rates by quarter, PTO distribution by department, and overtime hours by consultant, providing a comprehensive view of workforce efficiency. Together, these components create a centralized platform that enables consulting firms to monitor productivity, control costs, and enhance profitability.
How to Analyze Data in an Employee Billable Time & Utilization Dashboard
Here is how you can analyze data from this consulting firm billable hours tracking dashboard:
- Compare billable vs. nonbillable hours to identify revenue leakage and inefficiencies.
- Track YTD utilization rates to ensure consultants meet productivity targets (70–85% is ideal).
- Monitor PTO trends to balance workload distribution and prevent burnout.
- Analyze nonbillable hours by project/client to reduce unproductive time.
- Review overtime hours by consultants to detect workload imbalances or staffing shortages.
- Assess billable hours trends to forecast demand and adjust staffing levels.
- Compare current performance with previous periods to measure improvement or decline.
- Use department-level breakdowns to pinpoint high- or low-performing teams.
Benefits of an Employee Billable Time & Utilization Dashboard
The following are the benefits of using this consulting project time tracking and reporting dashboard:
- Increase revenue: Identify and reduce unrecorded billable hours to capture missed revenue opportunities.
- Improve resource allocation: Match consultants to high-value projects based on skills, availability, and profitability.
- Enhance productivity: Track utilization rates and minimize non-billable work to maximize output.
- Reduce revenue leakage: Ensure accurate time tracking and billing to prevent losses.
- Support data-driven staffing: Forecast demand and capacity to make informed hiring and staffing decisions.
- Optimize project profitability: Analyze billable hours per client to focus on the most profitable engagements.
- Improve workforce planning: Monitor PTO and overtime trends to balance workloads effectively.
- Enable faster decision-making: Use workforce analytics to gain timely insights and act quickly.
KPIs to Track in an Employee Billable Time & Utilization Dashboard
The following key KPIs can be tracked by using this professional services workforce utilization dashboard:
- Total Billable Hours (hrs) – Measures the total time consultants spend on client work.
- Total Non-Billable Hours (hrs) – Tracks time spent on internal tasks, training, or admin work.
- Total PTO Hours (hrs) – Monitors paid time off to balance workload and employee well-being.
- Total Available Hours (hrs) – Calculates the total working hours available for billable and non-billable work.
- YTD Utilization Rate (%) – Shows the percentage of available hours spent on billable work.
- Billable vs. NonBillable Ratio (%) – Compares billable hours to total worked hours to assess efficiency.
Frequently Asked Questions
1. What is a consultant billable time and utilization dashboard used for?
It helps consulting firms track billable hours, monitor utilization rates, and optimize workforce productivity to maximize revenue and profitability.
2. What data sources feed into this dashboard?
Timetracking software (e.g., Harvest, Toggl), project management tools (e.g., Asana, Jira), and HR systems.
3. Who should use a consultant billable time and utilization dashboard?
Consulting firm leaders, project managers, finance teams, and HR professionals.